For your convenience Apress has placed some of the front
matter material after the index. Please use the Bookmarks
Contents at a Glance
About the Authors ...
xiii
Acknowledgments ...
xv
Introduction ...
xvii
■
Chapter 1: Big Data Solutions and the Internet of Things ...
1
■
Chapter 2: Evaluating the Art of the Possible ...
29
■
Chapter 3: Understanding the Business ...
49
■
Chapter 4: Business Information Mapping for Big Data and
Internet of Things ...
. 79
■
Chapter 5: Understanding Organizational Skills ...
99
■
Chapter 6: Designing the Future State
Information Architecture ...
115
■
Chapter 7: Defining an Initial Plan and Roadmap ...
139
■
Chapter 8: Implementing the Plan ...
165
■
Appendix A: References ...
181
■
Appendix B: Internet of Things Standards ...
185
Introduction
The genesis of this book began in 2012. Hadoop was being explored in mainstream organizations, and we believed that information architecture was about to be
transformed. For many years, business intelligence and analytics solutions had centered on the enterprise data warehouse and data marts, and on the best practices for defining, populating, and analyzing the data in them. Optimal relational database design for structured data and managing the database had become the focus of many of these efforts. However, we saw that focus was changing.
For the first time, streaming data sources were seen as potentially important in solving business problems. Attempts were made to explore such data experimentally in hope of finding hidden value. Unfortunately, many efforts were going nowhere. The authors were acutely aware of this as we were called into many organizations to provide advice.
We did find some organizations that were successful in analyzing the new data sources. When we took a step back, we saw a common pattern emerging that was leading to their success. Prior to starting Big Data initiatives, the organizations’ stakeholders had developed theories about how the new data would improve business decisions. When building prototypes, they were able to prove or disprove these theories quickly.
This successful approach was not completely new. In fact, many used the same strategy when developing successful data warehouses, business intelligence, and advanced analytics solutions that became critical to running their businesses. We describe this phased approach as a methodology for success in this book. We walk through the phases of the methodology in each chapter and describe how they apply to Big Data and Internet of Things projects.
Back in 2012, we started to document the methodology and assemble artifacts that would prove useful when advising our clients, regardless of their technology footprint. We then worked with the Oracle Enterprise Architecture community, systems integrators, and our clients in testing and refining the approach.
At times, the approach led us to recommend traditional technology footprints. However, new data sources often introduced a need for Hadoop and NoSQL database solutions. Increasingly, we saw Internet of Things applications also driving new footprints. So, we let the data sources and business problems to be solved drive the architecture.
■ INTRODUCTION
Our intent is to provide you with a solid grounding as to how and why the
components should be brought together in your future state information architecture. We take you through a methodology that establishes a vision of that future footprint; gathers business requirements, data, and analysis requirements; assesses skills; determines information architecture changes needed; and defines a roadmap. Finally, we provide you with some guidance as to things to consider during the implementation.
We believe that this book will provide value to enterprise architects where much of the book’s content is directed. But we also think that it will be a valuable resource for others in IT and the lines of business who seek success in these projects.
CHAPTER 1
Big Data Solutions and the
Internet of Things
This book begins with a chapter title that contains two of the most hyped technology concepts in information architecture today: Big Data and the Internet of Things. Since this book is intended for enterprise architects and information architects, as well as anyone tasked with designing and building these solutions or concerned about the ultimate success of such projects, we will avoid the hype. Instead, we will provide a solid grounding on how to get these projects started and ultimately succeed in their delivery. To do that, we first review how and why these concepts emerged, what preceded them, and how they might fit into your emerging architecture.
The authors believe that Big Data and the Internet of Things are important evolutionary steps and are increasingly relevant when defining new information
architecture projects. Obviously, you think the technologies that make up these solutions could have an important role to play in your organization’s information architecture as you are reading this book. Because we believe these steps are evolutionary, we also believe that many of the lessons learned previously in developing and deploying information architecture projects can and should be applied in Big Data and Internet of Things projects.
Enterprise architects will continue to find value in applying agile methodologies and development processes that move the organization’s vision forward and take into account business context, governance, and the evolution of the current state architecture into a desired future state. A critical milestone is the creation of a roadmap that lays out the prioritized project implementation phases that must take place for a project to succeed.
Organizations already successful in defining and building these next generation solutions have followed these best practices, building upon previous experience they had gained when they created and deployed earlier generations of information architecture. We will review some of these methodologies in this chapter.
CHAPTER 1 ■ BIG DATA SOLUTIONS AND THE INTERNET OF THINGS
In this book, we consider Big Data initiatives that commonly include traditional data warehouses built with relational database management system (RDBMS) technology, Hadoop clusters, NoSQL databases, and other emerging data management solutions. We extend the description of initiatives driving the adoption of the extended information architecture to include the Internet of Things where sensors and devices with intelligent controllers are deployed. These sensors and devices are linked to the infrastructure to enable analysis of data that is gathered. Intelligent sensors and controllers on the devices are designed to trigger immediate actions when needed.
So, we begin this chapter by describing how Big Data and the Internet of Things became part of the long history of evolution in information processing and architecture. We start our description of this history at a time long before such initiatives were imagined. Figure 1-1 illustrates the timeline that we will quickly proceed through.
Figure 1-1. Evolution in modern computing timeline
From Punched Cards to Decision Support
There are many opinions as to when modern computing began. Our historical description starts at a time when computing moved beyond mechanical calculators. We begin with the creation of data processing solutions focused on providing specific information. Many believe that an important early data processing solution that set the table for what was to follow was based on punched cards and equipment invented by Herman Hollerith.
CHAPTER 1 ■ BIG DATA SOLUTIONS AND THE INTERNET OF THINGS
level of education, and more. The desire for more of these key performance indicators (KPIs) combined with population growth drove the need for a more automated approach to data collection and processing. Hollerith’s punched card solution addressed these needs. By the 1930s, the technology had become widely popular for other kinds of data processing applications such as providing the footprint for accounting systems in large businesses.
The 1940s and the World War II introduced the need to solve complex military problems at a faster pace, including the deciphering of messages hidden by encryption and calculating the optimal trajectories for massive guns that fired shells. The need for rapid and incremental problem solving drove the development of early electronic computing devices consisting of switches, vacuum tubes, and wiring in racks that filled entire rooms. After the war, research in creating faster computers for military initiatives continued and the technology made its way into commercial businesses for financial accounting and other uses.
The following decades saw the introduction of modern software operating systems and programming languages (to make applications development easier and faster) and databases for rapid and simpler retrieval of data. Databases evolved from being hierarchical in nature to the more flexible relational model where data was stored in tables consisting of rows and columns. The tables were linked by foreign keys between common columns within them. The Structured Query Language (SQL) soon became the standard means of accessing the relational database.
Throughout the early 1970s, application development focused on processing and reporting on frequently updated data and came to be known as online transaction processing (OLTP). Software development was predicated on a need to capture and report on specific KPIs that the business or organization needed. Though transistors and integrated circuits greatly increased the capabilities of these systems and started to bring down the cost of computing, mainframes and software were still too expensive to do much experimentation.
All of that changed with the introduction of lower cost minicomputers and then personal computers during the late 1970s and early 1980s. Spreadsheets and relational databases enabled more flexible analysis of data in what initially were described as decision support systems. But as time went on and data became more distributed, there was a growing realization that inconsistent approaches to data gathering led to questionable analysis results and business conclusions. The time was right to define new approaches to information architecture.
The Data Warehouse
CHAPTER 1 ■ BIG DATA SOLUTIONS AND THE INTERNET OF THINGS
Figure 1-2 illustrates a very small portion of an imaginary third normal form model for an airline ticketing data warehouse. As shown, it could be used to analyze individual airline passenger transactions, airliner seats that are ticketed, flight segments, ticket fares sold, and promotions / frequent flyer awards.
Figure 1-2. Simple third normal form (3NF) schema
The EDW is loaded with data extracted from OLTP tables in the source systems. Transformations are used to gain consistency in data definitions when extracting data from a variety of sources and for implementation of data quality rules and standards. When data warehouses were first developed, the extraction, transformation, and load (ETL) processing between sources and targets was often performed on a weekly or monthly basis in batch mode. However, business demands for near real-time data analysis continued to push toward more frequent loading of the data warehouse. Today, data loading is often a continuous trickle feed, and any time delay in loading is usually due to the complexity of transformations the data must go through. Many organizations have discovered that the only way to reduce latency caused by data transformations is to place more stringent rules on how data is populated initially in the OLTP systems, thus ensuring quality and consistency at the sources and lessoning the need for transformations.
CHAPTER 1 ■ BIG DATA SOLUTIONS AND THE INTERNET OF THINGS
■
Note
If the EDW “build and they will come” approach sounds similar to approaches
being attempted in IT-led Hadoop and NoSQL database projects today, the authors believe
this is not a coincidence. As any architect knows, form should follow function. The reverse
notion, on the other hand, is not the proper way to design solutions. Unfortunately, we are
seeing history repeating itself in many of these Big Data projects, and the consequences
could be similarly dismal until the lessons of the past are relearned.
As debates were taking place about the usefulness of the EDW within lines of business at many companies and organizations, Ralph Kimball introduced an approach that appeared to enable business analysts to perform ad hoc queries in a more intuitive way. His star schema design featured a large fact table surrounded by dimension tables (sometimes called look-up tables) and containing hierarchies. This schema was popularly deployed in data marts, often defined as line of business subject-oriented data warehouses.
To illustrate its usefulness, we have a very simple airline data mart illustrated in Figure 1-3. We wish to determine the customers who took flights from the United States to Mexico in July 2014. As illustrated in this star schema, customer transactions are in held in the fact table. The originating and destination dimension tables contain geographic drill-down information (continent, country, state or province, city, and airport identifier). The time dimension enables drill down to specific time periods (year, month, week, day, hour of day).
Figure 1-3. Simple star schema
Not all relational databases were initially adept at providing optimal query
performance where a star schema was defined. These performance challenges led to the creation of multidimensional online analytics processing (MOLAP) engines especially designed to handle the hierarchies and star schema. MOLAP engines performed so well because these “cubes” consisted of pre-joined drill paths through the data. Figure 1-4
CHAPTER 1 ■ BIG DATA SOLUTIONS AND THE INTERNET OF THINGS
Later, as relational database optimizers matured, it became possible to achieve good query performance when deploying the star schema within the relational database management system. These became known as relational online analytical processing (ROLAP) implementations.
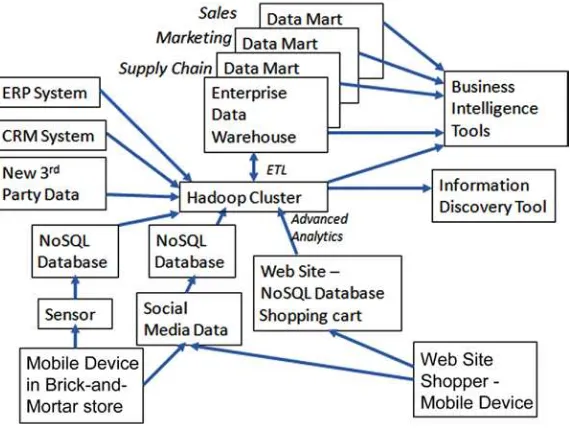
Independent vs. Dependent Data Marts
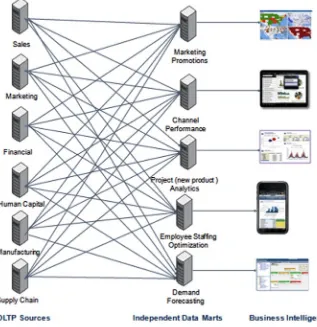
In the mid-1990s, there was much debate about the usefulness of the EDW when compared to data marts. When business analysts found the star schema was easier to navigate (and often deployed their own marts), some IT database programmers responded by creating views over the top of the data and schema in their EDW to overcome this objection. However, the programming and maintenance effort in building views was typically not timely enough to meet the growing demands of business analysts. Another problem often arose. When individual data marts are defined and deployed independently of each other and don’t follow data definition rules established within the EDW, inconsistent representation of the common data can call into question where the true data is housed. Figure 1-5 illustrates the complexity that can emerge when various lines of business build their own independent data marts and extract data directly from OLTP sources. In actual implementations, the complexity is sometimes greater than what is shown here as data might flow directly between data marts as well. Spreadsheets might also be added to this illustration serving as business intelligence tools tied to unique storage and representations of data. Organizations that deploy in this manner generally spend a great amount of time in business meetings arguing about who has the correct report representing the true state of the business, even if the reports are supposed to show the same KPIs.
CHAPTER 1 ■ BIG DATA SOLUTIONS AND THE INTERNET OF THINGS
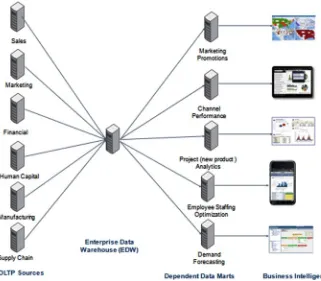
In the end, the debate should not have been about EDWs vs. data marts. There were solid reasons why both approaches had merit where the right architectural guidelines were applied. As many information and data warehouse architects began to realize this, a blended approach became the best practice. EDWs were implemented and extended incrementally as new sources of data were also required in the data marts. The data marts were made dependent upon the data definitions in the EDW. As the EDW remains the historic database of record, data fed into the marts is extracted from the EDW. The exception to using the EDW as the source of all data typically occurred when there was unique third-party data that was relevant to only a single line of business in an organization. Then that unique data was stored only in that line of business’s data mart.
Figure 1-6 illustrates data marts dependent on the EDW. This approach often leads
CHAPTER 1 ■ BIG DATA SOLUTIONS AND THE INTERNET OF THINGS
Database data management platforms you are most likely to encounter as data warehouses and / or data mart engines include the following: Oracle (Database
Enterprise Edition and Essbase), IBM (DB2 and Netezza), Microsoft SQL Server, Teradata, SAP HANA, and HP Vertica. ETL tools that are commonly deployed include Informatica, Oracle Data Integrator, IBM DataStage, and Ab Initio.
■
Note
When the EDW and data marts first became central and mandatory to running
the business, information architects began to understand the need for these platforms to
also be highly available, recoverable, and secure. As Hadoop clusters and NoSQL databases
are assuming similar levels of importance to lines of business today, the demand for similar
capabilities in these platforms is driving the creation of new features and capabilities
in these distributions. This is illustrated by the growing focus on improved availability,
recoverability, and security in the more recent software releases in the open source
community and being offered by the various vendors creating distributions.
CHAPTER 1 ■ BIG DATA SOLUTIONS AND THE INTERNET OF THINGS
An Incremental Approach
Early data warehousing design efforts sometimes suffered from “paralysis by over analysis” with a focus on elegant IT designs but not mapped to requirements from lines of business. Designs of early EDWs often took 12 months or more, well outside the bounds of business needs or the attention spans of business sponsors. Some early practitioners relied on a classic waterfall approach where the scope of the effort for the entire EDW was first determined, and then time and resources were allocated.
Figure 1-7 illustrates the waterfall approach. Lengthy project plans, delays, and lack of attention to the business often led to the lines of business taking matters into their own hands, developing and deploying independent data marts, or creating pseudo data marts in spreadsheets to solve their most immediate problems.
Figure 1-7. Waterfall approach
CHAPTER 1 ■ BIG DATA SOLUTIONS AND THE INTERNET OF THINGS
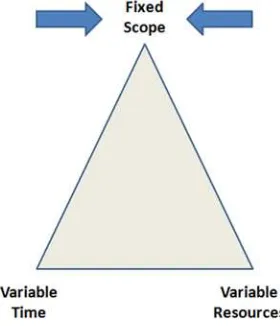
Though Figure 1-8 shows a variable scope, there should be some real business value demonstrated that is aligned to the business goals at each increment in the process. So, in practice, the methodology applied is often a blended balancing of the incremental and waterfall approaches.
Using this approach, the usefulness of the solution is re-evaluated at each step along the way. Defining and evaluating the EDW and dependent data marts in shorter time increments means that IT designs and development can be adjusted before they became too misaligned with business expectations. Return on investment can be calculated at regular intervals and reflect any changes in scope.
Some companies choose to embed business analysts within their IT organizations to drive ongoing identification of incremental requirements. Others create business intelligence centers of excellence as virtual organizations, periodically bringing together analysts in the lines of business with IT architects and developers. Ongoing communications and flexibility among the teams is critical to success regardless of the approach used.
■
Note
Successful Big Data projects that provide new business solutions are also usually
developed using an incremental approach. Ongoing dialog in the organization among the teams
regarding what is being discovered and the potential business impact is essential to success.
Faster Implementation Strategies
Early data warehouse implementations were based on entirely customized designs. Since data models had not matured and were not widely available, a significant amount of time was spent defining and designing the data models from scratch. Workload characteristics and workload changes over time were very unpredictable, making the
CHAPTER 1 ■ BIG DATA SOLUTIONS AND THE INTERNET OF THINGS
specification of servers and storage difficult. As lessons were learned and data warehouse designs matured, best practices became understood and solutions emerged that built upon these experiences.
One set of solutions to emerge were predefined data models based on common data analysis needs. The models became available for industries (such as retail,
communications, and banking) and provided horizontal analytic solutions (for example, financials, sales, marketing, and supply chain). Such models are available today from software vendors and consulting companies and feature definitions of logical designs and sometimes also include physical schema. They cover key business areas and contain the tables and other data elements needed to start the deployment of the data warehouse. Some are also packaged with ETL scripts useful in extracting data from popular ERP and CRM transaction processing sources and loading the data into the data models. Of course, most organizations customize the models based on their own unique business requirements. However, the models do provide the starting point for many data warehousing projects and are most successfully deployed when using the incremental approach.
As we noted earlier, configuring servers and storage for data warehousing workloads also presented challenges for information architects and server and storage architects. Given that data volumes grow at a much more rapid rate than the evolution of faster access times to physical disk drives, most found their platforms became throughput-bound if not enough attention is paid to the overall system design. In recent years, the notion of deploying appliance-like platforms configured for data warehousing and data marts has become quite common. There are several such offerings available from relational database vendors who also provide servers and storage. The availability of flash in storage further helped speed performance where the database software was optimized to take advantage of the flash. More recently, the dramatic reduction in the cost of memory, introduction of new processors capable of addressing huge memory footprints, and further refinement in the database’s ability to store and retrieve frequently accessed data in-memory led to huge query response and analysis performance improvements. All of these have served to mitigate many of the complex database tuning and design tasks previously necessary.
That said, as certain server and storage bottlenecks such as throughput are overcome, others will naturally arise since there is always a physical limitation somewhere in a system. Business analysts will continue to demand new analytic applications that take advantage of new platform capabilities and push the bounds of the technology.
CHAPTER 1 ■ BIG DATA SOLUTIONS AND THE INTERNET OF THINGS
Matching Business Intelligence Tools to Analysts
How data is accessed and utilized is driven by the needs and skills of the individuals in the lines of business. For those who need to see the data to make decisions, the tools they might use can range from simple reporting tools to extremely sophisticated data mining tools. Modern infrastructures sometimes also include engines for automated recommendations and actions, as well as information discovery tools.
Figure 1-9 illustrates the range of tools and techniques and their relative user community sizes and relative complexity.
Figure 1-9. Potential business analyst and user community size for various analyst tools
The simplest way to convey information to business analysts is through pre-defined reports that display KPIs selected by developers of the reports. Reports have limited flexibility in the information that can be viewed, but they also assure that a wide variety of business users can become consumers of the information because of the simplicity in accessing them. The reporting tools the developers use generate SQL for accessing needed data. Report developers often judge the quality of reporting tools by the clarity with which they present the KPIs and the ease and flexibility in which reports can be generated, shared, and distributed. For example, a variety of template types are often supported for printing such as PDF, RTF, and XSL.
CHAPTER 1 ■ BIG DATA SOLUTIONS AND THE INTERNET OF THINGS
Typical ad hoc query, analysis, and reporting tools you are likely to see being used today include Oracle Business Intelligence Foundation Suite, SAP Business Objects, IBM Cognos, MicroStrategy, Tableau, QlikView, Pentaho, and Tibco Jaspersoft. Of course, many would say that Microsoft Excel is the most popular tool for this type of work in their organization. In most organizations, a variety of vendors’ tools are used.
A smaller but growing subset of business analysts deal with massive amounts of data and seek to uncover hidden patterns and / or predict future outcomes using their data. The kinds of analyses range from the simple statistics that you probably learned in college (for example, mean, standard deviation, and so on) to models based on more sophisticated data mining algorithms.
The statistical functions that business analysts work with to bring clarity to the data usually fit in the following categories:
• Basic statistical functions such as summary, sort, rank,
and frequency
• Density, probability, and quantile functions
• Special functions such as gamma functions
• Test functions such as chi square, simple and weighted kappas,
and correlation
Advanced data mining algorithms are used when there is a need to understand what variables are critical in accurately predicting outcomes and in defining the predictive models that will subsequently be used to predict the outcomes. The models are often applied where there are hundreds of variables present but only a dozen or fewer that impact the outcome. The data mining algorithms can be categorized as follows:
CHAPTER 1 ■ BIG DATA SOLUTIONS AND THE INTERNET OF THINGS
• Neural networks: Somewhat black box mathematical models
trained against sample sets with known outcomes.
• Anomaly detection algorithms: Used to detect outliers and
rare events.
The vendors you are likely to find installed in your current architecture providing statistical and data mining capabilities include the SAS Institute, IBM SPSS, R (an open source statistical engine), and Oracle Advanced Analytics.
Historically, statisticians and data miners were also domain experts and were sometimes referred to as “quants.” With the growing popularity of Hadoop, the new role of data scientist has emerged. Early data scientists were especially adept at using advanced programming techniques that took advantage of Hadoop’s features.
■
Note
There is much debate today about the skills and definition of the data scientist
role. Some still believe the data scientist is a combination of a statistician and Hadoop
programming guru. However, many hired with those skills have shown that they lack the
domain expertise needed to understand what to look for in the data and the potential impact
on the business. In many organizations today, data scientists are paired with business
domain experts, and they work as a team to assure success.
Early in this century, it was recognized that there was a growing need to explore massive data sets that might include structured, semi-structured, and streaming data. The information discovery tools that were introduced enable exploration of data where a schema is not pre-defined. The tools generally either have their own proprietary data store engines, such as Oracle Endeca Information Discovery, or rely on Hadoop to enable exploration of data sets and combinations of data. The data analyzed is typically gathered from OLTP sources, EDWs, NoSQL databases, and Hadoop. Tibco Spotfire, Oracle Big Data Discovery, and some of the business intelligence tools we previously mentioned in this chapter can directly access Hadoop and are used for information discovery.
Finally, for certain problems, action must be taken in real time. Examples might include recommending products that could be of interest during a web site shopping visit or equipment that should be checked out for maintenance because its failure is predicted in the near future.
Web site activity data is typically analyzed using predictive analytics models. The models’ results are periodically provided as updates (using batch feeds) to a real-time recommendation engine. The engine then recommends that the web site serve up specific web pages or notifications as guided by the models. As more analyses are made, the recommendations are fine-tuned and become more accurate. Often, reporting tools are used to monitor the results of these automated actions.
CHAPTER 1 ■ BIG DATA SOLUTIONS AND THE INTERNET OF THINGS
These are often deployed in Internet of Things solutions in order to trigger an immediate action based on what sensors are detecting.
Later in this book, we will describe how to uncover the need for these various tools and solutions and then subsequently describe technical considerations as they become part of the information architecture design.
Evolving Data Management Strategies
As business workload demands changed and drove new technical requirements, relational databases evolved and introduced new capabilities intended to address those requirements. However, some found that a technology based on a concept of data’s fitting neatly in rows and columns introduced too much overhead or was misaligned with the problems that needed to be solved. It is largely for those reasons that NoSQL databases and Hadoop engines began to appear around the turn of this century.
Coincidentally, they appeared at a time when the “open source” movement was gaining momentum and, in turn, helped to fuel that momentum. In the open source model, vendors and individuals have access to source code and these “committers” submit updates and utilities they are willing to share. Source code for NoSQL databases can be licensed from the Apache Software Foundation and GNU. Hadoop licenses can be obtained from Apache. As new features are incorporated into new releases of the open source code, the software vendors then determine what to include in their own distributions. Though the distributions can be downloaded for free, the vendors believe they can ultimately become profitable and successful companies by generating revenue through subscriptions (including support) and by offering services for a fee.
NoSQL Databases
The NoSQL database terminology dates to the late 1990s and was intended to describe a broad class of non-relational database engines designed to handle rapid updates and ingest the largest quantities of data while providing horizontal scalability. Such update and ingestion workloads had become a challenge for certain online applications (such as shopping carts on web sites) where fast update performance was critical despite a huge number of users of the application.
CHAPTER 1 ■ BIG DATA SOLUTIONS AND THE INTERNET OF THINGS
A variety of NoSQL database types have emerged. These include the following:
• Key Value Pairs: Databases that consist of keys and a value or set
of values and that are often used for very lightweight transactions and where the number of values tied to a key grows over time.
• Column-based: Databases that are collections of one or more
key value pairs, sometimes described as two-dimensional arrays, and are used to represent records so that queries of the data can return entire records.
• Document-based: Similar to column-based NoSQL databases,
these databases are designed for document storage and feature deep nesting capabilities, enabling complex structures to be built such that documents can be stored within documents.
• Graph-based: Databases that use treelike structures with nodes
and edges connected via relations.
Horizontal scalability of NoSQL databases is enabled using a technique called
sharding. Sharding is simply the spreading of data across multiple independent servers or nodes in a cluster. Performance is dependent upon the power of the nodes but also upon how well the spreading of the data provides a distribution that also matches the performance capabilities of the individual servers. For example, if all of the most recent data is put on a single node and most of the activity is related to recent data, the application will not scale well. Many NoSQL database vendors have focused on automating the sharding process to provide better load balancing and make it easier to add or remove capacity in the cluster.
Though not as robust as relational databases in supporting high availability failover scenarios, NoSQL databases do enable replication of data to provide database availability in case of server or node failure. Copies of data are typically replicated across nodes that are different from the nodes where the primary data resides.
There are dozens of NoSQL database engines of the various types we have described. Some that you are more likely to encounter include Apache Cassandra, MongoDB, Amazon DynamoDB, Oracle NoSQL Database, IBM Cloudant, Couchbase, and
MarkLogic. As the feature list for these databases can rapidly change, understanding the capabilities that are provided by the version being considered for deployment is very important. As an example, some added in-memory capabilities in only their more recent versions.
Hadoop’s Evolution
CHAPTER 1 ■ BIG DATA SOLUTIONS AND THE INTERNET OF THINGS
important papers describing the Google File System (GFS) and MapReduce. The notion of a distributed file system was not new at the time, but Google’s papers laid out a vision of how to solve the search problem.
Figure 1-11. Typical web log data stream
Cutting understood the importance of the Google papers and made modifications to his own effort. MapReduce was able to map the data streams and reduce the data in the streams to data of value. GFS provided clues on how to scale the engine and such scalability was seen as particularly critical given the number of deployed web sites was exploding. In 2006, Cutting joined Yahoo! and renamed his storage and processing effort after the name of his son’s toy elephant. Hadoop was born. That same year, Hadoop became an Apache Software Foundation project.
A distributed file system enables highly parallel workloads to occur across massive amounts of storage. MapReduce is co-located with the data providing the scalability needed. When this combination was discussed by early proponents, it was often described as solving a Big Data problem where data had huge volume, variety, and velocity. Over time, the Big Data terminology has taken on much broader meaning as vendors have positioned many different solutions to address many different though similar problems.
CHAPTER 1 ■ BIG DATA SOLUTIONS AND THE INTERNET OF THINGS
■
Note
Newer data management solutions described in this book were invented to
provide optimized solutions by addressing specific emerging workload needs. However,
the perception about many of these data stores, promoted as open source, is that they are
cheaper. This can lead to the application of these software distributions outside of their
technical sweet spots in order to reduce cost of acquisition and support. As developers
complain about the limited functionality compared to other engines that were seen as more
costly, vendors that create the software distributions often add new features and capabilities
in response. The unanswered question is whether many of the resource utilization and
performance benefits of these distributions will disappear as they overlap more with other
legacy data management solutions and with each other.
Hadoop Features and Tools
The Apache Software Foundation provides incubators for Hadoop features and tools and classifies these as development projects. As new releases occur, the results of these projects make their way, in varying degrees, into Hadoop distributions from vendors that include Cloudera, Hortonworks, IBM, MapR, and Pivotal. Apache Hadoop project status updates are posted on the apache.org web site.
If you are new to Hadoop, some definitions of key projects that the distributors and developers often talk about as Hadoop technologies and features could be useful. Some of the core data management features include the following:
• HDFS: The Hadoop Distributed File System.
• Parquet: A compressed columnar storage format for Hadoop.
• Sentry: A system that enables fine-grained, role-based
authorization to data and metadata stored in Hadoop.
• Spark: An engine that enables Hadoop in-memory data
processing.
• YARN: A framework used in scheduling and managing jobs and
cluster resources.
• Zookeeper: A coordination service for distributed applications.
Important features for data transfer and collection in Hadoop include the following:
• Flume: A service for collecting and aggregating streaming data
including log and event data in HDFS.
• Kafka: A publish-and-subscribe message broker platform
designed to handle real-time data feeds.
• Sqoop: A tool used to transfer data between Hadoop and
CHAPTER 1 ■ BIG DATA SOLUTIONS AND THE INTERNET OF THINGS
Programming tools, application programming interfaces (APIs), and utilities in Hadoop include the following:
• Hive: A SQL-like construct (HiveQL) for querying data in Hadoop.
• MapReduce: An early Hadoop programming paradigm that
performs a “map” (filtering and sorting) and then a “reduce” (summary operation) for data that is distributed across nodes.
• Oozie: A workflow job scheduler used in managing Hadoop jobs.
• Pig: A data-flow language and parallel execution framework for
data processing.
• Spark GraphX: An API that enables viewing of data as graphs
and collections, transformations, and joins of graphs to resilient distributed data sets (RDDs), and creation of custom graph algorithms in Spark.
• Spark MLib: A machine learning library implemented in Spark.
• Spark SQL: An API that enables querying of RDDs in Spark in a
structured (Hive) context.
• Spark Streaming: An API that enables creation of streaming
processes in Spark.
• Solr: A full text indexing and search platform.
Creators of Hadoop-based applications sometimes seek the capabilities provided by a NoSQL database as part of their designs. HBase provides a NoSQL columnar database that is deployed on HDFS and enables random reads and writes. It is especially useful in handling sparsity of data problems. In addition to supporting ad hoc queries, HBase often is used for providing data summaries.
Layout of a Hadoop cluster on the underlying servers and storage requires the designation of name nodes, data nodes, and nodes that will provide the services enabling the features that we previously mentioned. Proper deployment of services across the cluster eliminates critical single points of failure that could bring the entire Hadoop cluster down. Data is normally triple replicated to assure that it is available in the event of node failures.
CHAPTER 1 ■ BIG DATA SOLUTIONS AND THE INTERNET OF THINGS
The Internet of Things
Within this decade, the growing popularity of reporting on and analyzing data gathered from sensors and control devices became clear. Speculation about the value of such solutions and early testing of this idea began as early as the 1980s with experimental vending machines connected to the Internet. Early this century, there was much speculation about machine-to-machine (M2M) communications and the value such capabilities could provide. There were even jokes about how your kitchen appliances might be plotting against you. However, it soon became clear that the solution footprint would involve more than just the devices themselves, and so the Internet of Things
terminology was added to our vocabulary.
Prior to the invention of this catch phrase, many manufacturers of devices had already added the capability to gather data from their devices by outfitting them with intelligent sensors and controllers. Some included early versions of simple data gathering software. However, the price, size, and limited functionality of early sensors and controllers sometimes also limited the usefulness of the data that could be gathered. Further, the potential business usage of such data was not widely understood, and the software needed to analyze it was not optimal. So, when the data was gathered at the source, often it was not transmitted or analyzed. The data was simply thrown away.
Since design of manufactured products requires lengthy lead times and the products can have significant lifetimes once they are produced, engineers continued to add sensors and the capability to gather intelligence to the products they were designing. They foresaw a day when the data could be useful in multiple ways. Many understood
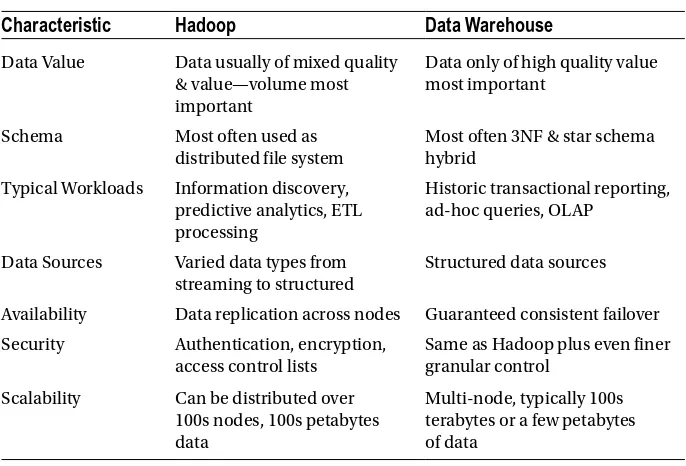
Table 1-1. Summary of Some Differences When Deploying Hadoop vs. Data Warehouse (Relational Database)
Characteristic
Hadoop
Data Warehouse
Data Value Data usually of mixed quality & value—volume most important
Data only of high quality value most important
Schema Most often used as
distributed file system
Most often 3NF & star schema hybrid
Typical Workloads Information discovery, predictive analytics, ETL processing
Historic transactional reporting, ad-hoc queries, OLAP
Data Sources Varied data types from streaming to structured
Structured data sources
Availability Data replication across nodes Guaranteed consistent failover
Security Authentication, encryption,
access control lists
Same as Hadoop plus even finer granular control
Scalability Can be distributed over 100s nodes, 100s petabytes data
CHAPTER 1 ■ BIG DATA SOLUTIONS AND THE INTERNET OF THINGS
that such data could be utilized to better understand product quality and the potential failure of components, enable automated requests for service, provide information on environmental factors, aid in better energy management, and provide data for hundreds of other potential applications.
■
Note
Technology zealots sometimes ask us to describe the “killer user cases” for
Big Data (and specifically Hadoop) in the industry that they work in. Where sensors and
intelligent controllers increasingly provide data that is critical to running the business, the
use case they are seeking can become readily apparent. Their Big Data use case could be
driven by the need to analyze data from the Internet of Things.
The growing demand for sensors led to more research that led to further sensor miniaturization and significant reductions in price. Miniaturization was partly enabled by a huge reduction in energy needed to power the sensors. As a result, billions of sensors are deployed today, and this number is expected to soon grow to hundreds of billions deployed by the end of the decade. That growing volume at a lower cost will continue to drive further innovation and momentum for their use.
Fortunately, a second breakthrough was occurring as sensors and intelligent controllers proliferated. This breakthrough was in the capability of newer types of data management software to ingest and analyze huge volumes of streaming data. Though NoSQL databases and Hadoop initially were most often deployed to process and analyze web site traffic and social media data, it turned out that these engines are also ideal for the capture and analysis of data streams coming from sensors and controllers.
CHAPTER 1 ■ BIG DATA SOLUTIONS AND THE INTERNET OF THINGS
Various strategies have emerged in organizations that want to analyze data from the Internet of Things. Some design and develop the entire pictured footprint. Others design and deploy the smart sensor code (usually programming it in Java), manage it, and then focus on gathering and analyzing the data while partnering with communications infrastructure providers to enable and secure transmissions. Still others only focus only on analyzing the data, relying on others to provide communications and build out intelligence in the sensors.
Our description of extending the information architecture to include NoSQL databases and Hadoop clusters will be relevant to all three of these scenarios. But we will also later describe in this book some of the additional components unique to the Internet of Things and additional decisions you might have when considering communications, security, and provisioning of intelligent sensors.
The Methodology in This Book
The remainder of this book describes a methodology for developing and deploying projects. The authors observed this methodology as commonly used when previous generation projects succeeded. It is now being applied and extended to Big Data and Internet of Things efforts.
The methodology we describe is not revolutionary. It is built upon accepted best practices that most enterprise architects are familiar with. We realize that the audience for this book is much wider than those with an architecture background, so we’ll next describe the popular The Open Group Architectural Framework (TOGAF) model from The Open Group and how we can apply it to our methodology. Especially important when applying any methodology in the creation of the next generation information architecture is to use the incremental approach we earlier described in this chapter.
CHAPTER 1 ■ BIG DATA SOLUTIONS AND THE INTERNET OF THINGS
TOGAF and Architectural Principles
The Open Group is a worldwide organization offering standards and certification programs for enterprise architecture. First established in 1995, TOGAF has been widely adopted and provides the basis for architectural design methodologies present in many of its member organizations. At the time of publication, there were over 350 organizations taking part as members. Many take part in The Open Group boards, councils, member forums, work groups, or technical work groups that define best practices and standards.
TOGAF itself describes four types of architecture. All are applicable to defining the information architecture we describe in this book. The four types are as follows:
• Business architecture comprised of business strategy, governance,
organization, and key business processes
• Data architecture consisting of logical and physical data asset
structures and data management resources
• Application architecture describing how applications are
deployed, how they interact with each other, and how they relate to business processes defined by the business architecture
• Technology architecture describing the logical software, server,
storage, networking, and communications capabilities required
Business architecture is often the most overlooked of the four when IT specialists and architects define and develop the information architecture, but it is extremely important to achieving overall success in these projects. We spend some time in this book describing the uncovering of a company’s or organization’s business strategy and their processes that are critical to running the business. The organization of the business clearly can drive various aspects of the technical information architecture, such as where data marts might be required to meet the needs of specific lines of business. The topic of data governance is top of mind in both business and IT, and the topic appears in many chapters.
At the heart of information architecture is the data architecture and technology architecture. You will see us focus on these areas in chapters that discuss gathering IT requirements and the future state design in particular. The application architecture described by TOGAF defines the business solutions in our information architecture and the relationship these solutions have to each other when built upon the underlying data and technology architecture components.
You or your architecture team might be most familiar with TOGAF in the context of the standard that it provides. The TOGAF standard consists of the following parts:
• An introduction to key concepts in enterprise architecture
and TOGAF
• An architecture development method (ADM) that describes a
CHAPTER 1 ■ BIG DATA SOLUTIONS AND THE INTERNET OF THINGS
• An enterprise continuum that provides a model for classifying
artifacts and showing how they can be reused and modified over time
• TOGAF reference models including a technical reference model
(TRM) and integrated information infrastructure model (III-RM)
• An architecture capability framework providing guidelines,
templates, and resources useful when establishing the architecture practice in an organization or company
It is no coincidence that the scope of TOGAF maps extremely well to the information architecture methodology we describe in this book since the methodology is based upon lessons learned using standard architectural techniques derived from TOGAF. If you seek more details on TOGAF than we cover here, we strongly recommend you explore The Open Group’s web site at www.opengroup.org/TOGAF. Becoming a member can introduce you to a wealth of information and, if you are an architect, provide you with opportunities to become a contributing member of a community providing architecture thought leadership.
■
Note
The IT audience for this book might also wonder about the applicability of ITIL
(formerly known as the Information Technology Infrastructure Library) when it comes to
defining an information architecture. ITIL is closely linked to ISO/IEC 20000, an international
standard for IT service management, and defines a framework and certification process.
More recently, ongoing development of ITIL came under the direction of AXELOS
(
www.axelos.com), a company co-created by the UK Cabinet Office and Capita PLC. The
five major service areas that ITIL addresses are service strategy, service design, service
transition, service operation, and continual service improvement. The level of IT services
provided must align with the business needs of your organization and these in turn should
guide you when defining the future state technical architecture that is described later in this
book. So, ITIL is complementary to TOGAF as it can be used to help you define how you will
operationalize the architected future state.
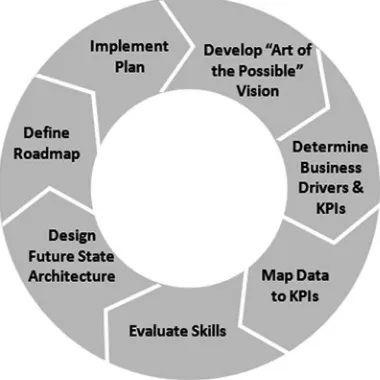
Our Methodology for Success
The methodology we focus on in the subsequent chapters of this book consists of seven phases ranging from an early conceptual vision through project implementation. Each phase is represented by its own chapter in this book.
CHAPTER 1 ■ BIG DATA SOLUTIONS AND THE INTERNET OF THINGS
the previous phases, we can then design in much more detail the future state information architecture. We next define and agree upon a roadmap describing the implementation sequence of our future state architecture. Then we are ready to begin implementation.
Figure 1-13. Phases in our methodology for success
Figure 1-13 illustrates this process. It is shown as a continuous circle to indicate that it does not end with implementation. Let’s take a quick look at what happens in each of these phases.
■
Note
In practice, the phases of the methodology sometimes overlap. For example,
you might discover while working on a phase that critical information you need is missing
and that the information should have been gathered in a previous phase. Of course, when
that occurs, you must go back and gather the missing information in order to proceed with
the current phase.
CHAPTER 1 ■ BIG DATA SOLUTIONS AND THE INTERNET OF THINGS
The next phase of the methodology takes a much deeper look at the business drivers. Line of business sponsors and business analysts provide more insight into what is required to run the business today and also address the new challenges they are facing. During this phase, we must gain an understanding of their critical success factors, the key performance indicators that the business analysts need, and the measures that must be gathered. All of these will drive the technical architecture design that follows. We also begin to understand the potential business benefits that will accrue by having access to this data and begin to prioritize different phases of the project based on their business value and opportunity for success.
Once we understand what data our business analysts need, we must figure out where we should get the data. Line of business sponsors and business analysts will help us here as well. They can describe the quality of the data needed, the sources that they trust, and data governance requirements. Furthermore, they can help us understand how the data will be analyzed, the granularity needed, how long it must be retained, and what form it should be delivered in (for example, as reports or in ad hoc query tools or through data exploration and visualization tools). They can also describe the infrastructure availability requirements that should be driven by the need for timely decisions to be made using the data and the potential impact on the business.
At this point, we should now understand the data and analysis requirements. We are ready to design our future state technical architecture and the IT architecture team will engage extensively in this phase. However, before a more detailed design is started, we might want to first understand the skills we have in our organization and the impact those skills (or lack of ) might have in the architecture. We’ll also want to clearly understand the good and bad things about our current state architecture and how we might extend it through the introduction of new software components and systems. Some initial notion as to the scale of costs needed to redefine our footprint should become apparent at this time.
A bill of materials for new hardware and software is useful, but to truly understand when we’ll reach a positive return on investment, we must also begin to understand the potential implementation costs for the various phases envisioned. Implementation costs generally dwarf software and other infrastructure considerations. Based on skills gaps identified, we should begin to assess the cost of services from systems integrators to fill those gaps. Other factors such as scope of effort and risk of implementation are also evaluated.
Once we have this information, we can develop a high-level roadmap to
implementation backed by a reasonable and understandable business case. Our target audience for the roadmap includes executives and sponsors who will fund the project. If we’ve done our job right throughout the process, there should be few surprises at this phase of the effort. Part of the presentation could be a mock-up demonstration of the business capabilities that will be delivered. Much of the dialogue should be about priorities and whether the project phases are in the right order. Executives and sponsors might also ask for more details regarding costs, and likely those will be directed at the cost of implementation. But with a solid business case, a go-ahead to proceed with the project is likely.
CHAPTER 1 ■ BIG DATA SOLUTIONS AND THE INTERNET OF THINGS
during the implementation. All of this must be accomplished without falling victim to scope creep. In addition to demonstrating progress in solution delivery, tracking of costs of implementation and reporting on those at regular intervals also demonstrates accountability.
As the project reaches its initial completion and you deliver on the agreed upon blueprint, it is important to claim success. However, it is likely that the lines of business and IT will have already started to develop a revised vision of what comes next. These projects always evolve as the business needs change and as business analysts become more advanced in their understanding of what is possible. And so the cycle repeats itself again and again.
CHAPTER 2
Evaluating the Art of the
Possible
Fear of being left behind can be powerful motivation. Today, many organizations embark on building Big Data and Internet of Things prototypes simply because they fear that their competitors are gaining a head start. Being first to market with differentiated solutions is a common goal among startup companies in order to attract funding from venture capitalists. While many startups fail, some have succeeded spectacularly and established a presence in new markets that, in turn, threatened the established companies in those markets. The significant advantage gained by being early to market with innovative solutions has not been forgotten by CEOs and senior business leaders at mature companies facing new competition.
Many of these same organizations also began to focus on managing their business by fact rather than by the intuition that drove their past decisions. Data became king and the information gleaned from it was deemed essential. The ability to look back in time and accurately assess what happened became a given. Using data to also predict the future became increasingly important when evaluating options and the potential impact of new decisions.
On the face of it, Big Data should help organizations respond to both of these needs. After all, more data variety and more data volume should help uncover new truths, or so many business executives would like to believe. And the Internet of Things seems to open up new business possibilities not only for strategies that can be used against traditional competitors but also for development of new strategies that can be applied in adjacent markets.
CHAPTER 2 ■ EVALUATING THE ART OF THE POSSIBLE
In order to develop such hypotheses, a visioning session could be in order in your company or organization. Certainly, IT executives, enterprise architects, and IT architects will have a view on where IT is headed and also have some awareness of the potential impact of Big Data and the Internet of Things. However, the use cases being sought will most likely be in the minds of business leaders. Coincidentally, they might also have funding for the budget needed to pay for such projects. Individuals that have described their needs for such projects in planning sessions that we have facilitated include chiefs of marketing, heads of risk management, and vice presidents of engineering (just to name a few).
In this chapter, we describe how to discover what could be in your future information architecture and drive future projects by evaluating “the art of the possible.” You
might find many potential projects when this session occurs in your organization. But the techniques outlined in this chapter will also help you to develop a realistic early assessment as to how viable the desired projects are. As a result, you will be able to focus on the projects that really do have the right level of support and can make a difference to the business.
Figure 2-1 highlights the stage we are at in our methodology and what we are covering in this chapter. The discussion in the visioning session includes an evaluation of the current and future business architecture, data architecture, application architecture, and technology architecture. Since this is just the start of our discovery process, there will be many follow-up stages once we have established a vision and are convinced there might be a project worth pursuing.
CHAPTER 2 ■ EVALUATING THE ART OF THE POSSIBLE
Understanding the Current State
Before laying out a vision of where we might be going, it is important to understand where we are. There are always both business and technical views of the current state. From a business perspective, we need to understand if our business executives and analysts are satisfied with the information and data they have. This often leads to a discussion about how and why they use data, the data granularity, the breadth of history that is accessible, and the quality of the data. Missing sources of data and data history are discussed as well as the impact that adding this data will have on volume requirements in the future. The desire for timely data and what is acceptable timeliness is also discussed.
From an IT perspective, we need to understand current key data sources, how and where the data is moved, the data management systems that are utilized, and the business analyst tools currently used or lacking. In addition to the software, we should understand the capabilities and age of server and storage components in the current state architecture. We should also understand if service level agreements to the business are being met and how flexible and agile the technical infrastructure is when the business must respond to changing conditions.
Information Architecture Maturity Self-Assessment
An early self-assessment of the maturity of the current information architecture can yield insight as to the ability of an organization to extend its current architecture. If an organization is struggling with a basic data warehouse implementation, there should be little expectation that taking on a Big Data project will magically fix all of the problems. In fact, such a project could get in the way of solving higher priority problems that the lines of business would prefer be solved sooner.
There are a variety of maturity rating scales for information architecture found in publications. We have found that organizations generally follow a path that can include starting with silos of information and data, then standardization of information and data, application of advanced business optimization techniques, and providing information as a service. Figure 2-2 illustrates this path.
CHAPTER 2 ■ EVALUATING THE ART OF THE POSSIBLE
Following are definitions of what happens in each of these stages:
• Silos of information and data: Data is duplicated inconsistently
across many independent data marts and tools, primarily managed in the lines of business, and there are frequent debates about which data set is the true data set. As a result, the interpretation of any results coming from data analysis is often viewed with skepticism.
• Standardization of information and data: Centrally managed
dependent data marts and enterprise data warehouse are used for reporting and ad hoc queries, with attention paid to data quality, consistency, and security. IT and the lines of business collaborate on data mart extensions and rollout of new marts.
• Advanced business optimization: Streaming data is introduced
augmenting traditional data sources. Predictive analytics is used to better understand and predict outcomes of decisions.
• Information as a service: The internally developed trusted data
stores and analysis tools have value outside of the company or organization. Access is provided to favored partners as a benefit of doing business. Subscribers are willing to pay for the service and can be provided access.
These stages are not always pursued in a sequential manner. Organizations may be traversing several of these initiatives at the same time. For example, organizations often gyrate between data silos and standardization, especially where IT doesn’t move fast enough to meet changing analysis needs from the lines of business. Predictive analytics and the addition of streaming data are sometimes explored and implemented while this gyration is occurring.
Of course, organizations that successfully traverse these first three stages will have created something of incredible business value. At that point, some consider setting up subscription offerings and might go into competition with data aggregators in their industry as they begin to provide information as a service.
As you evaluate the maturity of your organization, it is important to realize that as you move from silos to information as a service, the role and skills that IT must bring to the organization become more advanced. Part of the consideration in taking on a new project should be whether you are introducing a significantly different skill set to your organization and whether the investment needed in gaining these skills should be spent here or on other less demanding but possibly equally business lucrative tasks.
Current Business State of the Industry
CHAPTER 2 ■ EVALUATING THE ART OF THE POSSIBLE
The most impactful information architecture projects are always linked to solving specific business problems. The following is a sample list by industry of typical data warehousing projects and projects where the information architecture is extended to include Hadoop and / or the Internet of Things. This list may give you a few ideas of areas to explore for new projects that could yield significant return on investment when aligned to business goals in your organization:
• Agriculture:
• Data warehousing: Cost of farm production and
optimization, yield analysis, agricultural goods commodity pricing / trading analysis.
• Hadoop / Internet of Things: Analysis and optimization of
plowing patterns, fertilization, readiness for harvesting, and moisture content (from sensors in the field and weather data).
• Automotive Manufacturing:
• Data warehousing: Cost and quality of manufacturing,
supply chain analysis, warranty analysis, sales and marketing analysis, human capital management.
• Hadoop / Internet of Things: Analysis of customer sentiment
and analysis of connected vehicles including component failure, need for service and service scheduling, driving history (and automated car), driver emergency detection and response.
• Banking:
• Data warehousing: Single view of customer across financial
offering channels, financial analysis, fraud detection, credit worthiness, human resource management, real estate management and optimization.
• Hadoop / Internet of Things: Fraud detection, risk analysis,
and customer sentiment.
• Communications:
• Data warehousing: Pricing strategies and finances, customer
support and service, marketing analysis, supply chain, logistics and process optimization, regulatory compliance, real estate optimization, and human capital management.
• Hadoop / Internet of Things: Analysis of social data, mobile
CHAPTER 2 ■ EVALUATING THE ART OF THE POSSIBLE
• Consumer Packaged Goods:
• Data warehousing: Analysis of sales, marketing, suppliers,
manufacturing, logistics, consumer trends, and risk.
• Hadoop / Internet of Things: Analysis of promotional
effectiveness (through social media and in-store sensors), supply chain, state of manufactured goods during transport, product placement in retail, and risk.
• Education and Research:
• Data warehousing: Financial analysis of institution or facility,
staffing and human capital management, and alumni profiling and donation patterns.
• Hadoop / Internet of Things: Analysis of students at risk
(using sensor data), research data from sensors, and facilities monitoring and utilization optimization.
• Healthcare Payers:
• Data warehousing: Analysis of cost of care, quality of care,
risk, and fraud.
• Hadoop / Internet of Things: Analysis of sentiment of insured
customers, risk, and fraud.
• Healthcare Providers:
• Data warehousing: Analysis of cost of care, quality of care
analysis, staffing and human resources, and risk.
• Hadoop / Internet of Things: Disease and epidemic pattern
research, patient monitoring, facilities monitoring and optimization, patient sentiment analysis, and risk analysis.
• High Tech and Industrial Manufacturing:
• Data warehousing: Supplier and distributor analysis, logistics
management, quality of manufacturing and warranty analysis.
• Hadoop / Internet of Things: Shop-floor production and
quality analysis, quality of sub-assembly analysis, product failure and pending failure analysis, and automated service requests.
• Insurance (Property and Casualty):
• Data warehousing: Sales and marketing analysis, human
CHAPTER 2 ■ EVALUATING THE ART OF THE POSSIBLE
• Law Enforcement:
• Data warehousing: Logistics optimization, crime statistics
analysis, and human resources optimization.
• Hadoop / Internet of Things: Threat analysis (from social
media and video capture identification).
• Media and Entertainment:
• Data warehousing: Analysis of viewer preferences, media
channel popularity, advertising sales, and marketing promotions.
• Hadoop / Internet of Things: Viewing habit analysis (from
set-top boxes), analysis of customer behavior at entertainment venues, and customer sentiment analysis.
• Oil and Gas:
• Data warehousing: Analysis of drilling exploration costs,
potential exploration sites, production, human resources, and logistics optimization
• Hadoop / Internet of Things: Drilling exploration sensor
analysis (failure prevention)
• Pharmaceuticals:
• Data warehousing: Clinical trials including drug interaction
research, test subject outcome analysis, research and production financial analysis, sales and marketing analysis, and human resources analysis.
• Hadoop / Internet of Things: Analysis of clinical research
data from sensors, social behavior and disease tracking (from social media), and genomics research.
• Retail:
• Data warehousing: Market basket analysis, sales analysis,
supply chain optimization, real estate optimization, and logistics and distribution optimization.
• Hadoop / Internet of Things: Omni-channel analysis and