Big Data
Bill Schmarzo
Understanding How
Data Powers Big
Big Data: Understanding How Data Powers Big Business Published by
John Wiley & Sons, Inc. 10475 Crosspoint Boulevard Indianapolis, IN 46256 www.wiley.com
Copyright © 2013 by John Wiley & Sons, Inc., Indianapolis, Indiana Published simultaneously in Canada
ISBN: 978-1-118-73957-0 ISBN: 978-1-118-74003-3 (ebk) ISBN: 978-1-118-74000-2 (ebk)
Manufactured in the United States of America 10 9 8 7 6 5 4 3 2 1
No part of this publication may be reproduced, stored in a retrieval system or transmitted in any form or by any means, electronic, mechanical, photocopying, recording, scanning or otherwise, except as permit-ted under Sections 107 or 108 of the 1976 Unipermit-ted States Copyright Act, without either the prior written permission of the Publisher, or authorization through payment of the appropriate per-copy fee to the Copyright Clearance Center, 222 Rosewood Drive, Danvers, MA 01923, (978) 750-8400, fax (978) 646-8600. Requests to the Publisher for permission should be addressed to the Permissions Department, John Wiley & Sons, Inc., 111 River Street, Hoboken, NJ 07030, (201) 748-6011, fax (201) 748-6008, or online at http://www.wiley.com/go/permissions.
Limit of Liability/Disclaimer of Warranty: The publisher and the author make no representations or warranties with respect to the accuracy or completeness of the contents of this work and specifi cally disclaim all warranties, including without limitation warranties of fi tness for a particular purpose. No warranty may be created or extended by sales or promotional materials. The advice and strategies con-tained herein may not be suitable for every situation. This work is sold with the understanding that the publisher is not engaged in rendering legal, accounting, or other professional services. If professional assistance is required, the services of a competent professional person should be sought. Neither the publisher nor the author shall be liable for damages arising herefrom. The fact that an organization or Web site is referred to in this work as a citation and/or a potential source of further information does not mean that the author or the publisher endorses the information the organization or website may provide or recommendations it may make. Further, readers should be aware that Internet websites listed in this work may have changed or disappeared between when this work was written and when it is read. For general information on our other products and services please contact our Customer Care
Department within the United States at (877) 762-2974, outside the United States at (317) 572-3993 or fax (317) 572-4002.
Wiley publishes in a variety of print and electronic formats and by print-on-demand. Some material included with standard print versions of this book may not be included in e-books or in print-on-demand. If this book refers to media such as a CD or DVD that is not included in the version you purchased, you may download this material at http://booksupport.wiley.com. For more informa-tion about Wiley products, visit www.wiley.com.
Library of Congress Control Number: 2013948011
About the Author
Bill Schmarzo has nearly three decades of experience in data warehousing, Business Intelligence, and analytics. He was the Vice President of Analytics at Yahoo from 2007 to 2008. Prior to joining Yahoo, Bill oversaw the Analytic Applications busi-ness unit at Busibusi-ness Objects, Inc., including the development, marketing, and sales of their industry-defi ning analytic applica-tions. Currently, Bill is the CTO of the Enterprise Information Management & Analytics Practice for EMC Global Services. Bill is the creator of the Business Benefi ts Analysis methodology that links an organization’s strategic business initiatives with their supporting data and analytic requirements. He has also co-authored with Ralph Kimball a series of articles on analytic applications. Bill has served on The Data Warehouse Institute’s faculty as the head of the analytic applications curriculum. He has written several white papers and is a frequent speaker on the use of Big Data and advanced analytics to power an organization’s key business initiatives.
His recent blogs can be found at h t t p : / / i n f o c u s . e m c . c o m / a u t h o r /william_schmarzo/
About the Technical Editor
Denise Partlow has served in a wide variety of V.P. and Director of Product Marketing positions at both emerging and established technology companies. She has hands-on experience developing marketing strategies and “Go To Market” plans for complex product and service-based solutions across a variety of software and services companies. Denise has a B.S. in Computer Science from the University of Central Florida. She was a programmer of simulation and control systems as well as a program manager prior to transitioning into product management and marketing.
Credits
Executive Editor
Carol Long
Senior Project Editor
Adaobi Obi Tulton
Technical Editor
Denise Partlow
Production Editor
Daniel Scribner
Copy Editor
Christina Haviland
Editorial Manager
Mary Beth Wakefi eld
Freelancer Editorial Manager
Rosemarie Graham
Associate Director of Marketing
David Mayhew
Marketing Manager
Ashley Zurcher
Business Manager
Amy Knies
Production Manager
Tim Tate
Vice President and Executive Group Publisher
Richard Swadley
Vice President and Executive Publisher
Neil Edde
Associate Publisher
Jim Minatel
Project Coordinator, Cover
Katie Crocker
Proofreader
Sarah Kaikini, Word One
Indexer
Ron Strauss
Cover Image
Ryan Sneed
Cover Designer
Acknowledgments
It’s A Wonderful Life has always been one of my favorite movies. I always envisioned myself a sort of George Baily; someone who always looked for opportunities to give back. So whether it’s been coaching youth sports, helping out with the school band, or even persuading my friend to build an ethanol plant in my hometown of Charles City, Iowa, I’ve always had this drive to give back.
When Carol Long from Wiley approached me about this book project, with the strong and supporting push from Denise Partlow of EMC, I thought of this as the perfect opportunity to give back—to take my nearly 30 years of experience in the data and analytics industry, and share my learnings from all of those years work-ing with some of the best, most innovative people and organizations in the world.
I have been fortunate enough to have many Forrest Gump moments in my life—
situations where I just happened to be at the right place at the right time for no other reason than luck. Some of these moments of serendipity include:
■ One of the fi rst data warehouse projects with Procter & Gamble when I was with Metaphor Computer Systems in the late 1980s.
■ Head of Sales and Marketing at one of the original open source companies,
Cygnus Support, and helping to craft a business model for making money with open source software.
■ Creating and heading up Sequent Computer’s data warehouse business in
the late 1990s, creating one of the industry’s fi rst data warehouse appliances.
■ VP of Analytic Applications at Business Objects in the 2000s, creating some of the industry’s fi rst analytic applications.
■ Head of Advertising Analytics at Yahoo! where I had the great fortune to
experience fi rsthand Yahoo!’s petabyte project, and use big data analytics to uncover the insights buried in all of that data to help Yahoo!’s advertisers optimize their spend across the Yahoo! ad network.
■ A failed digital media startup, JovianDATA, where I experienced the power of cloud computing to bring unbelievable analytic power to bear on one of the digital media’s most diffi cult problems—attribution analysis.
■ And fi nally, my current stint as CTO of EMC Global Services’ Enterprise
I hope that you see from my writing that I learned early in my career that technol-ogy is only interesting (and fun) when it is solving meaningful business problems and opportunities. The opportunity to leverage data and analytics to help clients make more money has always been the most interesting and fun part of my job.
I’ve always admired the teaching style of Ralph Kimball with whom I had the fortune to work with at Metaphor and again as a member of the Kimball Group. Ralph approaches his craft with very pragmatic, hands-on advice. Ralph (and his Kimball Group team of Margy Ross, Bob Becker, and Warren Thornthwaite) have willingly shared their learnings and observations with others through conferences, newsletters, webinars, and of course, their books. That’s exactly what I wanted to do as well. So I’ve been actively blogging about my experiences the past few years, and the book seemed like a natural next step in packaging up my learnings, obser-vations, techniques, and methodologies so that I could share with others.
There are many folks I would like to thank, but I was told that my acknowledg-ments section of the book couldn’t be bigger than the book itself. So here we go with the short list.
■ The Wiley folks—Carol Long, Christina Haviland, and especially Adaobi Obi
Tulton—who reviewed my material probably more times than I did. They get the majority of the credit for delivering a readable book.
■ Marc Demarest, Neil Raden and John Furrier for the great quotes. I hope the book lives up to them.
■ Edd Dumbill and Alistair Croll from Strata who are always willing to give me time at their industry-leading data science conference to test my materials, and to the “Marc and Mark Show” (Marc Demarest and Mark Madsen) who also carve out time in their Strata track to allow me to blither on about the business benefi ts of big data.
■ John Furrier and David Vellante from SiliconAngle and theCube who were
the fi rst folks to use the term “Dean of Big Data” to describe my work in the industry. They always fi nd time for me to participate in their industry-leading, ESPN-like technology web broadcast show.
■ Warren Thornthwaite who found time in his busy schedule to brainstorm and
validate ideas and concepts from the book and provided countless words of encouragement about all things—book and beyond.
Data Storymap (which I discuss in Chapter 12). EMC also gave me the time to write this book (mostly in airplanes as I fl ew from city to city).
I especially want to thank the customers over the past three decades with whom I have had the great fortune to work. They have taught me all that I share in this book and have been willing patients as we have tested and refi ned many of the techniques, tools, and methodologies outlined in this book.
I need to give special thanks to Denise Partlow, without whose support, encour-agement, and demanding nature this book would never have gotten done. She devoted countless hours to reviewing every sentence in this book, sometimes mul-tiple times, and arguing with me when my words and ideas made no sense. She truly was the voice of reason behind every idea and concept in this book. I couldn’t ask for a better friend.
Of course, I want to thank my wife, Carolyn, and our kids, Alec, Max, and Amelia. You’ll see several references to them throughout the book, such as Alec’s (who is our professional baseball pitcher) help with baseball stats and insights. They have been very patient with me in my travels and time away from them. I know that a thank you in a book can’t replace the missed nights tucking you into bed, long tossing on the baseball fi eld or rebounding for you in the driveway, but thanks for understanding and being supportive.
Contents
Preface . . . . xix
Introduction . . . . xxi
1
The Big Data Business Opportunity . . . 1
The Business Transformation Imperative . . . .3
Walmart Case Study . . . .3
The Big Data Business Model Maturity Index . . . .5
Business Monitoring . . . .7
Business Insights . . . .7
Business Optimization . . . .9
Data Monetization . . . . 10
Business Metamorphosis . . . . 12
Big Data Business Model Maturity Observations . . . . 16
Summary . . . . 18
2
Big Data History Lesson . . . 19
Consumer Package Goods and Retail Industry Pre-1988 . . . . 19
Lessons Learned and Applicability to Today’s Big Data Movement . . . . 23
Summary . . . . 24
3
Business Impact of Big Data . . . 25
Big Data Impacts: The Questions Business Users Can Answer . . . . 26
Managing Using the Right Metrics . . . . 27
Data Monetization Opportunities . . . .30
Digital Media Data Monetization Example . . . .30
Digital Media Data Assets and Understanding Target Users . . . . 31
Data Monetization Transformations and Enrichments . . . . 32
Big Data
xiv
4
Organizational Impact of Big Data . . . 37
Data Analytics Lifecycle . . . .40
Data Scientist Roles and Responsibilities . . . . 42
Discovery . . . . 43
Data Preparation . . . . 43
Model Planning . . . .44
Model Building . . . .44
Communicate Results . . . . 45
Operationalize . . . .46
New Organizational Roles . . . .46
User Experience Team . . . .46
New Senior Management Roles . . . . 47
Liberating Organizational Creativity . . . . 49
Summary . . . . 51
5
Understanding Decision Theory . . . 53
Business Intelligence Challenge . . . . 53
The Death of Why . . . . 55
Big Data User Interface Ramifi cations . . . . 56
The Human Challenge of Decision Making . . . . 58
Traps in Decision Making . . . . 58
What Can One Do? . . . . 62
Summary . . . . 63
6
Creating the Big Data Strategy . . . 65
The Big Data Strategy Document . . . .66
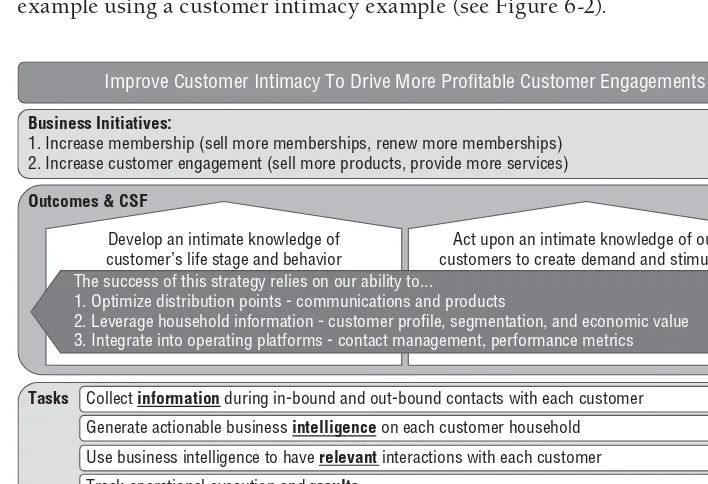
Customer Intimacy Example . . . . 67
Turning the Strategy Document into Action . . . . 69
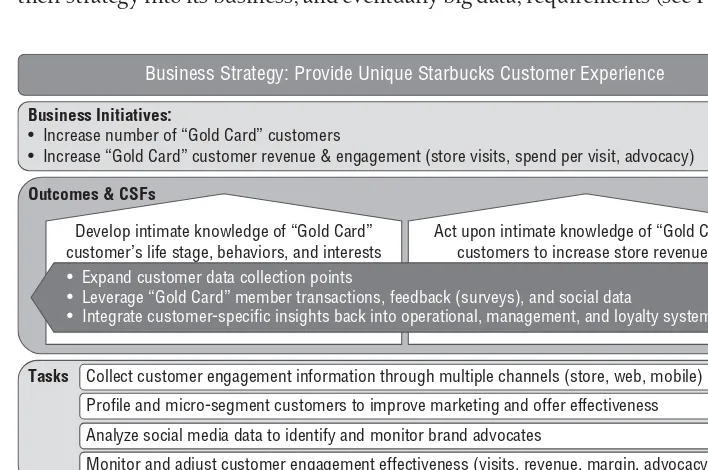
Starbucks Big Data Strategy Document Example . . . . 70
San Francisco Giants Big Data Strategy Document Example . . . . 73
Summary . . . . 77
7
Understanding Your Value Creation Process . . . 79
Understanding the Big Data Value Creation Drivers . . . . 81
Contents
xv
Driver #2: Access to Unstructured Data . . . . 82
Driver #3: Access to Low-latency (Real-Time) Data . . . . 83
Driver #4: Integration of Predictive Analytics . . . .84
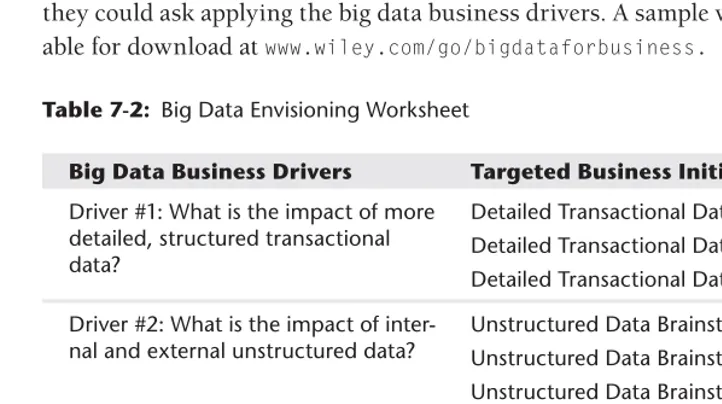
Big Data Envisioning Worksheet . . . . 85
Big Data Business Drivers: Predictive Maintenance Example . . . .86
Big Data Business Drivers: Customer Satisfaction Example . . . . 87
Big Data Business Drivers: Customer Micro-segmentation Example . . . . 89
Michael Porter’s Valuation Creation Models . . . . 91
Michael Porter’s Five Forces Analysis . . . . 91
Michael Porter’s Value Chain Analysis . . . . 93
Value Creation Process: Merchandising Example . . . . 94
Summary . . . . 104
8
Big Data User Experience Ramifi cations . . . 105
The Unintelligent User Experience . . . . 106
Understanding the Key Decisions to Build a Relevant User Experience . . . 107
Using Big Data Analytics to Improve Customer Engagement . . . . 108
Uncovering and Leveraging Customer Insights . . . . 110
Rewiring Your Customer Lifecycle Management Processes . . . 112
Using Customer Insights to Drive Business Profi tability . . . 113
Big Data Can Power a New Customer Experience . . . 116
B2C Example: Powering the Retail Customer Experience . . . 116
B2B Example: Powering Small- and Medium-Sized Merchant Effectiveness . . . 119
Summary . . . . 122
9
Identifying Big Data Use Cases . . . 125
The Big Data Envisioning Process . . . . 126
Step 1: Research Business Initiatives . . . . 127
Step 2: Acquire and Analyze Your Data . . . . 129
Step 3: Ideation Workshop: Brainstorm New Ideas . . . . 132
Step 4: Ideation Workshop: Prioritize Big Data Use Cases . . . . 138
Step 5: Document Next Steps . . . . 139
Big Data
xvi
The Prioritization Matrix Process . . . . 142
Prioritization Matrix Traps . . . . 143
Using User Experience Mockups to Fuel the Envisioning Process . . . . 145
Summary . . . . 149
10
Solution Engineering . . . 151
The Solution Engineering Process . . . . 151
Step 1: Understand How the Organization Makes Money . . . . 153
Step 2: Identify Your Organization’s Key Business Initiatives . . . . 155
Step 3: Brainstorm Big Data Business Impact . . . . 156
Step 4: Break Down the Business Initiative Into Use Cases . . . . 157
Step 5: Prove Out the Use Case . . . . 158
Step 6: Design and Implement the Big Data Solution. . . . 159
Solution Engineering Tomorrow’s Business Solutions . . . . 161
Customer Behavioral Analytics Example . . . . 162
Predictive Maintenance Example . . . . 163
Marketing Effectiveness Example . . . . 164
Fraud Reduction Example . . . . 166
Network Optimization Example . . . . 166
Reading an Annual Report . . . . 167
Financial Services Firm Example . . . . 168
Retail Example . . . . 169
Brokerage Firm Example . . . . 171
Summary . . . . 172
11
Big Data Architectural Ramifi cations . . . 173
Big Data: Time for a New Data Architecture . . . . 173
Introducing Big Data Technologies . . . . 175
Apache Hadoop . . . . 176
Hadoop MapReduce . . . . 177
Apache Hive. . . . 178
Contents
xvii
Pig . . . . 178
New Analytic Tools . . . . 179
New Analytic Algorithms . . . . 180
Bringing Big Data into the Traditional Data Warehouse World . . . . 181
Data Enrichment: Think ELT, Not ETL . . . . 181
Data Federation: Query is the New ETL . . . . 183
Data Modeling: Schema on Read . . . . 184
Hadoop: Next Gen Data Staging and Prep Area . . . . 185
MPP Architectures: Accelerate Your Data Warehouse . . . . 187
In-database Analytics: Bring the Analytics to the Data . . . . 188
Cloud Computing: Providing Big Data Computational Power . . . . 190
Summary . . . . 191
12
Launching Your Big Data Journey. . . 193
Explosive Data Growth Drives Business Opportunities . . . . 194
Traditional Technologies and Approaches Are Insuffi cient . . . . 195
The Big Data Business Model Maturity Index . . . . 197
Driving Business and IT Stakeholder Collaboration . . . . 198
Operationalizing Big Data Insights . . . . 199
Big Data Powers the Value Creation Process . . . .200
Summary . . . . 202
13
Call to Action . . . 203
Identify Your Organization’s Key Business Initiatives . . . . 203
Start with Business and IT Stakeholder Collaboration . . . .204
Formalize Your Envisioning Process . . . .204
Leverage Mockups to Fuel the Creative Process . . . . 205
Understand Your Technology and Architectural Options. . . . 205
Build off Your Existing Internal Business Processes . . . .206
Uncover New Monetization Opportunities . . . .206
Understand the Organizational Ramifi cations . . . . 207
ThinkDiff erently.
Your competitors are already taking advantage of big data, and furthermore, your traditional IT infrastructure is incapable of managing, analyzing and acting on big data.
ThinkDiff erently.
You should care about big data. The most signifi cant impact big data can have on an organization is its ability to upgrade existing business processes and uncover new monetization opportunities. No organization can have too many insights about the key elements of their business, such as their customers, products, campaigns, and operations. Big data can uncover these insights at a lower level of granularity and in a more timely, actionable manner. Big data can power new business applications— such as personalized marketing, location-based services, predictive maintenance attribution analysis, and machine behavioral analytics. Big data holds the promise of rewiring an organization’s value creation processes and creating entirely new, more compelling, and more profi table customer engagements. Big data is about business transformation, in moving your organization from retrospective, batch, business monitoring hindsights to predictive, real-time business optimization insights.
ThinkDiff erently.
Big data forces you to embrace a mentality of data abundance (versus data scarcity) and to grasp the power of analyzing all your data—both internally and externally of the organization—at the lowest levels of granularity in real-time. For example, the old business intelligence “slice and dice” analysis model, which worked well with gigabytes of data, is as outdated as the whip and buggy in an age of petabytes of data, thousands of scale-out processing nodes, and in-database analytics. Furthermore, standard relational database technology is unable to express the complex branching and iterative logic upon which big data analytics is based. You need an updated, modern infrastructure to take advantage of big data.
ThinkDiff erently.
Never has this message been more apropos than when dealing with big data. While much of the big data discussion focuses on Hadoop and other big data tech-nology innovations, the real techtech-nology and business driver is the bigdata econom-ics—the combination of open source data management and advanced analytics
Preface
xx
software on top of commodity-based, scale-out architectures are 20 times cheaper than today’s data warehouse architectures. This magnitude of economic change forces you to rethink many of the traditional data and analytic models. Data trans-formations and enrichments that were impossible three years ago are now readily and cheaply available, and the ability to mine petabytes of data across hundreds of dimensions and thousands of metrics on the cloud is available to all organizations, whether large or small.
ThinkDiff erently.
What’s the biggest business pitfall with big data? Doing nothing. Sitting back. Waiting for your favorite technology vendor to solve these problems for you. Letting the technology-shifting sands settle out fi rst. Oh, you’ve brought Hadoop into the organization, loaded up some data, and had some folks play with it. But this is no time for science experiments. This is serious technology whose value in creating new business models based on petabytes of real-time data coupled with advanced analyt-ics has already been validated across industries as diverse as retail, fi nancial services, telecommunications, manufacturing, energy, transportation, and hospitality.
ThinkDiff erently.
So what’s one to do? Reach across the aisle as business and IT leaders and embrace each other. Hand in hand, identify your organization’s most important business processes. Then contemplate how big data—in particular, detailed transactional (dark) data, unstructured data, real-time data access, and predictive analytics— could uncover actionable insights about your customers, products, campaigns, and operations. Use big data to make better decisions more quickly and more frequently, and uncover new monetization opportunities in the process. Leverage big data to “Make me more money!” Act. Get moving. Be bold. Don’t be afraid to make mistakes, and if you fail, do it fast and move on. Learn.
B
ig data is today’s technology hot topic. Such technology hot topics come around every four to five years and become the “must have” technologies that will lead organizations to the promised land—the “silver bullet” that solves all of our technol-ogy deficiencies and woes. Organizations fight through the confusion and hyperbole that radiate from vendors and analysts alike to grasp what the technology can and cannot do. In some cases, they successfully integrate the technology into the organi-zation’s technology landscape—technologies such as relational databases, Enterprise Resource Planning (ERP), client-server architectures, Customer Relationship Management (CRM), data warehousing, e-commerce, Business Intelligence (BI), and open source software.However, big data feels diff erent, maybe because at its heart big data is not about technology as much as it’s about business transformation—transforming the organi-zation from a retrospective, batch, data constrained, monitor the business environ-ment into a predictive, real-time, data hungry, optimize the business environenviron-ment. Big data isn’t about business parity or deploying the same technologies in order to be like everyone else. Instead, big data is about leveraging the unique and action-able insights gleaned about your customers, products, and operations to rewire your value creation processes, optimize your key business initiatives, and uncover new monetization opportunities. Big data is about making money, and that’s what this book addresses—how to leverage those unique and actionable insights about your customers, products, and operations to make money.
This book approaches the big data business opportunities from a pragmatic, hands-on perspective. There aren’t a lot of theories here, but instead lots of practical advice, techniques, methodologies, downloadable worksheets, and many examples I’ve gained over the years from working with some of the world’s leading organiza-tions. As you work your way through this book, you will do and learn the following:
■ Educate your organization on a common defi nition of big data and leverage
the Big Data Business Model Maturity Index to communicate to your orga-nization the specifi c business areas where big data can deliver meaningful business value (Chapter 1).
■ Review a history lesson about a previous big data event and determine what parts of it you can apply to your current and future big data opportunities (Chapter 2).
Introduction
xxii
■ Learn a process for leveraging your existing business processes to identify
the “right” metrics against which to focus your big data initiative in order to drive business success (Chapter 3).
■ Examine some recommendations and learnings for creating a highly effi
-cient and eff ective organizational structure to support your big data initiative, including the integration of new roles—like the data science and user experi-ence teams, and new Chief Data Offi ce and Chief Analytics Offi cer roles—into your existing data and analysis organizations (Chapter 4).
■ Review some common human decision making traps and defi ciencies,
con-template the ramifi cations of the “death of why,” and understand how to deliver actionable insights that counter these human decision-making fl aws (Chapter 5).
■ Learn a methodology for breaking down, or functionally “decomposing,” your
organization’s business strategy and key business initiatives into its key busi-ness value drivers, critical success factors, and the supporting data, analysis, and technology requirements (Chapter 6).
■ Dive deeply into the big data Masters of Business Administration (MBA) by
applying the big data business value drivers—underleveraged transactional data, new unstructured data sources, real-time data access, and predictive analytics—against value creation models such as Michael Porter’s Five Forces Analysis and Value Chain Analysis to envision where and how big data can optimize your organization’s key business processes and uncover new mon-etization opportunities (Chapter 7).
■ Understand how the customer and product insights gleaned from new sources
of customer behavioral and product usage data, coupled with advanced analyt-ics, can power a more compelling, relevant, and profi table customer experi-ence (Chapter 8).
■ Learn an envisioning methodology—the Vision Workshop—that drives
col-laboration between business and IT stakeholders to envision what’s possible with big data, uncover examples of how big data can impact key business processes, and ensure agreement on the big data desired end-state and critical success factors (Chapter 9).
■ Learn a process for pulling together all of the techniques, methodologies,
tools, and worksheets around a process for identifying, architecting, and delivering big data-enabled business solutions and applications (Chapter 10).
■ Review key big data technologies (Hadoop, MapReduce, Hive, etc.) and
Introduction
xxiii
■ Summarize the big data best practices, approaches, and value creation
tech-niques into the Big Data Storymap—a single image that encapsulates the key points and approaches for delivering on the promise of big data to optimize your value creation processes and uncover new monetization opportunities (Chapter 12).
■ Conclude by reviewing a series of “calls to action” that will guide you and your
organization on your big data journey—from education and awareness, to the identifi cation of where and how to start your big data journey, and through the development and deployment of big data-enabled business solutions and applications (Chapter 13).
■ We will also provide materials for download on www.wiley.com/go
/bigdataforbusiness, including the diff erent envisioning worksheets, the
Big Data Storymap, and a training presentation that corresponds with the materials discussed in this book.
The beauty of being in the data and analytics business is that we are only a new technology innovation away from our next big data experience. First, there was point-of-sale, call detail, and credit card data that provided an earlier big data opportunity for consumer packaged goods, retail, fi nancial services, and telecom-munications companies. Then web click data powered the online commerce and digital media industries. Now social media, mobile apps, and sensor-based data are fueling today’s current big data craze in all industries—both business-to- consumer and business-to-business. And there’s always more to come! Data from newer technologies, such as wearable computing, facial recognition, DNA mapping, and virtual reality, will unleash yet another round of big data-driven value creation opportunities.
The organizations that not only survive, but also thrive, during these data upheavals are those that embrace data and analytics as a core organizational capa-bility. These organizations develop an insatiable appetite for data, treating it as an asset to be hoarded, not a business cost to be avoided. Such organizations manage analytics as intellectual property to be captured, nurtured, and sometimes even legally protected.
The Big Data
Business
Opportunity
E
very now and then, new sources of data emerge that hold the potential to trans-form how organizations drive, or derive, business value. In the 1980s, we saw point-of-sale (POS) scanner data change the balance of power between consumer package goods (CPG) manufacturers like Procter & Gamble, Unilever, Frito Lay, and Kraft—and retailers like Walmart, Tesco, and Vons. The advent of detailed sources of data about product sales, soon coupled with customer loyalty data, provided retailers with unique insights about product sales, customer buying patterns, and overall market trends that previously were not available to any player in the CPG-to-retail value chain. The new data sources literally changed the business models of many companies.Then in the late 1990s, web clicks became the new knowledge currency, enabling online merchants to gain signifi cant competitive advantage over their brick-and-mortar counterparts. The detailed insights buried in the web logs gave online mer-chants new insights into product sales and customer purchase behaviors, and gave online retailers the ability to manipulate the user experience to infl uence (through capabilities like recommendation engines) customers’ purchase choices and the contents of their electronic shopping carts. Again, companies had to change their business models to survive.
Chapter 1
2
brick-and-mortar retailers to compete directly with online retailers in providing an improved, more engaging customer shopping experience.
The massive volumes (terabytes to petabytes), diversity, and complexity of the data are straining the capabilities of existing technology stacks. Traditional data warehouse and business intelligence architectures were not designed to handle petabytes of structured and unstructured data in real-time. This has resulted in the following challenges to both IT and business organizations:
■ Rigid business intelligence, data warehouse, and data management
archi-tectures are impeding the business from identifying and exploiting fl eeting, short-lived business opportunities.
■ Retrospective reporting using aggregated data in batches can’t leverage new analytic capabilities to develop predictive recommendations that guide busi-ness decisions.
■ Social, mobile, or machine-generated data insights are not available in a timely manner in a world where the real-time customer experience is becoming the norm.
■ Data aggregation and sampling destroys valuable nuances in the data that are key to uncovering new customer, product, operational, and market insights.
This blitz of new data has necessitated and driven technology innovation, much of it being powered by open source initiatives at digital media companies like Google (Big Table), Yahoo! (Hadoop), and Facebook (Hive and HBase), as well as universities (like Stanford, UC Irvine, and MIT). All of these big data developments hold the potential to paralyze businesses if they wait until the technology dust settles before moving forward. For those that wait, only bad things can happen:
■ Competitors innovate more quickly and are able to realize compelling cost
structure advantages.
■ Profi ts and margins degenerate because competitors are able to identify, cap-ture, and retain the most valuable customers.
■ Market share declines result from not being able to get the right products to market at the right time for the right customers.
■ Missed business opportunities occur because competitors have real-time lis-tening devices rolling up real-time customer sentiment, product performance problems, and immediately-available monetization opportunities.
The Big Data Business Opportunity
3
The Business Transformation Imperative
The big data movement is fueling a business transformation. Companies that are embracing big data as business transformational are moving from a retrospective, rearview mirror view of the business that uses partial slices of aggregated or sampled data in batch to monitor the business to a forward-looking, predictive view of opera-tions that leverages all available data—including structured and unstructured data that may sit outside the four walls of the organization—in real-time to optimize business performance (see Table 1-1).
Table 1-1: Big data is about business transformation.
Today’s Decision Making Big Data Decision Making
“Rearview Mirror” hindsight “Forward looking” recommendations
Less than 10% of available data Exploit all data from diverse sources
Batch, incomplete, disjointed Real-time, correlated, governed
Business Monitoring Business Optimization
Think of this as the advent of the real-time, predictive enterprise!
In the end, it’s all about the data. Insight-hungry organizations are liberating the data that is buried deep inside their transactional and operational systems, and integrating that data with data that resides outside the organization’s four walls (such as social media, mobile, service providers, and publicly available data). These organizations are discovering that data—and the key insights buried inside the data—has the power to transform how organizations understand their custom-ers, partncustom-ers, supplicustom-ers, products, operations, and markets. In the process, leading organizations are transforming their thinking on data, transitioning from treating data as an operational cost to be minimized to a mentality that nurtures data as a strategic asset that needs to be acquired, cleansed, transformed, enriched, and analyzed to yield actionable insights. Bottom-line: companies are seeking ways to acquire even more data that they can leverage throughout the organization’s value creation processes.
Walmart Case Study
Chapter 1
4
The cornerstone of his [Sam Walton’s] company’s success ultimately lay in selling goods at the lowest possible price, something he was able to do by pushing aside the middlemen and directly haggling with manufacturers to bring costs down. The idea to “buy it low, stack it high, and sell it cheap” became a sustainable business model largely because Walton, at the behest of David Glass, his eventual successor,heavily invested in software that could track consumer behavior in real time from the bar codes read at Walmart’s checkout counters.
He shared the real-time data with suppliers to create partnerships that allowed Walmart to exert significant pressure on manufacturers to improve their productivity and become ever more efficient. As Walmart’s influence grew, so did its power to nearly dictate the price, volume, deliv-ery, packaging, and quality of many of its suppliers’ products. The upshot: Walton flipped the supplier-retailer relationship upside down.1
Walmart up-ended the balance of power in the CPG-to-retailer value chain. Before they had access to detailed POS scanner data, the CPG manufacturers (such as Procter & Gamble, Unilever, Kimberley Clark, and General Mills,) dictated to the retailers how much product they would be allowed to sell, at what prices, and using what promotions. But with access to customer insights that could be gleaned from POS data, the retailers were now in a position where they knew more about their customers’ behaviors—what products they bought, what prices they were willing to pay, what promotions worked the most eff ectively, and what products they tended to buy in the same market basket. Add to this information the advent of the customer loyalty card, and the retailers knew in detail what products at what prices under what promotions appealed to which customers. Soon, the retailers were dictating terms to the CPG manufacturers—how much product they wanted to sell (demand-based forecasting), at what prices (yield and price optimization), and what promotions they wanted (promotional eff ectiveness). Some of these retailers even went one step further and fi gured out how to monetize their POS data by selling it back to the CPG manufacturers. For example, Walmart provides a data service to their CPG manufacturer partners, called Retail Link, which provides sales and inventory data on the manufacturer’s products sold through Walmart.
Across almost all organizations, we are seeing multitudes of examples where data coupled with advanced analytics can transform key organizational business processes, such as:
1 “The 12 greatest entrepreneurs of our time” Fortune/CNN Money (http://money.cnn.com/
The Big Data Business Opportunity
5
■ Procurement: Identify which suppliers are most cost-eff ective in delivering products on-time and without damages.
■ Product Development: Uncover product usage insights to speed product development processes and improve new product launch eff ectiveness.
■ Manufacturing: Flag machinery and process variances that might be indica-tors of quality problems.
■ Distribution: Quantify optimal inventory levels and optimize supply chain activities based on external factors such as weather, holidays, and economic conditions.
■ Marketing: Identify which marketing promotions and campaigns are most eff ective in driving customer traffi c, engagement, and sales, or use attribu-tion analysis to optimize marketing mixes given marketing goals, customer behaviors, and channel behaviors.
■ Pricing and Yield Management: Optimize prices for “perishable” goods such as groceries, airline seats, concert tickets and fashion merchandise.
■ Merchandising: Optimize merchandise markdown based on current buying patterns, inventory levels, and product interest insights gleaned from social media data.
■ Sales: Optimize sales resource assignments, product mix, commissions mod-eling, and account assignments.
■ Store Operations: Optimize inventory levels given predicted buying patterns coupled with local demographic, weather, and events data.
■ Human Resources: Identify the characteristics and behaviors of your most successful and eff ective employees.
The Big Data Business Model Maturity Index
Customers often ask me:■ How far can big data take us from a business perspective?
■ What could the ultimate endpoint look like?
■ How do I compare to others with respect to my organization’s adoption of
big data as a business enabler?
■ How far can I push big data to power—or even transform—my value creation
processes?
Chapter 1
6
measure themselves as they look at what big data-enabled opportunities may lay ahead. Organizations can use this index to:
■ Get an idea of where they stand with respect to exploiting big data and
advanced analytics to power their value creation processes and business mod-els (their current state).
■ Identify where they want to be in the future (their desired state).
Organizations are moving at diff erent paces with respect to how they are adopting big data and advanced analytics to create competitive advantages for themselves. Some organizations are moving very cautiously because they are unclear where and how to start, and which of the bevy of new technology innovations they need to deploy in order to start their big data journeys. Others are moving at a more aggres-sive pace to integrate big data and advanced analytics into their existing business processes in order to improve their organizational decision-making capabilities.
However, a select few are looking well beyond just improving their existing business processes with big data. These organizations are aggressively looking to identify and exploit new data monetization opportunities. That is, they are seek-ing out business opportunities where they can either sell their data (coupled with analytic insights) to others, integrate advanced analytics into their products to cre-ate “intelligent” products, or leverage the insights from big data to transform their customer relationships and customer experience.
Let’s use the Big Data Business Model Maturity Index depicted in Figure 1-1 as a framework against which you can not only measure where your organization stands today, but also get some ideas on how far you can push the big data opportunity within your organization.
Business Optimization Business
Insights Business
Monitoring
Data Monetization
Business Metamorphosis
The Big Data Business Opportunity
7
Business Monitoring
In the Business Monitoring phase, you deploy Business Intelligence (BI) and tradi-tional data warehouse capabilities to monitor, or report on, on-going business per-formance. Sometimes called business performance management, business monitoring uses basic analytics to fl ag under- or over-performing areas of the business, and automates sending alerts with pertinent information to concerned parties whenever such a situation occurs. The Business Monitoring phase leverages the following basic analytics to identify areas of the business requiring more investigation:
■ Trending, such as time series, moving averages, or seasonality
■ Comparisons to previous periods (weeks, months, etc.), events, or campaigns
(for example, a back-to-school campaign)
■ Benchmarks against previous periods, previous campaigns, and industry
benchmarks
■ Indices such as brand development, customer satisfaction, product
perfor-mance, and fi nancials
■ Shares, such as market share, share of voice, and share of wallet
The Business Monitoring phase is a great starting point for your big data jour-ney as you have already gone through the process—via your data warehousing and BI investments—of identifying your key business processes and capturing the KPIs, dimensions, metrics, reports, and dashboards that support those key busi-ness processes.
Business Insights
Chapter 1
8
can be taken to improve business performance. One client called this phase the “Tell me what I need to know” phase. Examples include:
■ In marketing, uncovering observations that certain in-fl ight campaign activi-ties or marketing treatments are more eff ective than others, coupled with specifi c recommendations as to how much marketing spend to shift to the more eff ective activities.
■ In manufacturing, uncovering observations that certain production machines are operating outside of the bounds of their control charts (for example, upper limits or lower limits), coupled with a prioritized maintenance schedule with replacement part recommendations for each problem machine.
■ In customer support, uncovering observations that certain gold card members’ purchase and engagement activities have dropped below a certain threshold of normal activity, with a recommendation to e-mail them a discount coupon.
The following steps will transition your organization from the business monitor-ing to the business insights stage.
1. Invest the time to understand how users are using existing reports and dash-boards to identify problems and opportunities. Check for situations where users are printing reports and making notes to the side of the reports. Find situations where users are downloading the reports into Excel or Access and capture what these users are doing with the data once they have it down-loaded. Understanding what your users are doing with the existing reports and downloads is “gold” in identifying the areas where advanced analytics and real-time data can impact the business.
2. Understand how downstream constituents—those users that are the
consum-ers of the analysis being done in Step 1—are using and making decisions based on the analysis. Ask, “What are these constituents doing with the results of the analysis? What actions are they trying to take? What decisions are they trying to make given the results of the analysis?”
The Big Data Business Opportunity
9
Business Optimization
The Business Optimization phase is the level of business maturity where organiza-tions use embedded analytics to automatically optimize parts of their business operations. To many organizations, this is the Holy Grail where they can turn over certain parts of their business operations to analytic-powered applications that automatically optimize the selected business activities. Business optimization examples include:
■ Marketing spend allocation based on in-flight campaign or promotion
performance
■ Resource scheduling based on purchase history, buying behaviors, and local
weather and events
■ Distribution and inventory optimization given current and predicted buying
patterns, coupled with local demographic, weather, and events data
■ Product pricing based on current buying patterns, inventory levels, and
prod-uct interest insights gleaned from social media data
■ Algorithmic trading in fi nancial services
The following steps will transition your organization from the Business Insights phase to the Business Optimization phase:
1. The Business Insights phase resulted in a list of areas where you are already developing and delivering recommendations. Use this as the starting point in assembling the list of areas that are candidates for optimization. Evaluate these business insights recommendations based on the business or fi nancial impact, feasibility of success, and their relative recommendation performance or eff ectiveness.
2. For each of the optimization candidates, identify the supporting business questions and decision-making process (the analytic process). You will also need to identify the required data sources and timing/latency of data feeds (depending on decision-making frequency and latency), the analytic modeling requirements, and the operational system and user experience requirements.
Chapter 1
10
You should also consider the creation of a formal analytics governance process that enables human subject matter experts to audit and evaluate the eff ectiveness and relevance of the resulting optimization models on a regular basis. As any good data scientist will tell you, the minute you build your analytic model it is obsolete due to changes in the real-world environment around it.
Data Monetization
The Data Monetization phase is where organizations are looking to leverage big data for net new revenue opportunities. While not an exhaustive list, this includes initiatives related to:
■ Packaging customer, product, and marketing insights for sale to other
organizations
■ Integrating analytics directly into their products to create “intelligent”
products
■ Leveraging actionable insights and personalized recommendations based on
customer behaviors and tendencies to upscale their customer relationships and dramatically rethink their “customer experience”
An example of the fi rst type of initiative could be a smartphone app where data and insights about customer behaviors, product performance, and market trends are
sold to marketers and manufacturers. For example, MapMyRun (www.MapMyRun.com)
could package the customer usage insights from their smartphone application with audience and product insights for sale to sports apparel manufacturers, sporting goods retailers, insurance companies, and healthcare providers.
An example of the second type of initiative could be companies that leverage new big data sources (sensor data or user click/selection behaviors) with advanced analytics to create “intelligent” products, such as:
■ Cars that learn your driving patterns and behaviors and use the data to adjust driver controls, seats, mirrors, brake pedals, dashboard displays, and other items to match your driving style.
■ Televisions and DVRs that learn what types of shows and movies you like
and use the data to search across the diff erent cable channels to fi nd and automatically record similar shows for you.
The Big Data Business Opportunity
11
An example of the third type of initiative could be companies that leverage action-able insights and recommendations to “up-level” their customer relationships and dramatically rethink their customer’s experience, such as:
■ Small, medium business (SMB) merchant dashboards from online
market-places that compare current and in-bound inventory levels with customer buying patterns to make merchandising and pricing recommendations
■ Investor dashboards that assess investment goals, current income levels, and current fi nancial portfolios to make specifi c asset allocation recommendations
The following steps will be useful in helping transition to the Data Monetization phase.
1. Identify your target customers and their desired solutions. Focus on identify-ing solutions that improve customers’ business performance and help them make money. As part of that process, you will need to detail out the personas of the economic decision-makers. Invest time shadowing these decision-mak-ers to unddecision-mak-erstand what decisions they are trying to make, how frequently, and in what situations. Spend the time to gather details of what they are trying to accomplish, versus focusing on trying to understand what they are doing.
2. Inventory your current data assets. Capture what data you currently have. Also, identify what data you could have with a little more eff ort. This will require you to look at how the source data is being captured, to explore additional instrumentation strategies to capture even more data, and explore external sources of data that, when combined with your internal data, yields new insights on your customers, products, operations, and markets.
3. Determine the analytics, data enrichment, and data transformation processes necessary to transform your data assets into your targeted customers’ desired solutions. This should include identifying:
■ The business questions and business decisions that your targeted per-sonas are trying to ask and answer
■ The advanced analytics (algorithms, models), data augmentation,
transformation, and enrichment processes necessary to create solutions that address your targeted persona’s business questions and business decisions
Chapter 1
12
Business Metamorphosis
The Business Metamorphosis phase is the ultimate goal for organizations that want to leverage the insights they are capturing about their customers’ usage patterns, product performance behaviors, and overall market trends to transform their busi-ness models into new services in new markets. For example:
■ Energy companies moving into the home energy optimization business by
recommending when to replace appliances (based on predictive maintenance) and even recommending which brands to buy based on the performance of diff erent appliances compared to customer usage patterns, local weather, and environmental conditions, such as local water conditions and energy costs.
■ Farm equipment manufacturers transforming into farming optimization
busi-nesses by understanding crop performance given weather and soil conditions, and making seed, fertilizer, pesticide, and irrigation recommendations.
■ Retailers moving into the shopping optimization business by recommending
specifi c products given a customer’s current buying patterns compared with others like them, including recommendations for products that may not even reside within their stores.
■ Airlines moving into the “Travel Delight” business of not only off ering
dis-counts on air travel based on customers’ travel behaviors and preferences, but also proactively fi nding and recommending deals on hotels, rental cars, limos, sporting or musical events, and local sites, shows, and shopping in the areas that they are visiting.
In order to make the move into the Business Metamorphosis phase, organizations need to think about moving away from a product-centric business model to a more platform- or ecosystem-centric business model.
Let’s drill into this phase by starting with a history lesson. The North American video game console market was in a massive recession in 1985. Revenues that had peaked at $3.2 billion in 1983, fell to $100 million by 1985—a drop of almost 97 percent. The crash almost destroyed the then-fl edgling industry and led to the bankruptcy of several companies, including Atari. Many business analysts doubted the long-term viability of the video game console industry.
The Big Data Business Opportunity
13
The industry was revitalized in 1987 with the success of the Nintendo Entertainment System (NES). To ensure ecosystem success, Nintendo instituted strict measures to ensure high-quality games through licensing restrictions, maintained strict control of industry-wide game inventory, and implemented a security lockout system that only allowed certifi ed games to work on the Nintendo platform. In the process, Nintendo ensured that third-party developers had a ready and profi table market.
As organizations contemplate the potential of big data to transform their business models, they need to start by understanding how they can leverage big data and the resulting analytic insights to transform the organization from a product-centric business model into a platform-centric business model. Much like the Nintendo lesson, you accomplish this by creating a marketplace that enables others—like app developers, partners, VARs, and third party solution providers—to make money off of your platform.
Let’s build out the previous example of an energy company moving into the home energy optimization business. The company could capture home energy and appliance usage patterns that could be turned into insights and recommendations. For example, with the home energy usage information, the company could recom-mend when consumers should run their high energy appliances, like washers and dryers, to minimize energy costs. The energy company could go one step further and off er a service that automatically manages when the washer, dryer, and other high-energy appliances run—such as running the washer and dryer at 3:00 a.m. when energy prices are lower.
With all of the usage information, the company is also in a good position to pre-dict when certain appliances might need maintenance (for example, monitoring their usage patterns using Six Sigma control charts to fl ag out-of-bounds performance problems). The energy company could make preventive maintenance recommenda-tions to the homeowner, and even include the names of three to four local service dealers and their respective Yelp ratings.
But wait, there’s more! With all of the product performance and maintenance data, the energy company is also in an ideal position to recommend which appli-ances are the best given the customer’s usage patterns and local energy costs. They
could become the Consumer Reports for appliances and other home and business
equipment by recommending which brands to buy based on the performance of diff erent appliances as compared to their customers’ usage patterns, local weather, environmental conditions, and energy costs.
Chapter 1
14
In this scenario, there are more application and service opportunities than any single vendor can reasonably supply. That opens the door to transform to a platform-centric business model that creates a platform or ecosystem that enables third party developers to deliver products and services on that platform. And, of course, this puts the platform provider in a position to take a small piece of the “action” in the process, such as subscription fees, rental fees, transaction fees, and referral fees.
Much like the lessons of Nintendo with their third-party video games, and Apple and Google with their respective apps stores, creating such a platform not only benefi ts your customers who are getting access to a wider variety of high-value apps and services in a more timely manner, it also benefi ts the platform provider by creating a high level of customer dependency on your platform (for example, by increasing the switching costs).
Companies that try to do all of this on their own will eventually falter because they’ll struggle to keep up with the speed and innovation of smaller, hungrier orga-nizations that can spot and act on a market opportunity more quickly. Instead of trying to compete with the smaller, hungrier companies, enable such companies by giving them a platform on which they can quickly and profi tability build, market, and support their apps and solutions.
So how does your company make the business m etamorphosis from a product to a platform or ecosystem company? Three steps are typically involved:
1. Invest the time researching and shadowing your customers to understand their desired solutions. Focus on what the customer is trying to accomplish, not what they are doing. Think more broadly about their holistic needs, such as:
■ Feeding the family, not just cooking, buying groceries, and going to restaurants
■ Personal transportation, not just buying or leasing cars, scheduling maintenance, and filling the car with gas
■ Personal entertainment, not just going to the theater, buying DVDs,
or downloading movies
2. Understand the potential ecosystem players (e.g., developers) and how they could make money off of your platform. Meet with potential ecosystem players to brainstorm and prioritize their diff erent data monetization opportunities to:
■ Clarify, validate, and flush out the ecosystem players’ business case
■ Identify the platform requirements that allow the ecosystem players
The Big Data Business Opportunity
15
3. As the platform provider, focus product development, marketing, and part-nering eff orts on ensuring that the platform:
■ Is easy to develop on and seamlessly supports app developer
market-ing, sales, service, and support (for example, app fixes, new product releases, addition of new services)
■ Is scalable and reliable with respect to availability, reliability,
extensi-bility, data storage, and analytic processing power
■ Has all the tools, data processing, analytic capabilities (such as
rec-ommendation engines), and mobile capabilities to support modern application development
■ Simplifies how qualified third parties make money with respect to
contracts, terms and conditions, and payments and collections
■ Enables developers to easily capture and analyze customer usage and
product performance data in order to improve their customers’ user experience and help the developers optimize their business operations (for example, pricing, promotion, and inventory management)
This step includes creating user experience mockups and prototypes so that you can understand exactly how successfully and seamlessly customers are able to interact with the platform (for example, which interface processes cause users the most problems, or where do users spend an unusual amount of time). Mockups are ideal for web- or smartphone-based applications, but don’t be afraid to experiment with different interfaces that have different sets of test customers to improve the user experience. Companies like Facebook have used live experimentation to iterate quickly in improving their user experience. Heavily instrument or tag every engagement point of the user experience so that you can see the usage patterns and potential bottlenecks and points of frustration that the users might have in interacting with the interface.
As your organization advances up the big data business model maturity index, you will see three key cultural or organizational changes:
■ Data is becoming a corporate asset to exploit, not a cost of business to be
minimized. Your organization starts to realize that data has value, and the more data you have at the most granular levels of detail, the more insights you will be able to tease out of the data.
■ Analytics and the supporting analytic algorithms and analytic models are
Chapter 1
16
maintenance—all of these are potential diff erentiators in the marketplace that can be exploited for diff erentiated business value and may need to be legally protected.
■ Your organization becomes more comfortable making decisions based on
the data and analytics. The business users and business management become more confi dent in the data and begin trusting what the data is telling them about their business. The need to rely solely on the organization’s HiPPO (Highest Paid Person’s Opinion) gives way to an organizational culture that values making decisions based on what the data and the analytics are showing.
Big Data Business Model Maturity
Observations
The fi rst observation is that the fi rst three phases of the Big Data Business Model Maturity Index are internally focused—optimizing an organization’s internal business processes, as highlighted in Figure 1-2. This part of the maturity index leverages an organization’s data warehouse and business intelligence investments, especially the key performance indicators, data transformation algorithms, data models, and reports and dashboards around the organization’s key business pro-cesses. There are four big data capabilities that organizations can leverage to enhance their existing internal business processes as part of the maturity process:
■ Mine all the transactional data at the lowest levels of detail much of which is not being analyzed today due to data warehousing costs. We call this the organizational “dark” data.
■ Integrate unstructured data with detailed structured (transactional) data to provide new metrics and new dimensions against which to monitor and opti-mize key business processes.
■ Leverage real-time (or low-latency) data feeds to accelerate the organization’s ability to identify and act upon business and market opportunities in a timely manner.
The Big Data Business Opportunity
17
Business Optimization Business
Insights Business
Monitoring
Data Monetization
Business Metamorphosis Internal Process
Optimization
Figure 1-2: Big Data Business Model Maturity Index: Internal Process Optimization
The second observation is that the last two phases of the Big Data Business Model Maturity Index are externally focused—creating new monetization opportunities based upon the customer, product, and market insights gleaned from the fi rst three phases of the maturity index, as highlighted in Figure 1-3. This is the part of the big data journey that catches most organizations’ attention; the opportunity to leverage the insights gathered through the optimization of their internal business processes to create new monetization opportunities. We call this area of the Big Data Business Model Maturity Index the four Ms of big data: Make Me More Money!
Business Optimization Business
Insights Business
Monitoring
Data Monetization
Business Metamorphosis
External Customer Monetization Customer Insights
Product Insights
Market Insights
Chapter 1
18
Summary
This chapter introduced you to the business drivers behind the big data movement. I talked about the bevy of new data sources available covering structured, semi-structured (for example, log fi les generated by sensors), and unsemi-structured (e.g., text documents, social media postings, physician comments, service logs, consumer comments) data. I also discussed the growing sources of publicly available data that reside outside the four walls of an organization.
This chapter also briefl y covered why traditional data warehousing and business intelligence technologies are struggling with the data volumes, the wide variety of new unstructured data sources and the high-velocity data that shrinks the latency between when a data event occurs and when that data is available for analysis and actions.
Probably most importantly, you learned how leading organizations are leveraging big data to transform their businesses—moving from a retrospective view of the business with partial chunks of data in batch to monitor their business performance, to an environment that integrates predictive analytics with real-time data feeds that leverage all available data in order to optimize the business.
Big Data History
Lesson
C
hapter 1 hinted at how retail point-of-sale (POS) scanner data caused a big data revolution that transformed the Consumer Package Goods (CPG) and retail industries in the late 1980s and 1990s. Let’s spend a bit more time on that event, as there are some valuable lessons to be learned that apply to today’s big data revolution.Consumer Package Goods and Retail
Industry Pre-1988
In the 1970s and early 1980s, CPG manufacturers such as Procter & Gamble, Unilever, Colgate-Palmolive, Kraft, and General Mills, to name but a few, and large grocery, drug, and mass merchandise retailers made their marketing decisions based on bi-monthly Nielson store audit data. That is, Nielsen would send people into a sample of stores (in only about 12 cities across the United States) to conduct physi-cal audits—to count how much product was on the shelf, the price of the product, how much linear footage the product had across the front of the shelf, product sales within that store, and other data. Nielsen would aggregate this information by product category in order to calculate market share by volume and revenue, share of shelf space, etc. The results of the audits were then delivered every two months to the retailers and CPG manufacturers, usually in booklet format. CPG manufac-turers could also request the data in tape format, but the data volumes were easily in the megabyte range.
So a company like Procter & Gamble would use this data for their Crest brand toothpaste, combined with their own internal orders and shipments data, to com-pare their sales to other toothpaste brands in the dentifrice product category. The Crest brand team would use this data to plan, execute, and measure their marketing strategies including promotional spending, new product introductions, and pricing decisions.