Creating Value with Big Data Analytics
Our newly digital world is generating an almost unimaginable amount of data about all of us. Such a vast amount of data is useless without plans and strategies that are designed to cope with its size and complexity, and which enable organ-isations to leverage the information to create value. This book is a refreshingly practical yet theoretically sound roadmap to leveraging big data and analytics.
Creating Value with Big Data Analytics provides a nuanced view of big data development, arguing that big data in itself is not a revolution but an evolution of the increasing availability of data that has been observed in recent times. Building on the authors’ extensive academic and practical knowledge, this book aims to provide managers and analysts with strategic directions and practical analytical solutions on how to create value from existing and new big data.
By tying data and analytics to specific goals and processes for implementation, this is a much-needed book that will be essential reading for students and specialists of data analytics, marketing research, and customer relationship management.
Peter C. Verhoef is Professor of Marketing at the Department of Marketing, Faculty of Economics and Business, University of Groningen, The Netherlands. He also holds a visiting professorship in Marketing at BI Norwegian Business School in Oslo.
Edwin Kooge is co-founder of Metrixlab Big Data Analytics, The Netherlands. He is a pragmatic data analyst, a result-focused consultant, and entrepreneur with more than 25 years’ experience in analytics.
This is a timely and thought-provoking book that should be on a must-read list of anyone interested in big data.
Sunil Gupta,
Edward W. Carter Professor of Business, Harvard Business School, USA
This is one of the most compelling publications on the challenges and opportunities of data analytics. It paints not only a theoretical framework, but also navigates marketing professionals on organizational change and development of skills and capabilities for success. A must-read to unlock the full potential of data-driven and fact-based marketing!
Harry Dekker,
Media Director, Unilever Benelux, The Netherlands Creating Value with Big Data Analytics offers a uniquely comprehensive and well-grounded examination of one of the most critically important topics in marketing today. With a strong customer focus, it provides rich, practical guidelines, frameworks and insights on how big data can truly create value for a firm.
Kevin Lane Keller,
Tuck School of Business, Dartmouth College, USA
No longer can marketing decisions be made on intuition alone. This book represents an excellent formula combining leading edge insight and experience in marketing with digital analytics methods and tools to support better, faster and more fact-based decision-making. It is highly recommended for business leaders who want to ensure they meet customer demands with precision in the 21st century.
Morten Thorkildsen,
CEO Rejlers, Norway; chairman of IT and communications company, Itera; former CEO, IBM Norway (2003–13); ex-chairman the Norwegian Computer Society (2009–13), and visiting lecturer Norwegian Business School, Norway
Big Data is the next frontier in marketing. This comprehensive, yet eminently readable book by Verhoef, Kooge and Walk is an invaluable guide and a must-read for any marketer seriously interested in using big data to create firm value.
Jan-Benedict E.M. Steenkamp,
Massey Distinguished Professor of Marketing, Marketing Area Chair & Executive Director AiMark, Kenan-Flagler Business School, University of North Carolina at Chapel Hill, USA
This book goes beyond the hype, to provide a more thorough and realistic analysis of how big data can be deployed successfully in companies; successful in the sense of creating value both for the customer as well as the company, as well as what the pre-requisites are to do so. This book is not about the hype, nor about the analytics, it is about what really matters: how to create value. It is also illustrated with a broad range of inspiring company cases.
Hans Zijlstra,
Creating Value with Big Data Analytics
Making smarter marketing decisions
First published 2016 by Routledge
2 Park Square, Milton Park, Abingdon, Oxon OX14 4RN and by Routledge
711 Third Avenue, New York, NY 10017
Routledge is an imprint of the Taylor & Francis Group, an informa business
© 2015 Peter C. Verhoef, Edwin Kooge and Natasha Walk
The right of Peter C. Verhoef, Edwin Kooge and Natasha Walk to be identified as authors of this work has been asserted by them in accordance with sections 77 and 78 of the Copyright, Designs and Patents Act 1988.
All rights reserved. No part of this book may be reprinted or reproduced or utilised in any form or by any electronic, mechanical, or other means, now known or hereafter invented, including photocopying and recording, or in any information storage or retrieval system, without permission in writing from the publishers.
Every effort has been made to contact copyright holders for their permission to reprint material in this book. The publishers would be grateful to hear from any copyright holder who is not here acknowledged and will undertake to rectify any errors or omissions in future editions of this book.
Trademark notice: Product or corporate names may be trademarks or registered trademarks, and are used only for identification and explanation without intent to infringe.
British Library Cataloguing in Publication Data
A catalogue record for this book is available from the British Library
Library of Congress Cataloging in Publication Data
Verhoef, Peter C., author.
Creating value with big data analytics: making smarter marketing decisions / Peter Verhoef, Edwin Kooge and Natasha Walk.
pages cm
Includes bibliographical references and index.
Contents
List of figures List of tables Foreword Preface
Acknowledgements List of abbreviations 1 Big data challenges
Introduction Explosion of data
Big data become the norm, but… Our objectives
Our approach Reading guide
2 Creating value using big data analytics Introduction
Big data value creation model The role of culture
Big data analytics
From big data analytics to value creation Value creation model as guidance for book Conclusions
2.1 Value-to-customer metrics Introduction
New big data market metrics
Data integration in the era of big data
Classic 6: Attribute importance analysis
Big data area 5: Integrated big data models Big data area 6: Social listening
Introduction
Case 1: CLV calculation for energy company
Case 2: Holistic marketing approach by big data integration at an insurance company Case 3: Implementation of big data analytics for relevant personalization at an online
retailer
Case 4: Attribution modeling at an online retailer
Case 5: Initial social network analytics at a telecom provider Conclusions
7 Concluding thoughts and key learning points Concluding thoughts
Figures
1.1 Effects of new developments including big data on GDP 1.2 Reading guide for book
2.1 Big data value creation model
2.2 Value-to-customer vs. value-to-firm 2.3 Classification of V2C and V2F metrics
2.4 Big data value creation model linked to chapters 2.1.1 Search results on “tablet” worldwide
2.1.2 Search interest in “big data” and “market research”
2.1.3 Example of tracking aided and spontaneous awareness through time
2.1.4 Example of brand preference of smartphone users, de-averaged to gender and age 2.1.5 Brand-Asset Valuator® model
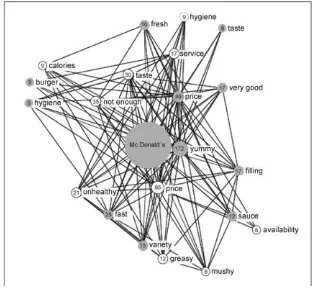
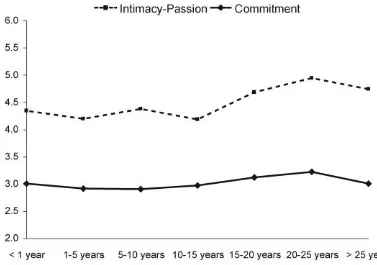
2.1.6 Association network of McDonald’s based on online data 2.1.7 Average number of likes and comments per product category 2.1.8 Development of intimacy and commitment over time
2.2.1 UK smartphone sales
2.2.2 Example of brand switching matrix 2.2.3 Brand revenue premium
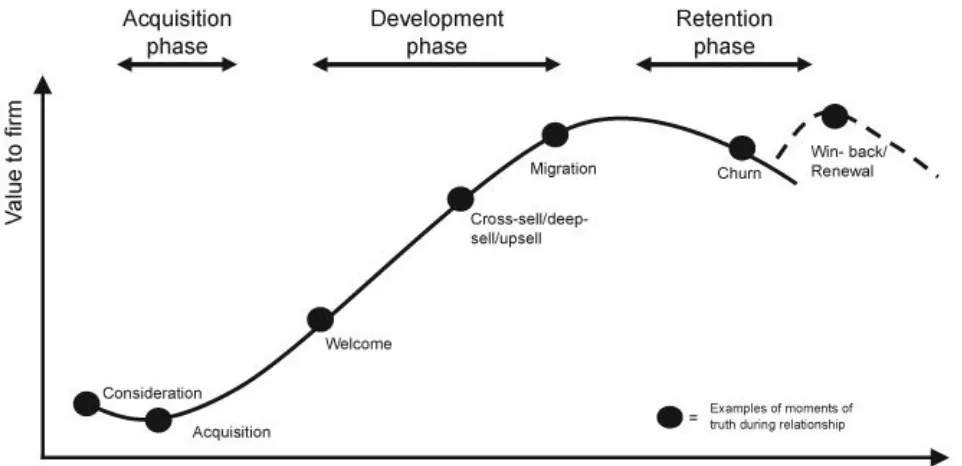
2.2.4 Relationship lifecycle concept
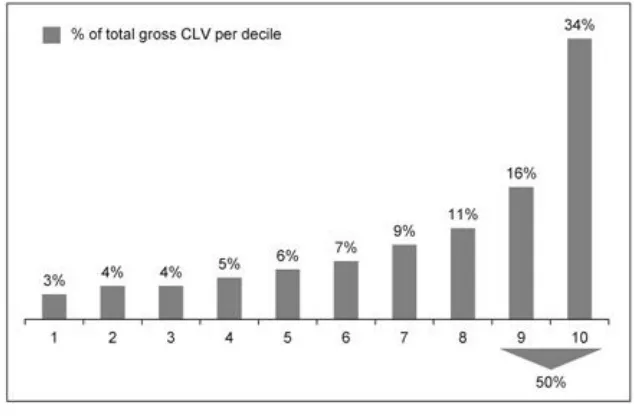
2.2.5 The CLV model: the elements of customer lifetime value 2.2.6 Example of gross CLV distribution per decile
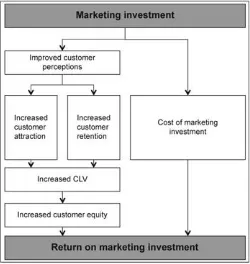
2.2.7 Customer equity ROI model
2.2.8 Customer engagement value: Extending CLV 2.2.9 Example of ROI calculation
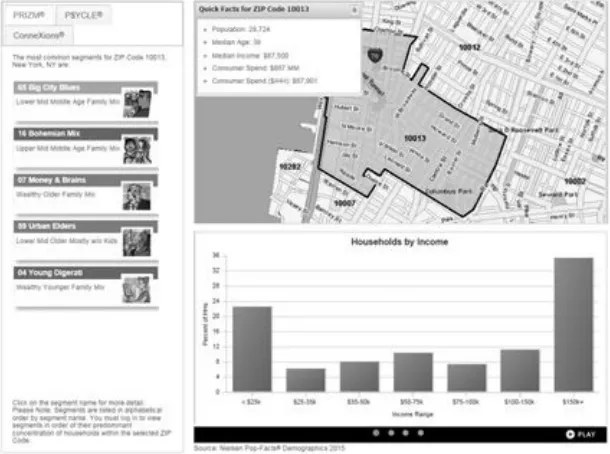
3.2 Example of Nielsen-Claritas information for a New York ZIP-code 3.3 Illustration of structured and unstructured data
3.4 Example of market data on the supply side for UK supermarkets 3.5 Example of market data on the demand side
3.6 Illustration of brand supply data extracted from internal systems 3.7 Illustration of brand demand based on market research
3.8 Illustration of a data model of customer supply data 3.9 Illustration of customer demand data (NPS)
3.10 The 5 “W”s model for assessment of data sources
3.11 Example of simple data table with customer as central element 3.12 Example of product data table derived from customer database 3.13 Net benefits of investing in data quality
3.1.1 The ETL process
3.1.2 The different data types
3.1.3 Overview of segmentation scheme used by Experian UK
3.1.4 External profiling using ZIP-code segmentation for clothing retailer 3.1.5 Presence of data types for Dutch firms
3.1.6 The challenges of data integration 3.2.1 Data protection laws around the globe
3.2.2 Effectiveness increase of Facebook advertising campaigns after addition of privacy button
3.2.3 Different ways of handling privacy sensitive data
4.1 Associations between customer analytics deployment and performance per industry 4.2 Different levels of statistical sophistication
4.3 Optimization of market share vs. revenue per price level 4.4 Classification of analysis types
4.5 Big data analysis strategies 4.6 Problem-solving process
4.9 Different conversion rates after device switching 4.10 How big data are changing analytics
4.11 Impact of WhatsApp usage on the smartphone usage of a Dutch telecom company 4.12 Case example of multi-source data analysis of relation between brand performance
and sales share
4.13 Different types of data approaches
4.14 Average top-decile lifts of model estimated at time 4.1.1 Different distributions causing similar averages 4.1.2 Example of time series for sales
4.1.3 Profiling new customers on age classification
4.1.4 Decile analysis for monetary value and retention rates 4.1.5 Gain chart analysis for book club
4.1.6 External profiling for a clothing retailer using Zip code segmentation 4.1.7 Sales share per customer segment for total coffee and fair trade coffee 4.1.8 Falling subscription base for a telecom provider
4.1.9 Decomposing subscription base in acquisition and churn 4.1.10 Migration matrix of customers of a telecom firm
4.1.11 Like-4-like analysis for value development of the customer base of a phone operator 4.1.12 Steps for execution of an L4L analysis
4.1.13 Example of a cohort analysis 4.1.14 Example of a survival analysis 4.1.15 Example of a dendrogram 4.1.16 Visualization clusters
4.1.17 Example of a cluster analysis of shoppers 4.1.18 Trend analysis
4.1.19 Effects of different marketing instruments on sales for a chocolate brand 4.1.20 Predictions for service quality time series of a European public transport firm 4.1.21 Effects of store attributes on store satisfaction
4.1.22 Attributes chosen for study on cab services
4.1.24 Segmentation analysis for conjoint study on cab services 4.1.25 Response rate for different RFM-segments
4.1.26 Example of a decision tree using CHAID
4.1.27 Output of logistic regression mailing example in SPSS 4.1.28 Gains chart
4.2.1 Online purchase funnel 4.2.2 A/B testing
4.2.3 Effect of different touchpoints on advertising recall and brand consideration 4.2.4 Use of different channel for search and purchase: Webrooming vs. showrooming 4.2.5 Latent class segmentation based on customer channel usage
4.2.6 Revenues, costs, and profit per group with and without search channel catalog 4.2.7 Purchase funnel: Path to purchase on mobile handset
4.2.8 Comparison of effects estimated by attribution model and last click method 4.2.9 Closed-loop marketing process
4.2.10 Schematic overview of recommendation agent in hotel industry 4.2.11 Flu activity USA predicted by Google
4.2.12 Estimation results of multi-level model to assess performance of CFMs
4.2.13 Effects of marketing mix variables on brand performance using time-varying parameter models
4.2.14 Text analytics approach 4.2.15 Illustration of POS tagging 4.2.16 Illustration of a word cloud
4.2.17 Number of tweets by time and sentiment 4.2.18 Degree centrality
4.2.19 Betweenness centrality and closeness centrality 4.3.1 Information overload
4.3.2 Sweet spot of data, story and visual 4.3.3 Building blocks for a clear storyline
4.3.4 Analysis process vs. effective communication
4.3.6 Graph of Anscombe’s Quartet data table
5.2 Changing role of the marketing intelligence department 5.3 Phases of the standard analytical process
5.4 Multi-disciplinary skills of an analyst 5.5 Possible big data staff profiles
5.6 Stepwise development of analytical competence within the firm
5.7 Number of vendors in marketing technology landscape represented in supergraphics of chiefmaric.com
5.8 Different layers of a big data analytical system 5.9 Linking data, analyses, actions and campaigns
5.10 Flow diagram of the adaptive personalization system developed by Chung, Rust and Wedel (2009)
5.11 Organization models for the analytical function
5.12 Different personality profiles of analysts and marketeers 6.1 Value drivers for an energy company
6.2 Contribution of each of the value drivers to CLV
6.3 Impact of different value driver improvements on CLV 6.4 The big data dashboard
6.6 From search/purchase behavior to product combinations
6.7 Algorithm for calculating product recommendations based on the product relation score 6.8 MapReduce programming model
6.9 Results of new way of working 6.10 Visualization of model being used
6.11 Comparison of effects for attribution model and last-click method 6.12 Comparison of complex model with simpler model
6.13 Results of cluster analysis on social network variables of telecom brand 7.1 Key learning points by chapter
Tables
2.1.1 Example of items used to measure Rogers’ adoption drivers 2.1.2 Definitions of BAV® components
2.1.3 Overview of different customer feedback metrics 2.1.4 Conceptualization of customer feedback metrics 2.1.5 Criteria for good metrics
4.1.1 Seven classic data analytics 4.1.2 Gains and lift scale
4.2.1 Seven big data analytics
Foreword
Companies around the world are struggling with a vast amount of data, and can’t make sense of it all. “Big data” has the promise of providing firms with significant new information about their markets, their products, their brands, and their customers—but currently, there’s often a great divide between big data and truly usable insights that create value for the firm and the customer.
This book addresses this huge need. When I had the opportunity to read Creating Value with Big Data Analytics: Making smart marketing decisions, my first reaction was: Thank goodness! Where has this book been all my life? Finally, here’s a book that provides a clear, detailed, and usable roadmap for big data analytics. I know that’s hard to believe, but read on.
As I write this, Facebook has reached a new milestone of 1 billion users in a single day. Just think of the big data analytics opportunities from just that one day. Verhoef, Kooge and Walk have developed a theoretically sound and highly practical framework. Their value creation model just makes sense; it makes the complex simple. First, they clearly identify the goal of any analytic “job to be done”, focusing on either (a) creating and measuring value to the customer, or (b) creating and measuring value to the firm. They further break these two goals down into three levels: market level, brand level and
customer level. This clear delineation of six key analytic areas of focus, followed by practical, “how-to” guides for using and analyzing big data to answer questions in each of these key areas, is a highly executable approach, well grounded in rigorous scientific research.
They do a great job of achieving three key objectives:
1. Teaching us all how “big data” provide new opportunities to create value for the customer (so customers like our products and services better), and for the firm (so we make more profit), while also helping us to be mindful of key security and privacy issues. This framework makes the book work.
approaches for all areas of marketing, including analytic classics, new big data techniques, story-telling and visualization.
3. Teaching us how to develop a big data analytics capability focused on value creation—that delivers growth and positive ROI. By taking us through the entire process from getting the data, to integrating the data, to analysis, to insight, to value, to the role of the organization—the roadmap is complete, and ready for anyone to begin.
Who should read this book? Anyone who needs to understand customers, products, brands, markets or firms. CMOs and marketing executives should read this book—it provides great insights into how you can develop a successful big data analytics capability, and how to interpret insights from big data to fuel growth. Those individuals charged with insights within the organization should read this book: one of the key learnings from Verhoef, Kooge and Walk’s approach is that you’ll know what analysis to do, when, for what purpose, and with what data. That’s huge! Data scientists should read this book—not because you need to learn the analysis techniques described here (you may be aware of many of them), but because it will strengthen your ability to gain insights on marketing problems and help you to communicate your ideas and insights to the rest of the organization. Even professors and students of analytics should read this book. It provides a rigorous approach to frame your thinking and build your analytic skills. And finally, if your head is swimming and you’re overwhelmed with the opportunities and complexities of the “firehose” of big data, this book is for you.
I believe it’s the Rosetta Stone we’ve all been looking for, finally answering critical questions: How do we create insights from big data for marketing? How do we create value from big data? How do we solve problems with big data? And how do we get a positive ROI on our investment in big data analytics? Whether you are just starting on your journey in big data analytics, or well on your way, you will learn a ton from this book.
The authors don’t shy away from all the complexities and the messiness of big data and analytics. Rather, they make the complex manageable and understandable. They explain difficult analytic approaches clearly and show you when— and why—to use what technique. They provide a rare combination of science and practicality. Examples, cases and practical guidelines are clear, detailed and readable, taking you to that next step of getting to the business of analyzing your own big data to create value for your customers and your firm.
Katherine N. Lemon, PhD
Preface
When we started our careers in marketing analytics, it was a small discipline which attracted only minor attention from the boards of companies. Analytics was mainly developed in firms having a strong direct marketing focus, such as Readers Digest. Beyond that, research agencies were trying to develop analytical solutions for more brand-oriented companies. During our careers this situation has dramatically changed. Analytics have become a major discipline in many firms and scientific evidence strongly supports the performance impact of a strong analytics department. Successful examples in leading firms provide only more support for having a strong analytical function. Marketing has become more data-driven in the past decade!
This development has only become more prominent with the arrival of “big data”. CEOs of banks, retailers, telecom providers, etc. now consider big data as an important growth opportunity in several aspects of their businesses. Despite this, we observe that many firms face strong challenges when developing big data initiatives. Many firms embrace big data without having a decent developed analytical function and without having sufficient knowledge in the organization on data analytics, let alone on big data analytics. We therefore believe there was an urgent need to write a book on creating value with big data analytics. In so doing, we strongly sympathized with the view that the existence of big data should not be considered a revolution; it rather builds on the strong developments in data and analytics in the past.
Acknowledgements
Writing this book would not have been possible without the support of many people. Foremost we want to thank Kim Lijding who gave us considerable help in the final stages of the book, especially in getting the chapters organized. We also thank Hans Risselada PhD for some collegial feedback and the many marketing managers and marketing intelligence managers who provided valuable input for our book in the development process. We also acknowledge the support from Nicola Cupit from Routledge during the writing process. Finally, we want to emphasize that writing this book was a great and stimulating joint experience. So enjoy!
DASVAR Double asymmetric vector autoregressive
DSI Digital sentiment index
EBITDA Earnings before interest, taxes, depreciation and amortization
1
Introduction
Explosion of data
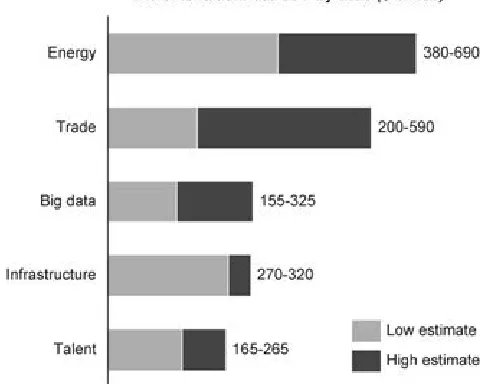
1Data have been around for decades. However, thirty to forty years ago, these data were usually available at an aggregate level, such as a yearly or monthly level. With developments such as scanning technologies, weekly data became the norm. In the 1990s, firms started to invest in large customer databases, resulting in the creation of records of millions of customers in which information on purchase behavior, marketing contacts, and other customer characteristics were stored (Rigby, Reichheld, & Schefter, 2002). The arrival of the Internet and more recently of social media have led to a further explosion of data, and daily or even real-time data have become available to many firms. It is believed that getting value from these data is an important growth engine and will be of value to economies in the coming years (see Figure 1.1).
Figure 1.1 Effects of new developments including big data on GDP
Source: Figure adapted from McKinsey Global Institute (2013)
Big data become the norm, but…
If one considers the popular press, big data have now become the norm and firms have started to understand that they might be able to compete more effectively by analyzing these data (e.g. Davenport & Harris, 2007). There are several popular examples of firms analyzing these data, such as IBM, Tesco, Capital One, Amazon, Google, and Netflix. But many companies struggle with getting value from these data. Besides, firms can easily become disappointed about their efforts regarding big data analytics, as we have seen in earlier data revolutions, such as CRM (e.g. Verhoef & Langerak, 2002). One problem was the dominant role of IT in CRM implementation. The same may happen with big data. Moreover, big data developments have stirred up vigorous discussion and public concern on privacy issues. These discussions and concerns have become even more prevalent as a consequence of the actions of Edward Snowden, who leaked documents that uncovered the existence of numerous global surveillance programs, many of them run by the NSA and the Five Eyes with the cooperation of telecommunication companies and European governments.2 But still firms underestimate the privacy reactions of customers and societal organizations. For example, when the Dutch-based bank ING announced that they were going to use payment information to provide customers with personalized offers and advice, strong reactions on (social) media arose and even the CEO of the Dutch Central Bank said that banks should be very hesitant with this kind of big data initiative.
Our objectives
Given the growing importance of big data, their economic potential, and the problems firms face on capitalizing on these opportunities, we believe there is an urgent need to provide managers with guidance on how to set up big data initiatives. By writing this book we aim to provide managers with this guidance. Specifically the main objectives of this book are threefold:
Our first objective is to teach managers how the increasing presence of new and large data provides new opportunities to create value. For that reason, we discuss not only the increasing presence of these data, but also important value concepts. However, we also consider the possible dark sides of big data and specifically privacy and data security issues.
As a second objective, we aim to show how specific analytical approaches are required, how value can be extracted from these data and new growth opportunities among new and existing customers developed.
Our approach
Although we believe in the potential power of analytics and big data, we aim to provide a more nuanced view on big data developments. In essence, we believe that the existence of big data in itself is not a revolution, it is rather an evolution of the increasing availability of data observed in recent decades as a result of scanner data developments, CRM data developments and online data developments. Big data are making data development more massive and this also leads to new data sources. Despite this, many analytical approaches remain similar and knowledge on, for example, how customer and marketing intelligence units have developed, remains valuable. Building on extensive academic and practical knowledge on multiple issues surrounding analytics, we have written a book that aims to provide managers and analysts with strategic directions, practical data and analytical solutions on how to create value from existing and new big data. To do so, this book has two specific approaches. First, we aimed to write a book that is useful for marketing decisions on multiple levels. Typically there has been a kind of disconnect between, for example, brand management and customer management (Leone et al., 2006). In this book we discuss the use of big data at three levels:
1. market level;
2. brand/product level; and 3. customer level.
We take this approach because we observe that big data have an impact on all these levels. Typical brand-oriented firms, such as Unilever and Phillips, are as interested in big data as firms with individual customer level data, such as ING and Amazon. Moreover, big data provide opportunities for data integration and insights using data from multiple levels.
Reading guide
The structure of our book is displayed in Figure 1.2. We start with two general chapters (of which this introduction is the first). In these chapters we discuss our main underlying vision on big data and customer analytics and the relevance of analytics for firms. In
Chapter 2 we discuss our main big data value creation model that will be used as a guidance for the following chapters. Next we have key chapters which focus on the business management level: we focus on the omnipresence of data (Chapter 3), analytics (Chapter 4) and the development of an analytical organization (Chapter 5). For Chapters 2,
3 and 4 we have written underlying in-depth chapters. For example, for value creation we focus on specific metrics of our value concepts: value-to-firm (V2F) and value-to-customer (V2C). Similarly, in-depth chapters on analytics discuss analytical classics, big data analytics and story-telling and visualization. As previously mentioned, the function of these in-depth chapters is to provide readers with more detailed knowledge and/or tools for each of the more high-level topics discussed in the higher-level chapters. In Chapter 6 we describe specific cases in (big data) analytics. We end by setting out the most important learning points.
Figure 1.2 Reading guide for book
Notes
1 This section is based on Leeflang, Verhoef, Dahlström, & Freundt (2014).
References
Albuquerque, P., Pavlidis, P., Chatow, U., Chen, K., & Jamal, Z. (2012). Evaluating promotional activities in an online two-sided market of user-generated content.
Marketing Science, 31(3), 406–432.
Ali, A. (2015). Why do we follow brands on social media? Retrieved from Social Media Today. Retrieved June 10, 2015 from:
www.socialmediatoday.com/social-business/asadali/2015-05-24/business-social-media-infographic.
Davenport, T., & Harris, J. (2007). Competing on analytics – The new science of winning. Harvard Business School Press.
De Vries, L., Gensler, S., & Leeflang, P. S. H. (2012). Popularity of brand posts on brand fan pages: An investigation of the effects of social media marketing. Journal of Interactive Marketing, 26(2), 83–91.
Fisch, K. (2013). Did you know 3.0. Retrieved January 19, 2013 from:
www.youtube.com/watch?v=jp_oyHY5bug.
IBM. (2012). Analytics: The real-world use of big data – How innovative enterprises extract value from uncertain data. IBM Institute for Business Value. Retrieved September 11, 2015 from
www.ibm.com/smarterplanet/global/files/se__sv_se__intelligence__Analytics_-_The_real-world_use_of_big_data.pdf
Internet Live Stats. (2014) Internet Users by Country. Retrieved from Internet Live Stats. Retrieved June 10, 2015 from www.internetlivestats.com/internet-users-by-country/. Kumar, V., & Reinartz, W. (2005). Customer Relationship Management: A Databased
Approach. USA: John Wiley and Sons.
Leeflang, P. S. H., Verhoef, P. C., Dahlström, P., & Freundt, T. (2014). Challenges and solutions for marketing in a digital era. European Management Journal, 32(1), 1–12. Lemke, F., Clark, M., & Wilson, H. (2011). Customer experience quality: An exploration in
business and consumer contexts using repertory grid technique. Journal of the Academy of Marketing Science, 3(6), 846–869.
Leone, R. P., Rao, V. R., Keller, K. L., Luo, A. M., McAlister, L., & Srivastava, R. (2006). Linking brand equity to customer equity. Journal of Service Research, 9(2), 125–138. Mayzlin, D., & Yoganarasimhan, H. (2012). Link to success: How blogs build an audience by
promoting rivals. Management Science, 58(9), 1651–1668.
McKinsey Global Institute. (2013). Game changers: Five opportunities for US growth and renewal. Retrieved from McKinsey.com. Retrieved September 11, 2015 from
Meer, D. (2013). The ABCs of analytics. Strategy Business, 70, 6–8.
Neslin, S. A., Gupta S., Kamakura, W. A., Lu, J. X., & Mason, C. H. (2006). Defection detection: Measuring and understanding the predictive accuracy of customer churn models. Journal of Marketing Research, 43(2), 204–211.
Onishi, H., & Manchanda, P. (2012). Marketing activity, blogging and sales. International Journal of Research in Marketing, 2(3), 221–234.
Rigby, D. K., Reichheld, F. F., & Schefter, P. (2002). Avoid the four perils of CRM. Harvard Business Review, 82(11), 101–109.
Uptal, M. D., & Durham, E. (2010). One cafe chain’s Facebook experiment. Harvard Business Review, 88(3), 26–26.
Venkatesan, R., & Kumar, V. (2004). A customer lifetime value framework for customer selection and resource allocation strategy. Journal of Marketing, 68(4), 106–215.
Verhoef, P. C., & Langerak, F. (2002). Eleven misconceptions about customer relationship management. Business Strategy Review, 13(4), 70–76.
Verhoef, P. C., & Lemon, K. N. (2013). Successful customer value management: Key lessons and emerging trends. European Management Journal, 31(1), 1–15.
Verhoef, P. C., Reinartz, W. J., & Krafft, M. (2010). Customer engagement as a new perspective in customer management. Journal of Service Research, 13(3), 247–252.
Williamson, D. A. (2011). Worldwide social network ad spending: A rising tide. Retrieved from eMarketer.com. Retrieved September, 2015 from
2
Introduction
Nowadays, the existence of big data is such a hype that firms are investing in big data solutions and organizational units to analyze these data and learn from them. We observe that firms are now, for instance, hiring big data scientists. This occurs in all sectors of the economy including telecom, (online) retailing, and financial services. Firms have a strong belief that analyzing big data can lead to a competitive advantage and can create new business opportunities.
However, at the same time experts are warning of too high expectations. Some commentators even consider big data as being only a hype that will mainly provide disappointing results.1 David Meer (2013) suggests that taking a historical perspective on earlier data explosions shows specific patterns in the beliefs about the potential benefits. He specifically refers to the scanning revolution in the 1980s and the CRM revolution in the late 1990s (Verhoef & Langerak, 2002). Firms typically go through three stages:
1. Data enthusiasm—Investment phase
2. Data disappointment—Frustration disinvestment phase 3. Data realism—Reinvestment phase
In the first phase there are strong beliefs within a firm about the potential benefits that can be achieved. Frequently, top management is seduced by enthusiastic examples in the business press and effective sales strategies of IT, management consultants, and software providers. However, after some years the data explosion investments and initiatives provide mainly disappointing results and failed projects occur frequently. This induces firms to rethink their data strategies and sometimes disinvest in data initiatives and IT. This rethinking of strategies is usually the stepping stone towards a next phase with refined expectations, more realistic ambitions and a stronger focus on the value creating power of data-based initiatives and its return on investment (Verhoef & Lemon, 2013; Rigby & Ledingham, 2004).
Of course firms can go through these phases when implementing big data initiatives. However, this would certainly lead to value destruction, negative ROIs, waste of resources, and enormous frustration. Instead of going through these phases, we propose that firms should have sound initial expectations on the value of potential big data. For this, it is essential to understand how big data can create value. Furthermore, it is our strong belief that firms should understand their analytical strategies and the approach they choose in analyzing available data.
Big data value creation model
One of the biggest challenges of big data is how firms can create value with big data. We have developed the big data value creation model to show how this value creation occurs (see Figure 2.1). This model has four elements:
1. Big data assets 2. Big data capabilities 3. Big data analytics 4. Big data value
Big data assets
Figure 2.1 Big data value creation model
Assets are usually considered as resource endowments that a firm has accumulated over time. These assets can be tangible (e.g. plant) or intangible (e.g. brands, customer relationships). In the past, customer databases were considered important assets for firms (Srivastava, Tasadduq, & Fahey, 1998). For example, these databases could be used to create stronger relationships with customers, achieve higher loyalty, and create more efficient and effective (cross)-selling techniques. In an era of big data, the data are no longer rare. One could actually argue that the data are no longer that valuable, as data are omnipresent, can be collected in multiple ways and are frequently publicly available to many firms (e.g. data on online reviews). In principle, we strongly sympathize with this view. However, we also observe that within firms there is actually a lack of knowledge on the mere presence of data within the firm itself and outside the firm. For example, one of the largest cable manufacturing companies in Europe only recently discovered that by diving into some internal billing data, they could gain valuable insights on loyalty and customer lifetime value (CLV) developments. We will discuss the different sources and types of data in
Big data capabilities
We can see that the value of data is not in the mere presence of the data, but in the underlying capabilities able to exploit these data. We consider capabilities as the “glue” that enables big data—simultaneously with other assets—to be exploited to create value (Day, 1994). For example, using different data sources on customer experiences, one could learn how to improve these experiences, thereby also building on the qualitative input of key customers (relational asset) that may further improve the customer experience.
These underlying capabilities that can be used on big data concern:
1. People actually one of the biggest challenges for firms (Leeflang, Verhoef, Dahlström, & Freundt, 2014). Firms are now hiring big data scientists, but these people are difficult to find. As a consequence, firms have also chosen to educate big data scientists in-house through, for example, specific internal programs and academies (Verhoef & Lemon, 2013). Given that people are of essential importance for a successful big data strategy, we will devote a special chapter to how firms can develop a strong marketing intelligence capability (see
Chapter 5).
Systems
as Hadoop have been developed. Similarly, we observe several new trends in available analytical software. One of the major trends is the development of open source “packages,” such as R, which can be used for free. Although this involves a lot of programming, the programs are widely shared between communities of users, so that these packages become more easily accessible. We will have a more in-depth discussion on systems and specifically data-based solutions and software solutions in Chapter 5.
Process
Organization
The role of culture
Big data analytics
Reading a book about big data and analytics, one would probably expect that analytics would deserve immediate attention. However, analytics not embedded in the organization without the relevant data, culture, and systems will have limited impact and value-creating potential. When discussing big data analytics, we make a distinction between two different forms of analytics:
Analytics focusing on gaining insights
Analytics aiming to develop models to improve decision making.
We define big data insights usually as descriptive findings resulting from data analyses that provide input into marketing decisions. Models are purposely developed to direct and support marketing decisions. Model development is almost like an R&D task in which analysts work to an end goal on a model, which is accepted by the management of the department and users of the models (e.g. Van Bruggen & Wierenga, 2010).
The developed insights and models can create value for firms in three ways:
Decision support for marketing Improved actions and campaigns
Information-based products and solutions
Using the developed insights and models firms can potentially make more informed decisions on where to allocate their marketing budgets. Results of a model can show the specific effectiveness of an advertising channel. For example, when De Vries (2015) showed the limited influence of social media on acquisition, one could question whether a firm should heavily focus on social media to attract new customers. Leeflang et al. (2014) distinguish between two different models that can be developed to drive marketing decision making:
Idiosyncratic, usually more sophisticated models developed to tackle specific marketing problems
Standardized models that have become important tools to improve the quality of tactical marketing decisions.
marketing outcomes.
The improvement of actions and campaigns is mainly relevant in a CRM environment. It mainly has to do with whom to target, when to target and with what message. It has been shown that through effective selection of customers, the ROI of campaigns can be improved (e.g. Bult & Wansbeek, 1995). It has been observed that customization of messages and offers, specifically in an online environment, can be very valuable (Ansari & Mela, 2003). In a big data environment this now occurs in real-time, and is also known as behavioral targeting. This can, however, have negative side effects as it may be considered intrusive (Van Doorn & Hoekstra, 2013).
A relatively new development in the era of big data is the use of results of analyses and models to develop information-based products and solutions that specifically focus on customers to create value for these customers. For example, a novel player in the Dutch banking sector, KNAB bank, is explicitly providing data-based solutions to their customers to advise them how to use their available money (e.g. put it in a savings account). The Dutch railways provide a service to their customers in which, based on actual information on traffic and trains, the fastest transport mode is recommended (Leeflang et al., 2014). Nobel prize winner Rich Thaler believes that these solutions, either developed by suppliers themselves or by other, frequently independent, infomediaries, will become important in helping customers to make more informed decisions (Thaler & Tucker, 2013).
Strategies for analyzing big data
The presence of big data provides huge opportunities for analytical teams. One of the easiest ways of using it is probably just to start up analyses and start digging into the available data. By digging in the data, one might gain very interesting insights, which can guide marketing decisions. The most famous example in this respect is the UK-based retailer Tesco: when analyzing data of their loyalty card, they discovered that consumers buying diapers also frequently buy beer and chips (Humby, Hunt & Phillips, 2008). Although such an example can be inspiring, we posit that before starting up an analytical exercise, one should clearly understand the benefits and disadvantages of this specific analysis strategy as well as that of other strategies. Therefore we strongly advise a more problem-driven approach instead of a rather exploratory findings approach. We discuss these strategies in more depth in Chapter 4.
Big data is changing analytics
Increasing data Volume Increasing data Velocity Increasing data Variety
The increasing volume of data implies that databases become very large, and the analysis of data of millions of customers with hundreds of characteristics is no longer an exception (e.g. Reimer, Rutz, & Pauwels, 2014). Data are also arriving more quickly, which induces faster analysis and faster action (Leeflang et al., 2014). We have been moving from yearly data to monthly data, to weekly data, to daily data and now even to data per hour/minute. Finally, the data are becoming more complex as they arrive in different formats. In the past numerical data was the standard. Nowadays, more unstructured data such as text and audio data are also available, and also video data through, for example, YouTube. Other examples include data on Facebook postings, and GPS data from mobile devices. The three Vs have been extended to five Vs, where Veracity and Value have been added. Veracity refers to the messiness and trustworthiness of data. With the increasing availability of data, not all data are as reliable as one would like. Hence, data quality can be low. For example, it is known that customer reviews are being manipulated. Value is considered as the value that is captured from analyzing and using the data. Although we clearly do acknowledge that value should be captured (see our big data value creation model) it is not a specific characteristic of big data, which is changing analytics.
How these big data are changing marketing analytics is not as clear. Marketing scientists have argued the following: high volume of data implies the need for models that are scalable; high velocity opens opportunities for real-time, or virtually real-time marketing decision making that may or may not be automated; and high variety may require integration across disciplines with the corresponding sensitivity to various methods and philosophies of research.2 In sum, this suggests that models should easily be estimated on
large sample sizes, whereas analytics should be done in such a way that it can provide immediate results, and finally new methodologies from other disciplines, such as computer science and linguistics, should be integrated.
The power of visualization
From big data analytics to value creation
We consider three methods by which big data analytics can create value for customers and firms. First, big data analytics can create important new insights that improve marketing decision making. For example, big data analytics can show how firms can improve customer satisfaction through improving, for example, the specific features of the service experience. By having these insights marketing budgets can be allocated more effectively. Instead of relying on intuition, brand managers can, for example, invest in a positioning strategy that effectively differentiates brands from competitors.
A second value-creation benefit of big data analytics is the development of more effective marketing campaigns, and more specifically more effective targeting of campaigns by selecting the right customers. Where early analytics were mainly focused on immediate response to campaigns (e.g. Feld, Frenzen, Krafft, Peters, & Verhoef, 2013; Bult & Wansbeek, 1995), a longer-term focus is now strongly advocated, achieved by considering the impact of marketing campaigns on CLV and customer equity (e.g., Venkatesan & Kumar, 2004; Rust, Lemon, & Zeithaml, 2004). The effectiveness of both approaches has been shown extensively in the scientific literature. Importantly, these approaches have also been applied in business and have been shown to increase firm value (Kumar & Shah, 2009). Another development is that, especially in an online environment, real-time behavioral targeting is being used to adapt online environments and advertising to specific considered needs of the customer.
A third value-creation benefit is the development of big-data-based solutions for customers. These solutions directly have an impact on customers and should create more value for them. Frequently, this involves an improvement of the service experience in several stages of the purchase process. For example, specific tools can be developed to help customers make better purchase decisions using smart algorithms (e.g. Thaler & Tucker, 2013).
Value creation concepts
Value creation should be the ultimate objective of every big data strategy. However, value creation is one of those terms that is easily written down without a full and complete understanding of the topic. Importantly, we consider value from two perspectives:
1. Value to the customer (V2C) 2. Value to the firm (V2F)
marketing should focus on creating superior value for customers (through high quality, attractive brand propositions and striving for an appropriate relationship), and that firms can capture value from customers in return for this value creation. This is sometimes also referred to as “value delivery” and “value extraction.” Value extraction from customers is considered to be a direct consequence of value delivery. Value extraction occurs by paid price premiums, higher loyalty rates (lower churn), higher revenues per customers and stronger customer advocacy (Reichheld, 1996; Srivastasva et al., 1998). Scientific research indeed suggests that firms which provide more value to customers they tend to have a stronger financial performance (Anderson, Fornell, & Mazvancheryl, 2004).
Balance between V2F and V2C
criticism, by developing customer friendly pricing plans and focusing on a superior service (McGovern, 2007).
Figure 2.2 Value-to-customer vs. value-to-firm
Source: Adapted from Reinartz (2011), and Wiesel et al. (2011)
ways. Some firms, such as Unilever, consider sustainability as one of their core elements in their corporate strategy and aim to show that in their business operation, including brand propositions. However, Procter & Gamble is using a more tactical approach and uses specific activities at the brand level, such as dental education programs in Hispanic neighbourhoods in the US, to show their involvement with local societies.
V2S can partly be reflected in the delivered value to customers. Indeed Rust, Zeithaml and Lemon (2000), for example, consider brand ethics as an integral part of the delivered value by brands. Similarly, corporate social responsibility is considered as a driver of customer satisfaction (Korschun et al., 2014) and customer satisfaction functions as an important mediator in the effect of corporate social responsibility on customer and firm performance (Luo & Bhattacharya, 2009; Onrust, Verhoef, Van Doorn, & Bügel, 2014). In this book we will mainly take this perspective and consider V2S as a driver of V2C. We also observed that corporate reputation measures can be heavily correlated with customer satisfaction metrics over time. In this book we will therefore not specifically differentiate between V2S and V2C. Instead we consider V2S to be a driver of V2C.
Metrics for V2F and V2C
Figure 2.3 Classification of V2C and V2F metrics
Beyond the distinction between V2C and V2F metrics, we distinguish between metrics at the market, brand, and customer level (see Figure 2.3). V2C metrics typically focus on the evaluation of value by customers. V2C metrics at the market level include issues such as product awareness and penetration of new products and services. Brand level V2C metrics focus on brand evaluations and brand knowledge of customers. For example, brand awareness would be a typical V2C metric but so also are brand consideration and brand attitudes. Some of these brand attitudes, such as brand uniqueness and brand innovativeness, are considered as input for mere attitudinal based brand equity measures. At the customer level, typical metrics are customer satisfaction and relationship quality measures. Sometimes these metrics are referred to as customer feedback metrics (e.g. De Haan, Verhoef, & Wiesel, 2015). A very popular V2C metric is the net promotor score. One might argue that operational measures, such as the number of complaints, or the number of reported problems with the product or service, can also be considered as V2C metrics. Although these metrics are typically not evaluations of customers and could be mainly be considered as input for customers’ perceived value, they could be very valuable measures reflecting the delivered value to customers (e.g., Gijsenberg, Van Heerde, & Verhoef, 2015). In this era of big data, these metrics have become more available and they should definitely be considered in an extended V2C value creation analysis.
Typical V2F metrics at the market level are a market volume, category sales, market size, and number of customers. These V2F metrics are generally not so firm specific. At the brand level, one would measure brand or market share and brand sales, and also brand equity, which is a more monetary evaluation of a brand’s value. A measure that can be used here is revenue or price premium (Ailawadi, Lehmann, & Neslin, 2003). At the customer level, CLV is a customer metric that has received enormous attention in the last decade. It can be considered as a key V2F customer metric that really tries to capture the monetary value generated by an average customer over his or her relationship with firms. This measure can be extended by also considering Customer Engagement Value (Kumar et al., 2010), that may include outcomes, such as referrals and actual word of mouth (e.g. Bijmolt et al., 2010). An in-depth discussion of V2C and V2F metrics can be found in
Value creation model as guidance for book
Conclusions
In this chapter we have discussed the big data value creation model in marketing. Understanding this model is essential to understanding the value-creation potential of big data analytics. Big data assets and capabilities are the important building blocks underlying big data value creation. The capabilities involve systems, people, processes, and the organization. If capabilities are present, big data analytics can be deployed. These big data analytics can create marketing insights and models that subsequently can improve marketing decision making, and improve the success of actions and campaigns. Moreover, it can be used to develop information-based products and solutions. We consider value as a multi-dimensional construct consisting of value creation to customers (V2C) and value creation to firms (V2F). The use of big data analytics can result in both more V2C and V2F.
Notes
1 See comment by by Nassim Nicolas Taleb that big data is “bullshit” at
www.automatiseringgids.nl/nieuws/2013/41/big-data-is-bullshit (accessed September 13, 2015).
2http//pubsonline.informats.org/page/mksc/calls-for-papers
3 The former CEO disagrees and claims that he was not investing insufficiently in service and innovation: see
References
Ailawadi, K. L., Lehmann, D. R,, & Neslin, S. A. (2003). Revenue premium as an outcome measure of brand equity. Journal of Marketing, 67(4), 1–17.
Anderson, E. W., Fornell, C., & Mazvancheryl, S. K. (2004). Customer satisfaction and shareholder value. Journal of Marketing, 68(4), 172–185.
Ansari, A., & Mela, C. F. (2003). E-Customization. Journal of Marketing Research, 40(2), 131–145.
Bijmolt, T. H. A., Leeflang, P. S. H., Block, F., Eisenbeiss, M., Hardie, B. G. S., Lemmens, A., & Saffert, P. (2010). Analytics for customer engagement. Journal of Service Research, 13(3), 341–356.
Bouma, J. T., Bügel, M. S., Verhoef, P. C., Alleman, T., Wiesel, T., & Wesselius, T. (2010). Dutch customer performance index: Het nieuwe meten van klantprestaties. Tijdschrift voor Marketing, 4, 58–63.
Bult, J. R., & Wansbeek, T. J. (1995). Optimal selection for direct mail. Marketing Science, 14(4), 378–394.
Day, G. S. (1994). The capabilities of market-driven organizations. Journal of Marketing, 58(4), 37–52.
De Haan, E., Verhoef, P. C., & Wiesel, T. (2015). The predictive ability of different customer feedback metrics for retention. International Journal of Research in Marketing, 32(2), 195–206.
De Swaan Arons, M., Van den Driest, F., & Weed, K. (2014). The ultimate marketing machine. Harvard Business Review, 92(7/8), 54–63.
De Vries, L. (2015). Impact of Social Media on Consumers and Firms, Doctoral Dissertation, University of Groningen.
Farris, P. W., Bendle, N. T., Pfeifer, P. E., & Reibstein, D. J. (2010). Marketing metrics: The definitive guide to measuring marketing performance. USA: Pearson Education.
Feld, S., Frenzen, H., Krafft, M., Peters, K., & Verhoef, P. C. (2013). The effects of mailing design characteristics on direct mail campaign performance. International Journal of Research in Marketing, 30(2), 143–159.
Gijsenberg, M. J., Van Heerde, H. J., & Verhoef, P. C. (2015). Losses loom longer than gains: Modeling the impact of service crises on customer satisfaction over time. Journal of Marketing Research, 52(5), 642–656.
Discovery (pp. 21–46). USA: Morgan Kaufmann Publishers.
Hagen, C., Khan, K., Ciobo, M., Miller, J., Wall, D., Evans, H., & Yaday, Y. (2013). Big data and the creative destruction of today’s business models. Holland Management Review, 148(4), 25–37.
Hansen, M. T., Ibarra, H., Peyer, U., & Von Bernuth, N. (2013). The best-performing CEOs in the world. Harvard Business Review, 91(1/2), 81–95
Hanssens, D. M., Leeflang, P. S. H., & Wittink, D. R. (2005) Market response models and marketing practice. Applied Stochastic Models in Business & Industry, 21(4/5), 423–434. Humby, C., Hunt, T., & Phillips, T. (2008). Scoring points: How Tesco is winning customer
loyalty. Philadelphia: Kogan Page Publishers.
Korschun, D., Bhattacharya, C. B., & Swain, S. D. (2014). Corporate social responsibility, customer orientation, and the job performance of frontline employees. Journal of Marketing, 7(3), 20–37.
Kotler, P., & Armstrong, G. (2014). Principles of Marketing. USA: Pearson Education.
Kumar, V., & Shah, D. (2009). Expanding the role of marketing: From customer equity to market capitalization. Journal of Marketing, 73(6), 119–136.
Kumar, V., Aksoy, L., Donkers, B., Venkatesan, R., Wiesel, T., & Tillmanns, S. (2010). Undervalued or overvalued customers: Capturing total customer engagement value.
Journal of Service Research, 13(3), 297–310.
Leeflang, P. S. H., Verhoef, P. C., Dahlström, P., & Freundt, T. (2014). Challenges and solutions for marketing in a digital era. European Management Journal, 32(1), 1–12. Luo, X., & Bhattacharya, C. B. (2009). The debate over doing good: Corporate social
performance, strategic marketing levers, and firm-idiosyncratic risk. Journal of Marketing, 73(6), 198–213.
McGovern, G. (2007). Virgin mobile USA: Pricing for the very first time (case 9-504-208). Boston: Harvard Business School Press.
Meer, D. (2013). The ABCs of analytics. Strategy Business, 70, 6–8.
Neslin, S. A., Grewal, D., Leghorn, R., Shankar, V., Teeling, M. L., Thomas, J. S., & Verhoef, P. C. (2006). Challenges and opportunities in multichannel customer management.
Journal of Service Research, 9(2), 95–112.
Onrust, M., Verhoef, P. C., Van Doorn, J., & Bügel, M. S. (2014). When doing good leads to increased customer loyalty: Why weak firms can benefit from CSR. Working Paper, University of Groningen.
Reichheld, F. F. (1996). The loyalty effect: The hidden force behind growth, profits, and lasting value. USA: Harvard Business School Press.
Reimer, K., Rutz, O. J., & Pauwels, K. (2014). How online consumer segments differ in long-term marketing effectiveness. Journal of Interactive Marketing, 28(4), 271–284.
Reinartz, W. (2011). Presentation on customer management on Dutch customer performance awards.
Rigby, D. K., & Ledingham, D. (2004). CRM done right. Harvard Business Review, 82(11), 118–129.
Rust, R. T., Lemon, K. N., & Zeithaml, V. A. (2004). Return on marketing: Using customer equity to focus marketing strategy. Journal of Marketing, 68(1), 109–127.
Rust, R. T., Zeithaml, V. A., & Lemon, K. N. (2000). Driving customer equity: How customer lifetime value is reshaping corporate strategy. New York: The Free Press.
Srivastava, R. K., Tasadduq, A. S., & Fahey, L. (1998). Market-based assets and shareholder value: A framework for analysis. Journal of Marketing, 62(1), 2–18.
Taylor, L., Cowls, J., Schroeder, R., & Meyer, E. T. (2014). Big data and positive change in the developing world. Policy & Internet, 6(4), 418–444.
Thaler, R. H., & Tucker, W. (2013). Smarter information, smarter consumers. Harvard Business Review, 91(1), 45–54.
Van Bruggen, G. H., & Wierenga, B. (2010). Marketing decision making and decision support: Challenges and perspectives for successful marketing management support systems. Foundations and Trends® in Marketing, 4(4), 209–332.
Van Doorn, J., & Hoekstra, J. C. (2013). Customization of online advertising: the role of intrusiveness. Marketing Letters, 24, 339–351.
Venkatesan, R., & Kumar, V. (2004). A customer lifetime value framework for customer selection and resource allocation strategy. Journal of Marketing, 68(4), 106–215.
Verhoef, P. C. (2012). Klanten centraal in de bankensector. White paper, Monitoring Commissie Code Banken, the Netherlands.
Verhoef, P. C., & Langerak, F. (2002). Eleven misconceptions about customer relationship management. Business Strategy Review, 13(4), 70–76.
Verhoef, P. C., & Leeflang, P.S.H. (2009). Understanding the marketing department’s influence within the firm. Journal of Marketing, 73(2), 14–37.
Verhoef, P. C., & Lemon, K. N. (2013). Successful customer value management: Key lessons and emerging trends. European Management Journal, 13(1), 1–15.
2.1
Introduction
Value-to-customer (V2C) metrics focus on the delivered value to customers. Sometimes these metrics also refer to “share of heart” metrics or “share of mind” metrics. In essence, these metrics indeed focus on what a firm achieves in a customer’s mind and whether it results in positive cognitive and affective responses. These metrics in themselves do not reflect any value beyond what customers know and feel. However, they can indeed be linked to value-to-firm (V2F) metrics and extensive research has shown substantial effects of different V2C metrics on V2F metrics.
Market metrics
V2C market metrics are mainly relevant in the early phases of a product’s lifecycle, as different firms aim to communicate the value and relevance of newly introduced products and services. The important framework is the adoption model as proposed by Rogers (1995): he suggests that new products can be evaluated based on several dimensions: relative advantage, complexity, compatibility, observability, and trialability. In a broader sense, metrics could focus on the knowledge of products (product awareness) and beliefs, and on the value offered by products (product attractiveness and product uniqueness). These metrics are typically measured with surveys among potential customers using extensive scales. In Table 2.1.1 we show an example of how these constructs are being measured for the adoption of an online grocery channel. The validity of these dimensions has been shown frequently, and indeed customer perceptions of these advantages predict usage intentions of new product innovations (e.g., Arts, Frambach, & Bijmolt, 2011; Verhoef & Langerak, 2001).
Another frequently used model in this respect is the so-called “technology acceptance model” (TAM). This model builds on the theory of reasoned action and suggests that there are two main attitudes to be considered for new technologies: ease of use and usefulness (e.g. Davis 1989; Davis, Bagozzi, & Warshaw, 1989). This model has also been tested frequently for mainly IT-based innovations and its validity has been shown (King & He, 2006). In an online context the TAM model has been extended by including the effects of trust and perceived risk (Venkatesh & Bala, 2008).
Table 2.1.1 Example of items used to measure Rogers’ adoption drivers
Perceived relative advantage
Electronic shopping is less exciting
Using electronic shopping saves much time
Using electronic shopping makes me less dependent of opening hours
Perceived compatibility
Electronic shopping suits my person
Electronic shopping requires few adaptations in my personal life Electronic shopping yields few problems for me
Perceived complexity
Electronic shopping is complex, because I cannot feel and see the products With electronic shopping it is hard to find the needed products
With electronic shopping it is difficult to order products
With electronic shopping it is problematic to compare products Electronic shopping is complex
Intention to adoptelectronic grocery shopping
New big data market metrics
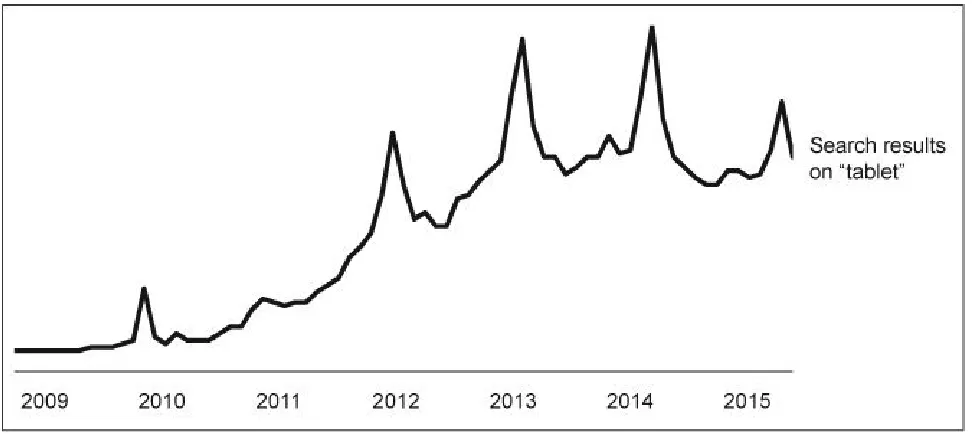
Big data developments, and specifically online conversation on products and products usage, may provide firms with a deeper understanding of how customers view and use products. Of specific use here could be statistics on the use of different search terms on search engines such as Google and Yahoo. These search terms may show initial interest in products and brands.
A tool used for this is Google trends. In Figure 2.1.1 we show the search results for “tablet” as a product over time. As one can observe, the number of search requests for tablets has increased over time, and one can also observe some peaks. New product introductions of, for example, the iPad could cause these peaks.
Brand metrics
Figure 2.1.1 Search results on “tablet” worldwide
Source: Adapted from Google trends (2015)
V2C brand metrics are frequently collected on a continuous basis. For many firms it is very important to continuously measure indicators of their brand performance and, related to that, to track the outcomes of advertising campaigns. Many research and advertising agencies around the globe, such as Young & Rubicam, have developed standard brand performance measurements. Importantly, brand metrics are collected among all customers in the market place, as firms aim to measure the position of brands relative to competing brands. This contrasts with customer metrics, which typically are measured among existing customers of a firm or brand.
Figure 2.1.2 Search interest in “big data” and “market research”
Source: Adapted from Google trends (2015)