©Universitas Bandar Lampung 2013
Analysis Web-Education Based on ISO/IEC 9126-4 for
The Measurement Quality of Use
Marzuki
#1, Agus Sukoco
#2, Lisa Devilia
#3and Maria Shusanti F.
#4 #Faculty of Computer Science, Bandar Lampung University
Jl. ZA. Pagar Alam No. 26, Labuhan Ratu, Bandar Lampung 35142, Lampung, Indonesia
1
2
(Received October 2012, Accepted June 2013)
Abstract
—
FIK UBL Website is the website of the Faculty of Computer Science education at the University of Bandar Lampung. Domain name is www.fik.ubl.ac.id. This website is a subdomain of the University website www.ubl.ac.id. website uses ac.id as Country Code Top level domains, domain primarily UBL, and Third-level domain taken Website Hosting Server at Nusanet provider. In terms of design websites using CMS, the CMS Lokomedia. Scientific Writing will specifically focus on the analysis of UBL-based FIK website ISO / IEC 9126-4 for the use of quality measurement.In this regard, in ISO / IEC 9126-4, there are 4 metrics used to measure, among other effectiveness metrics, productivity metrics, security metrics, and Satisfaction Metrics. More specific explanation will describe in Chapter IV the author of scientific writing is about the quality of the use of UBL FIK website.Keywords—Website, ISO / IEC 9126, Metrics, Effectiveness Metrics, Productivity Metrics.
1. INTRODUCTION
Today the world has known a technology called the internet.With this internet everyone can communicate with other people who are in different parts of the world. Internet has a variety of information services, one of which is presented through the Website or the World Wide Web (WWW).Website is one of the Internet resources of the fastest growing and popular.Web information is distributed through hypertext approach, which allows an approach to be a reference text for other open documents.Given this hypertext one can obtain information by leaping from one document into another document.
All information in this Internet medium is the Website. Seeing as the rapid development of the website right now, should be able to choose which websites are qualified and able to meet their information needs. Education website to provide information needed by students at the University.
Education at the university website contains information about the campus. Campus so that students can find out information simply by accessing the website only.Quality of service in the dissemination of information in the campus internet website has become a very important requirement, because it affects the level
of student satisfaction and the outside community. Ultimately improving the quality of service is an indicator of success in improving the image of college campuses in the Internet world.
Education website is a website that will be examined is FIK UBL. At the University Belfast, School of Computer Science is the only faculty who have a different faculty website of Departemen website. For that reason, building a website requires the right information and reliable.Thus, the quality of the use of faculty website can be evaluated based on ISO / IEC 9126-4 Quality Metrics Use.
ISO (International Organization for Standardization) and IEC (International Electrotechnical Commission)is a standardization organization in the world. The view of qulity of use is also consistent with the first ISO definition of usability as part of software quality in ISO/IEC 9126 [5]. Software engineering - Product Quality is an international standard for evaluating the quality of the software. The international standard is divided into 4 parts, namely the quality model (ISO / IEC 9126-1), External metrics (ISO / IEC 9126-2), Internal metrics (ISO / IEC 9126-3), and Use of Quality Metrics (ISO / IEC 9126-4). section that will be examined for the website, ISO / IEC9126-4. ISO / IEC 9126-4 Quality Metrics is the use of International Standards published by ISO and IEC to software measurement of quality of use[1]-[4].
2. MODEL, ANALYSIS, DESIGN, AND IMPLEMENTATION MODEL
2.1 Research Model
In this study will measure the website based Standard ISO / IEC9126-4 Quality Metrics Use. So that the research conducted to provide answers to questions about the quality / quality use of campus website.If these aspects in a website that quality criteria are meet, then a valuable website to meet the needs of the information has been obtained.
©Universitas Bandar Lampung 2013
safety,productivity, and satisfaction in a specified context of use of quality metrics[1]. Quality in use is not only dependent on software products, but also on the specific context in which the product is being used. Context of use is determined by a factor of user, task factors and physical and social environmental factors.Quality used is assessed by observing representative users carry out representative tasks in a realistic context of use.
In the ISO / IEC 9126-4 there were four metrics, namely:
1)
EffectivenessEffectiveness metrics measure the accuracy and completeness with the goal could be achieved.
2)
ProduvtivityProductivity measures related to the level of effectiveness achieved for the expenditure of resources. Relevant resources may include mental or physical effort, time, materials or financial cost..
3)
SafetyIt is verifier security risks associated with the operation of software products from time to time, conditions of useand context of use. Safety can be analyzed in terms of operational safety and contingency safety.Operational safety is the ability of software to meet user requirements during normal operation without jeopardizing other resources and the environment. Safety is the ability of contingency software to operate outside the normal operations and divert resources to prevent escalation risk.
4)
SatisfactionSatisfaction measures the extent to which users are free from discomfort and their attitude towards use of the product. Satisfaction can be defined and measured according to the subjective judgment on scale such as: love for products, satisfaction with the use of the product, acceptance of work load when performing different ugas t, or the extent to which a certain quality in use objectives (such as productivity or ability to learn) have been met.
2.2 Analysis of Data 1.Sample Selection Methods
Population is the complete set of entities that can be made up of people, events, or objects, which have some common characteristics. Sample is part of the population.Samples consisted of a few selected members of the population Samples can also be defined as a part drawn from the population As a result, the sample is always a smaller part of the population. Because the sample is used to represent the population studied, the sample tends to be used for research seeking to conclude the generalization of its findings.
In this study, the thresholds in the population is based on ISO / IEC 9126-4 is:
1. Users is aindividuals or organizations that use the system to perform certain functions.
2. Develop is the individual or organization who hope
development of activities, including requirements analysis, design, and testing during the cycle software life.
The sampling method used in this study is purposive sampling technique, consists of two selection methods, namely: the selection of samples based on quotas, while the study used a method / technique is based on considerations of sample selection (judgment sampling), the selection is not random that the information obtained by using certain considerations which are generally adapted to the purpose of this study and formulation of the problem.
2. Sample Selection Methods
Data collection methods used in this study, namely: 1) Observation
Observation is involves the researcher in watching,
recording and analysing events of interest’. It can, for example, involve they entering an organisation and observing the workings of that organisation within the area of interest [6].
2) Questionnaire
The questionnaire are useful means of obtaining data from a large (possible cross section) number of subjects. Like interviews they can also be undertaken at different stages of some project and can also be used for case studies [6]. Authors use this questionnaire as a data collection tool developed by the main grid predetermined.
3. Sample Selection Methods
The research variables used in this study contained within the ISO 9126-4 on the use of quality measures, namely:
1.
Effectiveness MetricsEffectiveness metrics to assess whether the tasks performed by users to achieve specified goals with accuracy and comprehensiveness in the particular context of use.
Effectiveness metrics are divided into:
a.
Effectiveness TaskSubvariabel is used to determine the proportion of the purpose of the task is accomplished correctly.In this subvariabel calculation using the method of data elements are:
M1 = | 1-ΣA i | 1
Description:
Ai = proportional value of the missing or faulty
components in the output task.
b.
Task CompletionSubvariabel is used to determine the proportion of tasks completed. In this subvariabel calculation using the method of data elements are:
©Universitas Bandar Lampung 2013 Description:
A = number of completed tasks B = total number of tasks executed
c.
Frequency ErrorSubvariabel is used to determine the frequency of errors found. In this subvariabel calculation using the method of data elements are:
X = A / T Description:
A = the number of errors made by users T = time or the number of tasks
2.3Productivity Metrics
Productivity metrics to assess the user's resource consumption in relation to the effectiveness achieved in the particular context of use.The most common resource is the time to complete the task, although other relevant resources could include business users, the use of materials or financial cost.
Productivity metrics are divided into the following:
a.
Task timeSubvariabel is used to determine the time needed to complete the task. In this subvariabel calculation using the method of data elements are:
X = Ta Description:
Ta = Time Tasks
b.
Efficiency TaskSubvariabel is used to determine how efficient use of the website. In this subvariabel calculation using the method of data elements are:
X = M1 / T Description:
M1 = The effectiveness of task T = Time task
c.
Economic ProductivitySubvariabel is used to determine cost effective in use.In this subvariabel calculation using the method of data elements are:
X = M1 / C Description:
M1 = Effectiveness Task C = Total BiayaTugas
d.
Proportion of ProductiveSubvariabel is used to determine the proportion of time when users productive action. In this subvariabel calculation using the method of data elements are: X = Ta / Tb
Description:
Ta = time = time productive tasks - time help - the error - the search
Tb = time task
e.
Relative User EfficiencySubvariabel is used to determine how efficiently the user compared to the expert. In this subvariabel calculation using the method of data elements are:
Relative User Efficiency X = A / B Description:
A = Efficiency of Common User Tasks Task B = Efficiency Expert Users
2.4Security Metrics
Security metrics to assess the level of risk of harm to people,software, business property,or the environment in a particular context is used.These include health and safety of both users and those affected by the use, as well as physical or economic consequences are not desirable.
Security metrics are divided into the following: a. Health and Safety Users
Subvariabel is used to determine the health problems of the user while using the website. In this subvariabel calculation using the method of data elements are: X = 1 - A / B
Description:
A = the number of users who report health problems B = total number of users
b. Safety of people affected by the use of the system Subvariabel is used to determine the incidence of air hazard to persons affected when using the system. In this subvariabel calculation using the method of data elements are:
X = 1 - A / B Description:
A = the number of people affected by hazards B = total number of people potentially affected by the system
c. Economic Damage
Subvariabel is used to determine the economic damage. In this subvariabel calculation using the method of data elements are:
X = 1 - A / B Description:
A = number of occurrences of economic damage B = total number of use
d. Damage to software
Subvariabel is used to determine the occurrence of software defects. In this subvariabel calculation using the method of data elements are:
X = 1 - A / B Description:
A = number of occurrences of software malfunction B = total number of situations of use
2.5Satisfaction Metrics
©Universitas Bandar Lampung 2013
Satisfaction is influenced by user perceptions about the nature of software products (as measured with an external metric) on the efficiency, productivity, and safety in use.
Satisfaction metrics are divided into the following:
a.
Satisfaction ScaleSubvariabel is used to determine the satisfaction of the user.
In this subvariabel calculation using the method of data elements are:
X = A / B Description:
A = scale psychometric questionnaires produce B = the average population
b.
Satisfaction QuestionnaireSubvariabel is used to determine the user satisfaction of the features of the software.In this subvariabel calculation using the method of data elements are: X = Σ(A i)/ n
Description:
A i = responses to questions
n = number of responses
c.
Wisdom In UseSubvariabel is used to determine the proportion of potential users choose to use the system. In this subvariabel calculation using the method of data elements are:
X = A / B Description:
A = the amount of use of the software used
B = the number of users expected to use the software.
2.6
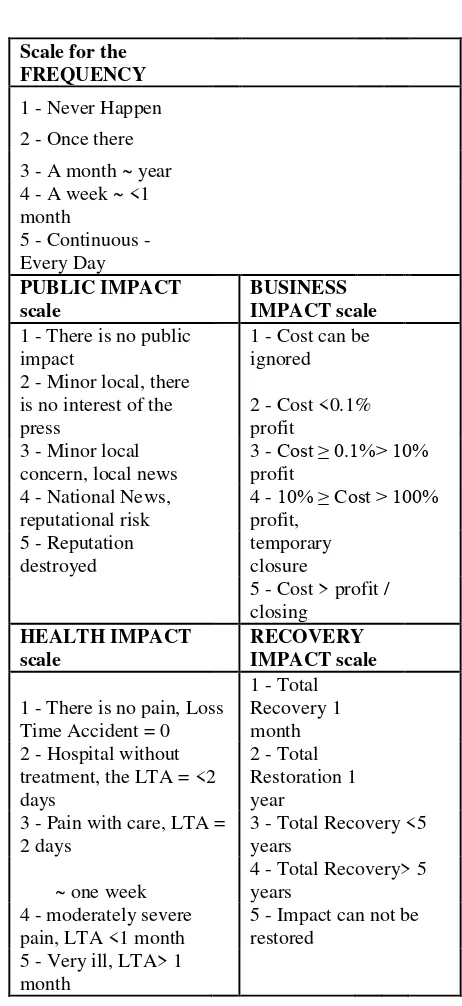
Measurement ScaleIn the study has two types of scales.These scales are scales for the measurement of the questionnaire and observation.The questionnaire study using a scale that can be expressed using an ordinal scale is 1-9. Scale was translated into a level that is, a low level 1-3, 4-6 to Medium level, and a High Level 7-9.While the observation of this study using a scale for frequency, Public Impact, Business Impact, Impact of Health, and the Impact of Recovery in Table 1.Measurement scale of observation.
TABLE 1.MEASUREMENT SCALE OBSERVATIONS
Scale for the
FREQUENCY
1 - Never Happen
2 - Once there
3 - A month ~ year
4 - A week ~ <1
month
5 - Continuous -
Every Day
PUBLIC IMPACT
scale
BUSINESS
IMPACT scale
1 - There is no public
impact
1 - Cost can be
ignored
2 - Minor local, there is no interest of the
press
2 - Cost <0.1%
profit
3 - Minor local
concern, local news
3 - Cost ≥ 0.1%> 10% profit
4 - National News, reputational risk
4 - 10% ≥ Cost > 100% profit,
5 - Reputation
destroyed
temporary
closure
5 - Cost > profit / closing
HEALTH IMPACT
scale
RECOVERY IMPACT scale
1 - There is no pain, Loss Time Accident = 0
1 - Total Recovery 1
month
2 - Hospital without treatment, the LTA = <2 days
2 - Total Restoration 1
year
3 - Pain with care, LTA = 2 days
3 - Total Recovery <5 years
~ one week
4 - Total Recovery> 5 years
4 - moderately severe pain, LTA <1 month
5 - Impact can not be restored
5 - Very ill, LTA> 1
month
©Universitas Bandar Lampung 2013
TABLE 2. RISK LEVEL OBSERVATION
FREQUENCY LEVEL
Every Day (5) M M H H H
Once a week (4) M M M H H
Once in 2 years
(3) L M M H H
To occur (2) L L M M H
It Never
Happened L L M M M
IMPACT
Insigni
ficant
(1)
Minor
(2)
Moderate
(3)
Major
(4)
Catas
Trophic
(5)
III. DATA ANALYSIS OF QUESTIONNAIRE RESULTS
The research will be conducted by distributing questionnaires sample of 12 people.This questionnaire will examine the effectiveness metrics, Productivity, and Satisfaction of the website.
a.
Effectiveness metricsInside there are 4 questions Effectiveness Metrics. Each question has a level and then compared the results of the statistics will get the final level for effectiveness metrics. 1. The question "is there any component or feature of
the website that is not appropriate while running?"
Fig. 1.Percentage Graph User Response Questionnaire Question 1
Based on Fig. 1, shows 41.67% said Low, Medium 25% answered, and 33.33% said High. Therefore, the percentage level through the most answered by the respondents is low.
2. Question "how many time you run a website?"
Fig. 2.Percentage Graph User Response Questionnaire Question 2
Based on Fig. 2, shows 58.33% said Low, Medium 25% answered, and 16.67% said High.Therefore, the percentage level through the most answered by the respondents is low.
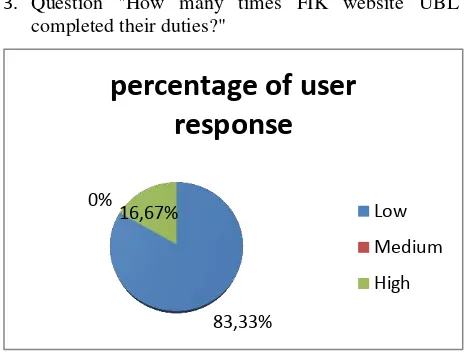
3. Question "How many times FIK website UBL completed their duties?"
Fig 3.Grafik image User Response Questionnaire Question 3
Based on Fig. 3, shows 83.33% said Low, no respondents who answered at the Medium level, and 16.67% said High.Therefore, the percentage level through the most answered by the respondents is low.
41,67%
25% 33,33%
percentage of user
response
Low
Medium
High
58,33% 25%
16,67%
percentage of user
response
Low
Medium
High
83,33% 0%
16,67%
percentage of user
response
Low
Medium
©Universitas Bandar Lampung 2013
4. Question "how many times you make a mistake when accessing the website?"
Fig. 4.Percentage Graph User Response Questionnaire Question 4
Based on Fig. 4, shows 66.66% said Low, Medium 16.67% answered, and 16.67% said High.Therefore, the percentage level through the most answered by the respondents is low.
Metrics on the effectiveness of the four questions contained therein, all result in low levels.Therefore, the end result of the effectiveness of metrics is Low Level.
b.Productivity Metrics
Productivity metrics contained within the 3 questions. Each question has a level and then compared the results of the statistics will get the final level for productivity metrics.
1. Question "How long website to complete the task?"
Fig. 5 Percentage Graph User Response Questionnaire Question 5
Based on Fig. 5, shows 16.67% said Low, Medium 66.66% answered, and 16.67% said High.Therefore, the percentage level through the most answered by the respondents is Medium.
2. Question"whether you are a current cost to access the website?"
Fig.6 Percentage Response Graphic User Questionnaire Question 6
Based on Fig. 6, shows 83.34% said Low, Medium 8.33% answered, and 8.33% said High.Therefore, the percentage level through the most answered by the respondents is low.
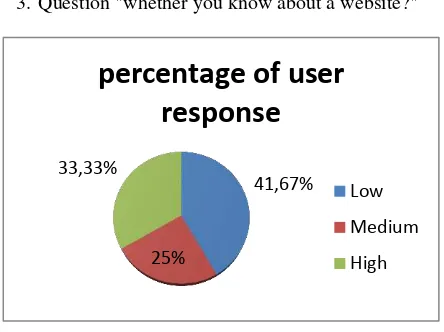
3. Question "whether you know about a website?"
Fig. 7 Percentage Response Graphic User Questionnaire Question 7
Based on Fig. 7, shows 58.33% said Low, Medium 41.67% answered, and no respondents who answered at the High level.Therefore, the percentage level through the most answered by the respondents is low.
On productivity metrics from three questions contained in it, one question has the Medium and 2 Low-level questions produce.Therefore, the final results of the Level Low productivity metrics.
c.
Satisfaction metricsSatisfaction metrics contained in the first question that the level of questions is the result of the final level for satisfaction metrics.
The question "Are you satisfied with the components or features of the website?"
66,66% 16,67%
16,67%
percentage of user
response
Low
Medium
High
16,67%
66,66% 16,67%
percentage of user
response
Low
Medium
High
83,34% 8,33%
8,33%
percentage of user
response
Low
Medium
High
41,67%
25% 33,33%
percentage of user
response
Low
Medium
©Universitas Bandar Lampung 2013
Fig.8 Percentage Response Graphic User Questionnaire Question 8
Based on Fig. 8, shows 33.34% said Low, Medium 58.33% answered, and 8.33% said High.Therefore, the percentage level through the most answered by the respondents is low.On a question of productivity metrics contained in the question has the Medium.Therefore, the end result of productivity metrics is the Medium Level.
TABLE 3.
LEVEL ANALYSIS OF QUESTIONNAIRE RESULTS
Metriks Level
Effectiveness L Productivity L Satisfaction M
3.2 Data Analysis of Observations
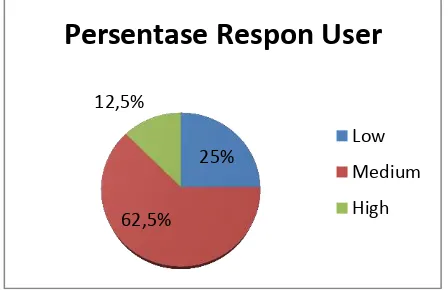
After the observation at the Security metrics, produced the same final level as the final level in the questionnaire, namely the level of Low, Medium, and High.The results of each level of risk inherent in the observation of the security metrics yield percentage of 25% Low risk, Medium risk of 62.5%, and high risk as much as 12.5%.Therefore, security metrics have the final level is Medium, which has a medium risk of 62.5%.
Fig.9 Graph of Percentage of Observations
3.3Merging Data Analysis of Questionnaire Results and Observations
After analyzing the results of questionnaires and observations, the results were combined to produce measurement results website based on ISO / IEC 9126-4 Quality Metrics Use.
TABLE 4 USE OF WEBSITE QUALITY MEASUREMENT RESULTS
Quality Use of
Characteristics Scale High/Medium/Low
Effectiveness L
Productivity L
Security M
Satisfaction M
3.4Implications of Research
Implications of Research is planning a study in the future so as to provide a basis for further research.This study has implications for the 3 (three) main aspects, namely: the managerial aspects, aspects of the system and further research aspects.
a.
Managerial AspectsWith a faculty of management research is expected to utilize the results of this research by improving the quality of use of website based on ISO / IEC 9126-4 in order to improve the quality of use of the website.
b.
Aspects of the systemThe quality of website should be improved, so as to provide convenience to the user or student who uses this website.
c.
Aspects of Advanced StudiesIn the next study is expected to examine website based on ISO / IEC other series. So the quality of website will get better and are in accordance with ISO Standards.
IV. RESULT
Data obtained from the results of this study is qualitative data.Qualitative data was obtained from the questionnaire responses from the user and developer respondents in this study website and the observations made by the author.The research was carried out to respondents who have a variety of activities on the system running.Respondent is an actor who portrayed the Use Case Diagram
25%
62,5% 12,5%
Persentase Respon User
Low
Medium
©Universitas Bandar Lampung 2013 V. CONCLUSION
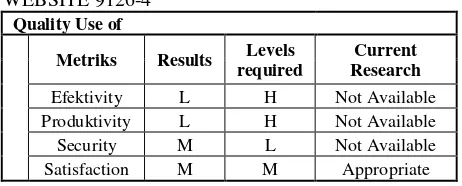
After analyzing the results of questionnaires and observations, the results were combined and compared to the levels required in the standard ISO / IEC 9126-4.
TABLE 5. RESEARCH RESULTS BASED ON UBL WEBSITE 9126-4
Quality Use of
Metriks Results Levels required
Current Research
Efektivity L H Not Available
Produktivity L H Not Available
Security M L Not Available
Satisfaction M M Appropriate
Based on the overall study produced some important findings in the conclusions that can be formulated as follows:
1.
The effectiveness of metrics in the study produced low levels, while the level required is high.So that the results of research on the state website Effectiveness Metrics are not in accordance with ISO / IEC 9126-4.2.
Productivity metrics in the study produced low levels, while the level required is high. So that the results of research on the state website Productivity Metrics are not in accordance with ISO / IEC 9126-4.3.
Security metrics in the study produces Medium level, whereas it takes is a Low Level.So that the results of research on the state website Productivity Metrics are not in accordance with ISO / IEC 9126-4.4.
Satisfaction Metrics in the study produce medium level, while the required level is Medium.So that the website states Research Metrics Satisfaction in accordance with ISO / IEC 9126-4.5.
4 Metrics Standards of ISO / IEC 9126-4, only one standard metrics that correspond to ISO / IEC 9126-4 based on the use of quality measurement research website.VI. RECOMMENDATION
As for recomendation that can be delivered by the author are:
1.
By looking at these results, UBL FIK website should be improved so as to meet the standards of ISO / IEC 9126-4.2.
For the components of the website are not appropriate FIK UBL should be repaired so that the quality of use of the website better.REFERENCES
[1] 9126-4: Software Engineering – Software Product Quality - Part 4: Quality In Use Metrics. 2001. Canada: ISO/IEC
[2] 9126-3: Software Engineering – Software engineering –Product quality – Part 3: Internal metrics. 2002. Canada: ISO/IEC. [3] 9126-2: Software Engineering – Software engineering –Product
quality – Part 2 - External Metrics. 2001. Canada: ISO/IEC. [4] 9126-1: Software Engineering – Software engineering –Product
quality – Part 1: Quality model. 2000. Canada: ISO/IEC. [5] Bevan, Nigel. (2009). Extending Quality in Use to Provide a
Framework for Usability Measuremen, Proceedings of HCI International, San Diego, California, USA.
