CHAPTER IV
RESEARCH FINDING AND DISCUSSION
In this chapter, the writer presented the data which had been collected from the research in the field of study. The data were the result of synonym context clue and reading comprehension, the result of data analysis, and interpretation.
A. Data Presentation
In this part, the writer presented the obtained data of the students’
synonym context clue and reading comprehension test scores of the class that was being sample of this study.
1. Distribution of synonym context clue
The synonym context clue test had been conducted on Thursday, September, 29nd 2016 at 09.00-11.10 in class B, of IAIN Palangka Raya with the number of students was 15 students. The synonym context clue test consisted of the instruction and statement the subjects addressed in their synonym context clue. the result illustrated in table 4.3
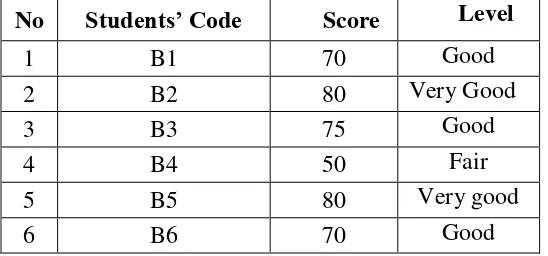
Table. 4.1 The description of Synonym context clue test scores of the data achieved by the students of the sample class.
No Students’ Code Score Level
1 B1 70 Good
2 B2 80 Very Good
3 B3 75 Good
4 B4 50 Fair
5 B5 80 Very good
6 B6 70 Good
7 B7 80 Very good
8 B8 65 Fair
9 B9 70 Good
10 B10 70 Good
11 B11 80 Very good
12 B12 85 Very good
13 B13 70 Good
14 B14 45 Fair
15 B15 60 Good
TOTAL 1050
Average 70,00 Higherst Score 85
Lowerst score 45
Here, the criteria of synonym context clue in level as following : 0 until 19 Very poor
20 until 39 Poor 40 until 59 Fair 60 until 79 Good 80 until 100 Very Good
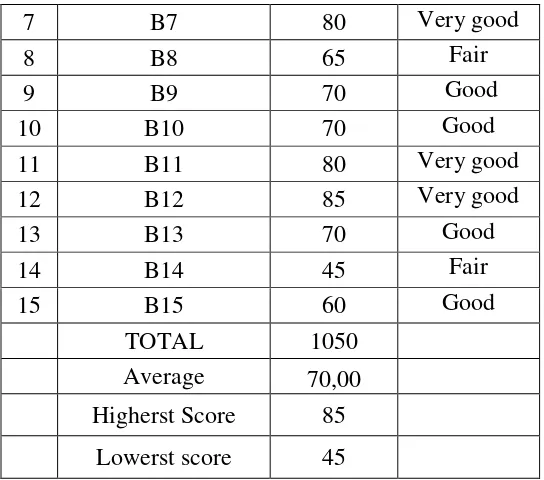
Table 4.2 the calculation of mean, median, mode, and standard deviation of the synonym context clue test scores of the sample class using
SPSS 16 program. Statistics Synonym context clue
Statistics
SynonymContextClues
N Valid 15
Missing 0
Mean 70,0000
Std. Error of Mean 2,92770
Mode 70,00 Std. Deviation 11,33893
Variance 128,571
Range 40,00
Minimum 45,00
Maximum 85,00
Sum 1050,00
Percentiles
25 65,0000
50 70,0000
75 80,0000
The calculation above shows the mean value was 70,0000, std error of mean value was2,92770, median value was 70,0000, mode value was 70,00, std Deviation 11,33893, Variance value was 128,571, Range value was 40,00, Minimum value was 45,00, Maximum value 85,00, and the last sum value was 1050,00.
2. Distribution of reading comprehension scores
The test had been conducted on Thursday, September, 29nd 2016 at 09.00-11.10 in class B. The test consisted of 40 items. The test divided into reading comprehension test and synonym context clue test. Reading comprehension test was 20 items and synonym context clue test was 20 items.
The students’ reading comprehension scores of the sample class of the
study were presented in the following table.
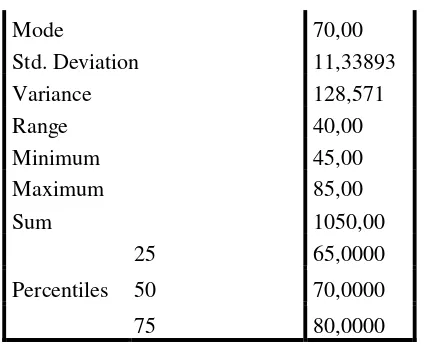
Table. 4.3 The description of reading comprehension test scores of the data achieved by the students of the sample class.
NO Students’ Code Score Level
1 B1 70 Good
3 B3 55 Fair
4 B4 60 Good
5 B5 45 Fair
6 B6 45 Fair
7 B7 50 Fair
8 B8 30 Poor
9 B9 50 Fair
10 B10 60 Good
11 B11 40 Fair
12 B12 55 Fair
13 B13 30 Poor
14 B14 65 Good
15 B15 65 Good
TOTAL 785
Average 52,33
Higherst Score 70 Lowerst score 30
Here, the criteria of reading comprehension in level as following : 0 until 19 Very poor
20 until 39 Poor 40 until 59 Fair 60 until 79 Good 80 until 100 Very Good
Table 4.4 The calculation of mean, median, mode, and standard deviation of the reading comprehension test scores of the sample class using
SPSS 16 program. Statistics
Reading Comprehension Statistics
ReadingComprehension
N Valid 15
Missing 0
Mean 52,3333
Std. Error of Mean 3,23179
Mode 65,00 Std. Deviation 12,51666
Variance 156,667
Range 40,00
Minimum 30,00
Maximum 70,00
Sum 785,00
Percentiles 25 45,0000
50 55,0000
75 65,0000
From the SPSS Program, the result showed that the mean was 52,3333, and std. Error of mean to was 3,23179and that the median was 55.0000, and the mode was 65.00a, Std. Deviation the was 12,51666, the was Variance 156,667, the Range was 40.00, and the minimum and maximum 30.00 and 70.00, and the last sum 785.00.
B. Result of Data Analysis
In the Result of Data Analysis was measured Testing of Normality, Homogeneity, and Linearity,
1. Testing of Normality, Homogeneity, and Linearity
The writer calculated the result of reading comprehension and synonym context clue test of the sample class by using SPSS 16.
First step was testing the normality. It was used to know the normality of the data that was going to be analyzed whether both groups have normal distribution or not.
same variant or not. The last step was testing linearity to know whether the variables were correlated linearly or not.
a. Testing Normality
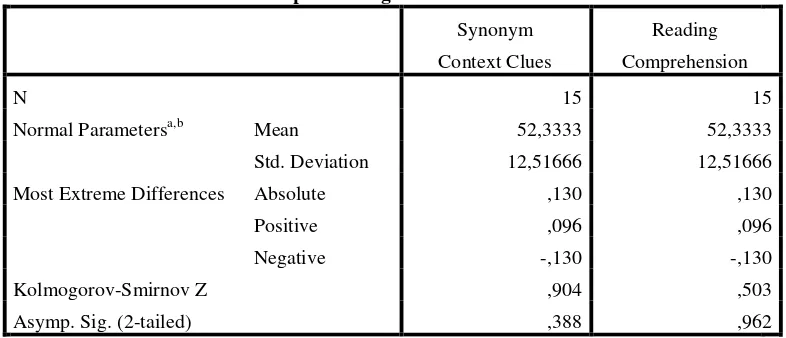
Table 4.5 Testing of Normality One-sample kolmogorov-smirnov Test.
One-Sample Kolmogorov-Smirnov Test
Synonym
Context Clues
Reading
Comprehension
N 15 15
Normal Parametersa,b Mean 52,3333 52,3333
Std. Deviation 12,51666 12,51666
Most Extreme Differences Absolute ,130 ,130
Positive ,096 ,096
Negative -,130 -,130
Kolmogorov-Smirnov Z ,904 ,503
Asymp. Sig. (2-tailed) ,388 ,962
a. Test distribution is Normal.
b. Calculated from data.
Based on the calculation using SPSS 16 program, the asymptotic significant normality of the data of the students’ reading comprehension and synonym context clue score were 0.503 and 0.904, Then the normality both of the data were consulted with the table of Kolmogorov-Smirnov with the level of significance 5% (a=0.05). Since asymptotic significant of reading comprehension = 0.503and asymptotic significant of synonym context clue = 0.904≥ a = 0.05, it could be concluded that the data were in normal distribution.
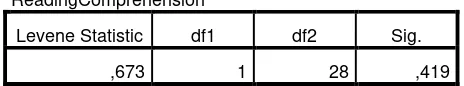
b. Test of Homogeneity of Variances
Test of Homogeneity of Variances
ReadingComprehension
Test of Homogeneity of Variances
ReadingComprehension
Levene Statistic df1 df2 Sig.
,673 1 28 ,419
Based on the result of homogeneity test, the Fvalue was 0.673 and the
significant rvalue was 0.419. The data were homogeneous if the significant rvalue
was higher than significant level a= 0.05. Since the significant rvalue(0.673) was
higher that significant level a= 0.05, it could be concluded that the data were homogeneous. It meant that both of classes were in same variants.
c. Testing Linearity
Table 4.6 Testing Linearity Regression.
ANOVA
ReadingComprehension
Sum of Squares Df Mean Square F Sig.
Between Groups 2340,833 1 2340,833 16,413 ,000
Within Groups 3993,333 28 142,619
Total 6334,167 29
Based on the result of linearity test, the Fvalue was 16.413and the
significant Fvalue was 0.000. The variables were correlated linearly if the
significant Fvalue was 0.000. Since the significant Fvalue(0.000) was significant
level, it could be concluded that the variables were correlated linearly. 2. Testing Hypothesis
The correlation students’ reading comprehension scores and Synonym
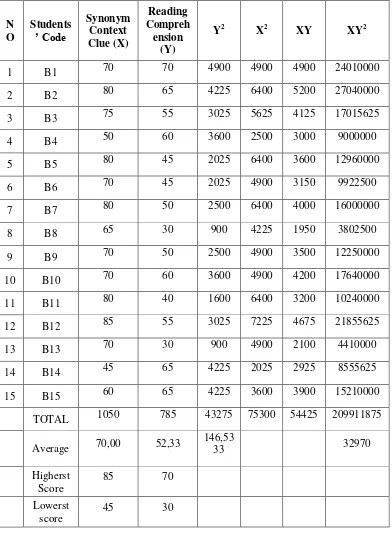
Table. 4.7 The description of reading comprehension and synonym context clue test scores of the data achieved by the students of the sample
class. N O Students ’ Code Synonym Context Clue (X) Reading Compreh ension (Y)
Y2 X2 XY XY2
1 B1 70 70 4900 4900 4900 24010000 2 B2 80 65 4225 6400 5200 27040000 3 B3 75 55 3025 5625 4125 17015625 4 B4 50 60 3600 2500 3000 9000000 5 B5 80 45 2025 6400 3600 12960000 6 B6 70 45 2025 4900 3150 9922500 7 B7 80 50 2500 6400 4000 16000000
8 B8 65 30 900 4225 1950 3802500
9 B9 70 50 2500 4900 3500 12250000 10 B10 70 60 3600 4900 4200 17640000 11 B11 80 40 1600 6400 3200 10240000 12 B12 85 55 3025 7225 4675 21855625 13 B13 70 30 900 4900 2100 4410000 14 B14 45 65 4225 2025 2925 8555625 15 B15 60 65 4225 3600 3900 15210000
TOTAL 1050 785 43275 75300 54425 209911875
Average 70,00 52,33
146,53
33 32970
Higherst Score
85 70
Lowerst score
The writer used Pearson product moment correlation calculation with the significant level of the refusal of null hypothesis a= 0.05. The writer calculated by using manual calculation and also SPSS16 program to test the hypothesis using Pearson product moment correlation. The criteria of ha was accepted when tobseved>ttable and ho was rejected when tobserved<ttable.
a. Testing hypothesis using manual calculation
To find out the correlation between synonym context clue and reading comprehension of the sample class, the writer used the person product moment correlation formula as follows:
𝑟𝑥𝑦 = 𝑁 𝑥𝑦 − 𝑥 . ( 𝑦)
{𝑁 𝑥2 − 𝑥 2} [𝑁 𝑦2]− 𝑦 2 ]
𝑟𝑥𝑦 = 15 . 54425− 1050 . (785)
15 . 75 300− 1050 2} 15 . 43275− 785 2
𝑟𝑥𝑦 = 816375−824250
(1129500− 1102500) (649125−616225
= (7875)
(27000)(32900)
7875 888300000
7875 29804.3621
Based on the manual calculation above, it was found that the rvalue
was 0,26422307 .Then the rvaluewas consulted with the table of the interpretation
coefficient correlation r as follows:
Table 4.8 The Interpretation Coefficient Correlation r. Interval Coefficient Level of Correlation
0,80 - 1,000 Very High
0,60 - 0,799 High
0,40 - 0,599 Fair
0,20 – 0,399 Poor
0,00 – 0,199 Very Poor
From the table of the interpretation coefficient correlation above, it can be seen that the rvalue(0.26422307)was at the level “poor” correlation. So it meant
that the correlation between synonym context clue and reading comprehension of the sample class was in poor correlation.
The result of the calculation that was counted by product moment above showed that the index of correlation was 0.26422307. Then, the degree of freedom with formula, as follow :
df = N-nr it was known : N = 15, nr = 2 df= 15-2= 13
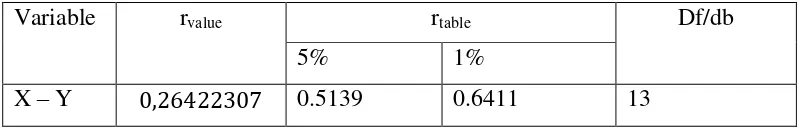
Table 4.9 The result of manual calculation
Variable rvalue rtable Df/db
5% 1%
The next step was calculating the contribution. To know the contribution between both of variables (X and Y), coefficient determination formula was used as calculated below:
𝐾𝑃= 𝑟2𝑥 100
𝐾𝑃= 0,264223072𝑥 100%
𝐾𝑃= 0.6981383𝑥 100%
𝐾𝑃= 69.81383%
Where
KP = Determinant coefficient value r = Correlation coefficient value
The calculation above showed that the synonym context clue (Variable X) gave about 69.81383%positivecontribution to the reading comprehension (Variable Y) of the sample class and 30.18617 % was influenced by other aspects.
The reject or accept hypothesis, this study calculated tvalue as follow:
𝑡 = 𝑟 𝑛 −2 𝑟 1− 𝑟2
Where:
t = the significant correlation
r = the correlation between two variables
𝑡 =𝑟 𝑛 −2 1− 𝑟2
𝑡 = 0,26422307 15−2 1−0,264223072
𝑡 = 0,26422307 13 1−0.6981383
𝑡 =0,26422307 𝑥 3.60555128 0.3018617
𝑡 =0.95266983 0.54941942
𝑡 = 1.783395733
The criteria of the test was if t observed> t table. Ha was accepted. It meant
there was significant correlation. If t observed> t table Ho was rejected. It meant that
was no significant correlation between variables. Based on the calculation above t
observed was 1.783395733. Next, to know df or degree of freedom used formula
Df= N- 2 15-2 = 13 and t table was 1.771 at significance level 5% and 2.650 at
significance level 1%.
The result of the ttest used manual calculation, it was found the tobserved was
grater in level 5%, but in 1% the result was lower than t observed. The result was
1.771 <1.783395733 <2.650.
Based on the result of hypothesis test manual calculation, it was found that the value of tvalue was grater in level 5%, but in 1% the result was lower than t
and Ho was rejected and the synonym context clue gave significant contribution to reading comprehension of sample class in level of correlation was poor.
So, there was a significant correlation between synonym context clue and reading comprehension in level “poor” correlation third semester students of English study program students of IAIN Palangka Raya. On the other hand, It meant that students’ whose high synonym context clue score uncertain poor in
reading comprehension score. Meanwhile, the students’ whose lack of synonym context clue score was unsure high in reading comprehension score too. The correlation was in level “poor” correlation.
b. Testing Hypothesis using SPSS Program
The writer applied SPSS 16 program to calculate the Pearson Product Moment correlation in testing hypothesis of the study which the result also supported the result of manual calculation. The result of the test using SPSS 16 Program can be see as follow:
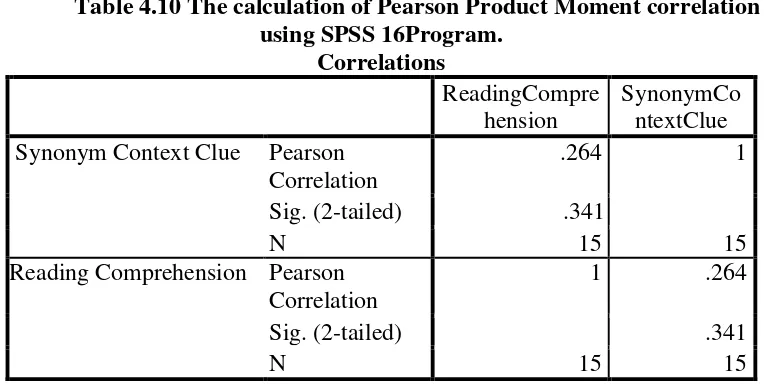
Table 4.10 The calculation of Pearson Product Moment correlation using SPSS 16Program.
Correlations
ReadingCompre hension
SynonymCo ntextClue Synonym Context Clue Pearson
Correlation
.264 1
Sig. (2-tailed) .341
N 15 15
Reading Comprehension Pearson Correlation
1 .264
Sig. (2-tailed) .341
N 15 15
rvalue= 0.264 was lower than rtable = 0.5139 at df 13 at the significant level of 5%
and 0.6411 at df 15 at the significant level of 1% as explained in the table below:
Table 4.11 The calculation of Pearson Product Moment correlation using SPSS 16 Program.
Variable rvalue
rtable
Df/db
5% 1%
X – Y 0,264 0.5139 0.6411 13
Descriptive Statistics
Mean Std. Deviation N Synonym Context Clue (X) 70.0000 11.33893 15 Reading Comprehension(Y) 52.3333 12.51666 15
From the result above, there was the mean of X value (synonym context clue) from 15 students was 70,0000. The standard deviation was 11,33893. Meanwhile, the mean of Y value (reading comprehension) from 15 students was 52,3333. The standard deviation was 12,51666.
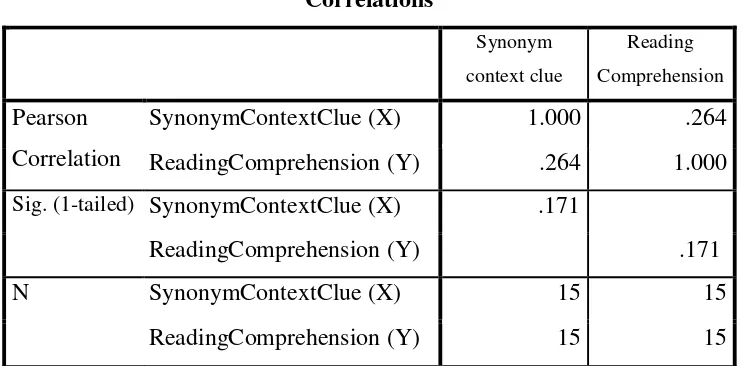
Correlations
Synonym
context clue
Reading
Comprehension
Pearson Correlation
SynonymContextClue (X) 1.000 .264 ReadingComprehension (Y) .264 1.000 Sig. (1-tailed) SynonymContextClue (X) .171
ReadingComprehension (Y) .171
N SynonymContextClue (X) 15 15
From the result above, there was the poor correlation between variable of X value was 0,264. It meant that it is the negative correlation. The correlation value of reading comprehension and synonym context clue was 0,171. It meant that it was negative correlation.
Variables Entered/Removedb
Model Variables Entered Variables Removed Method
1 Synonymcontextcluea . Enter
a. All requested variables entered
b. Dependent Variable: Reading comprehension
From the table above, it showed that the value of reading comprehension and synonym context clue was entered. Meanwhile, the variable showed that no one variable removed.
Model Summaryb
Model
R R Square
Adjusted R
Square
Std. Error of
the Estimate
1 ,264a ,070 -,002 12,52753
a. Predictors: (Constant), Synonymcontextclue
b. Dependent Variable: Readingcomprehension
From the table above, the X value was 0.070, that the result from square of coefficient of correlation was (0.624)2 = 0.389376.The standart error of the estimeted was 12,52753.
ANOVAb
Model Sum of Squares Df Mean Square F Sig.
Residual 2040,208 13 156,939
Total 2193,333 14
a. Predictors: (Constant), Synonymcontextclue
b. Dependent Variable: Readingcomprehension
Hypothesis: Ho = X = Y = 0
the result above, it interpreted :
1. If F observed < or = F table. the probability of 0.05 higher than Ho was accepted.
2. If F observed > F table. the probability of 0.05 lower than Ho was rejected. From the table above. It showed that f observed was 0,976. Meanwhile the f table of df value residual was 13 as the df. The f table from the df13 was 0.5139. Because f observed was 0.976> 0.5139. It meant that Ha was accepted.
Coefficientsa
Model
Unstandardized
Coefficients
Standardized
Coefficients T Sig.
B Std. Error Beta
1 (Constant) 72,750 20,921 3,477 ,004
Synonymcontextclue ,292 ,295 ,264 ,988 ,341
a. Dependent Variable: Readingcomprehension
Residuals Statisticsa
Minimum Maximum Mean Std. Deviation N
Predicted Value 47,9583 59,6250 52,3333 3,30719 15
Std. Predicted Value -1,323 2,205 ,000 1,000 15
Std. Residual -1,899 1,410 ,000 ,964 15
a. Dependent Variable: Readingcomprehension
The residual from the distribution was normal, it meant that the data was spreaded in the around the line. It showed that from the picture above, the data spreaded was normal. It meant that the normality was accepted.
To conclude, it meant that synonym context clue gave significant contribution to the reading comprehension of sample class. So, there was a significant correlation between synonym context clue and reading comprehension at third semester students of English study program students of IAIN Palangka Raya. On the other hand, It meant that students’ whose high synonym context clue
score uncertain poor in reading comprehension score. Meanwhile, the students’ whose lack of synonym context clue score was unsure high in reading comprehension score too.
The hypothesis testing was measured by using Pearson Product Moment correlation to measure the significant correlation between synonym context clue and reading comprehension in the level poor of correlation. Based on the result of manual calculation, it can be concluded that the rvalue was lower than the rtableat 5%
and 1% significant level or 0.5139 >0.26422307< 0.6411.It meant Ha was accepted and Ho was rejected. Furthermore, the result of calculation using SPSS 16 Program found that there was a poor correlation between students’ synonym context clue and reading comprehension. It proved by the value of rvalue was lower
than the rtable at 5% and 1% significant level or or 0.5139 >0.264< 0.6411. It can
be interpreted based on the result of calculation that alternative hypothesis stating that there is a significant positive correlation between synonym context clue and reading comprehension of at third semester students of English study program students of IAIN Palangka Raya was accepted and the null hypothesis stating that there is no a significant positive correlation between synonym context clue and reading comprehension of at third semester students of English study program students of IAIN Palangka Raya was rejected. It meant that students’ whose high synonym context clue score uncertain poor in reading comprehension score. Meanwhile, the students’ whose lack of synonym context clue score was unsure
high in reading comprehension score too.
C. Discussion
students of English study program students of IAIN Palangka Raya. It meant that the students whose correct answer much in synonym context clue, they did not got high score of reading comprehension test and the students whose lack of synonym context clue score, they did not got low score of reading comprehension test. Product Moment correlation, it was found that the rvaluewas 0.264 and the rtable
was 0.6411. It meant that rvalue<rtable.
To support the result of testing hypothesis, the writer also calculated the hypothesis using SPSS 16 Program. The result of the analysis showed that students’ whose high synonym context clue score uncertain poor in reading
comprehension score. Meanwhile, the students’ whose lack of synonym context clue score was unsure high in reading comprehension score too. It was proved by the value of rvalue= 0.264 was lower than rtable= 0.5139 at df 15 at significant level
of 5% and 0.6411. At df 15 at the significant level 1%.
The findings of the study indicated that alternative hypothesis stating that there is a significant positive correlation between synonym context clue and reading comprehension of at third semester students of English study program students of IAIN Palangka Raya was accepted and the null hypothesis stating that there is no a significant positive correlation between synonym context clue and reading comprehension of at third semester students of English study program students of IAIN Palangka Raya was rejected. It meant that students’ whose high synonym context clue score uncertain high in reading comprehension score. Meanwhile, the students’ whose lack of synonym context clue score was unsure
poor correlation, so there was a poor correlation between the students’ synonym context clue and reading comprehension. On the other hand, when the synonym context clue increased, the reading comprehension decreased at the same time. Meanwhile, when the synonym context clue decreased, the reading comprehension increased at the same time.
These findings were suitable with the theories as stated that: First, The most prominent way students learn words incidentally is through the use of context clues (Beck and McKeown, 1991; Beck et al., 2002)1. Using synonym context clues was possible got high score in reading comprehension. But, many aspects that made synonym context clue were impossible got high score in reading comprehension. For example, the aspect about the items was related between synonym context clue and reading comprehension items.
Context clues are defined as words found around an unknown word that provides clues that reveal the meaning of the unknown word (Beck et al., 2004). The context in which a word is used can often pro-vide clues that can help students determine a word’s meanings from written context.2
Nash and Snowling (2006) concluded that improving ability to infer meanings from written context leads to increases in vocabulary knowledge, which in turn leads to improvements in reading comprehension.3
1
AlirezaKarbalaei, FatemehAzimiAmoli and Mohammad Mehdi Tavakoli. The effects of explicit teaching of context clues at undergraduate level in EFL and ESL context.
European Online Journal of Natural and Social Sciences 2012; ISSN 1805-3602 www.european-science.com vol.1, No. 3, pp. 68-77.Department of English, Farhangian University, Nasibe Branch, Tehran, Iran; Department of English, Ilam University, Iran; Department of English, Technical and Vocational University, ValiasrCollege,Tehran, Iran. Received for publication 20 November 2012. Accepted for publication 08 December 2012.
Further, Yuen (2009) explored the use of con-text clues to gain knowledge of new vocabulary words during reading. Context clues strategies taught during intervention included locating ap-positives, searching for explicit definitions, and using prior knowledge.4
From the items of reading comprehension, based on Jane Ervin the reading comprehension test devide into :Story elements, Literal comprehension questions,Recalling the main idea and details, Sequencing, Matching vocabulary words with meanings, Responding to reading passages, Vocabulary development, Extending thoughts in writing,and Inference.5 Here, there are many aspect that influent in reading comprehension test. In this study, the test was possible used Literal comprehension questions, inferential, Matching vocabulary words with meanings, and Responding to reading passages. It was impossible in correlation between synonym context clue and reading comprehension in text. The synonym context clue items were impossible to help the reading comprehension items, or the contrary.
The reading comprehension by Jane Ervin devided into :Early Reading Comprehension : About the Passage, Put the Sentences in the Correct Order, Match the Words with Their Meanings– asks students to match vocabulary from the passage with its meaning, Reason for Reading, Thinking It Over – asks two to three broad questions that students must answer with a complete sentence, and Using the Words– encourages students to use vocabulary from the passage in a
4
Ibid
5
Jane Ervin.Reading Comprehension in Varied Subject Matter Grades 2–11. Program
paragraph.6In this study, the writer adopted the test by TOEFL “test strategies” by Barron’s book. The test devided into determine the main idea, to recall literal
information from the passage, Match the Words with Their Meanings and to the reader and activates prior knowledge.
Context clues are hints that the author gives to help define a difficult or unusual word. The clue may appear within the same sentence as the word to which it refers, or it may follow in a preceding sentence. Because most of vocabulary is gained through reading, it is important that you be able to recognize and take advantage of context clues. It could be assumed that the students’ vocabulary stock gave much contribution in their context clue. The students with large vocabulary performed comparably with the students with much smaller vocabulary in context clue. They could arrange the words into sentences to make them meaningful and understandable.
Bailey in Using Context Clues to Improve Reading Comprehension, the finding was Context clues can help many people with dyslexia to compensate for weak reading skills when comprehending reading passages. Context clues significantly increase reading comprehension in chapter II, page 10.7 It meant that to make a communication, reading comprehension is also a process of using reader’s existing knowledge to text in order to construct the meaning. But, it was
6
Jane Ervin.Reading Comprehension in Varied Subject Matter Grades 2–11. Program
overview.Build literal and inferential comprehension skills with reading selections across the content areas. ESP Literacy and Invention.
7
Eileen Bailey.
http://www.readingrockets.org/article/using-context-clues-understand-word-meanings. Copyright © 2015 WETA Public Broadcasting Submitted by marilyn d rosal
uncertain the synonym context clue items helped the reading comprehension items.