PAPER • OPEN ACCESS
The Implementation Internet of Things(IoT)
Technology in Real Time Monitoring of Electrical
Quantities
To cite this article: D Despa et al 2018 IOP Conf. Ser.: Mater. Sci. Eng. 335 012063
View the article online for updates and enhancements.
Related content
Wearable Sensors: GUI-based software development for sensor data collection, data extraction and data analysis using Python frameworks
S C Mukhopadhyay and T Islam
-Design and Implementation of Effective Electrical Power System for Surya Satellite-1
A H Sulistya, W Hasbi and R Muhida
-Studies on Tribological Behavior of Aluminum Nitride-Coated Steel
-The Implementation Internet of Things(IoT) Technology in
Real Time Monitoring of Electrical Quantities
D Despa1*, G.F Nama2, M.A Muhammad2, K Anwar1
1
Department of Electrical Engineering, University of Lampung, Indonesia 2
Department of Informatics Engineering, University of Lampung, Indonesia
Abstract. Electrical quantities such as Voltage, Current, Power, Power Factor, Energy, and Frequency in electrical power system tends to fluctuate, as a result of load changes, disturbances, or other abnormal states. The change-state in electrical quantities should be identify immediately, otherwise it can lead to serious problem for whole system. Therefore a necessity is required to determine the condition of electricity change-state quickly and appropriately in order to make effective decisions. Online monitoring of power distribution system based on Internet of Things (IoT) technology was deploy and implemented on Department of Mechanical Engineering University of Lampung (Unila), especially at three-phase main distribution panel H- building. The measurement system involve multiple sensors such current sensors and voltage sensors, while data processing conducted by Arduino, the measurement data stored in to the database server and shown in a real-time through a web-based application. This measurement system has several important features especially for real-time monitoring, robust data acquisition and logging, system reporting, so it will produce an important information that can be used for various purposes of future power analysis such estimation and planning. The result of this research shown that the condition of electrical power system at H-building performed unbalanced load, which often leads to drop-voltage condition
1. Introduction
Electricity is an important component for any organization,the electricity quality should be always monitored. University of Lampung (Unila) very concern to perform evaluation ofelectricity services, especially at Department of Mechanical Engineering Unila. Various policy have been made including the addition of power supply, installation system repairs.However, these efforts did not provided maximum results without being followed by maintaining the quality of theelectricity itself, because in reality the amount of electricitytends to change as a result of changes in the load or the powersupply itself. These changes should be identified immediatelyin order to anticipate the consequences that may occur to the system.
and monitored data online by utilizing the internet network facilities that are already available in University. The proposed of this research is to implementing the Internet of Things (IoT) technology in field area of electrical quantities monitoring to provide an useful information to operators, and if there any abnormal condition, then the mitigation and prevention can be done quickly.
2. Literature Review
2.1. Related works
Monitoring of electrical energy consumption, room temperature, and internet network bandwidth has been done on previous work [1], unfortunately Gigih et all in this research only provides information on the magnitude of electrical energy consumption by capturing voltage and current values, while the value of other electrical quantities did not proposed. In the other work [2], Despa et all has succeeded created a prototype system that can monitor the quantity of electricity in a 3-phase electric power panel using BCM2835 Single Board Computer. In this research, the electrical quantities that can be monitored were not only electrical energy consumption, it also included voltage, current, power, power factor. The measurement process uses current sensors and voltage sensors. Current sensors used a type of sensor that mounts in series circuit with electrical systems that are at risk of disrupting the electrical system performance in case of damage to the sensor [2].
The researcher on works [1,2] then continued their research and focus to refine the prototype described in [2]. The use of current sensors was no longer installed serially and high risk impact to the system, but uses a safer current transformer type. However, in this paper, the real-time report was not provided, in the other hand the display function and data processing was still offline, another disadvantages, theprototype described in paper was still using two embedded system (single board computer BCM2835 and Arduino) which is not efficient economically [3]. Despa et all on work [4] has created a simple prototype of a system of electrical monitoringin 3-phase electrical power panels using only Arduino. The electrical quantities that can be monitored was focused on voltage, current, power, and power factor. The measurement data was stored in to MySQL database and displayed on the web. This monitoring system is the main reference in this study which has some drawbacks, such as the absence of some important parameters of electrical power like frequency of the system and energy consumption [4], whereas those values are very important to be considered in term of electrical system reliability and estimation. Some previous research related to implementation of Internet of Things technology can be found on works [5,6,7].
2.2. Electrical Quantities
The current can be defined as the transfer of charge through a conductor. The total amount of charge passing through a random cross-section of a material per second is defined as ampere [8] and can be written as follows:
(2.1)
where Q is the symbol of charge measured in the coulomb (C), I is the current in amperes (A) and t is the time in seconds (s). An electric current can also be defined as the charge through a point in an electrical circuit, written as:
(2.2)
A constant electric current is known as a direct current or DC denoted by symbol I, while an electric current that changes with time is known as an alternating current or AC is represented by the symbol i or i (t). Voltage is defined as the energy required to move the electrical charge between two points [9] expressed as :
where V is the symbol of the voltage measured in volts (V), and dw is the energy in joule (J). Further, the relationship between current and voltage by George Simon Ohm known by Ohm's law [10], can be expressed as:
(2.4)
where R is the symbol of the resistance in ohm (Ω). Equation 2.4 can be used in analysis of electrical circuits, both in power systems with direct current and alternating current, which contain only resistive circuit elements. For circuits containing inductive (L) and capacitive (C) elements, equation 2.4 could not be applied. In a circuit containing elements L and C, the relation between current and voltage is expressed by the following equation: between power, current, and voltage is expressed as follows:
(2.8)
In alternating current power system, known three kinds ofpower, namely: apparent power or complex power is the result of multiplication of voltage phasor (V) and conjugate of electric current (I *). The unit of apparent power is expressed in Volt Ampere (VA). The active power or the real power of the Watt (W) unit, is the power fully absorbed by the resistive loads, while the reactive power of the Reactive Volt Ampere (VAR) unit is the power absorbed by the reactive (inductive and capacitive) loads stored in the form Electric field and electric charge [11]. Reactive power flow causes the phase of the electric current to shift preceding (leading) or lagging (lagging) from the phase voltage. This phase difference of voltage to voltage is called power factor (cos θ). The relationship between active power, reactive power, current, voltage, and power factor is indicated by the following equations:
(2.9)
(2.10) Where θ is the symbol of the phase shift in units of degrees (º).
2.3. Monitoring System
Monitoring system is a system that plays an important role in the management of electric power system. The development of embedded system also increased rapidly, ranging from the development of a conventional regulatory system where each sub-system (substations) requires an operator, computer-based regulatory system where the conventional system can be monitored centrally from a distance, and the last is an Integrated regulatory system where the sub system does not require any more operator which means the operator function is taken over completely by the control center device [12,13].
group, effective operation and measurement of critical quantities and transmits the measurement results to the control center.
2.4. Data Acquisition
Data acquisition is a process of sampling a signal by measuring the real world physical condition and converting the resulting sample into a digital numerical value that can be manipulated by a computer [14]. The basic elements of Data Acquisition (DAQ) include:
1. Sensor and transducer 2. Signal conditioning
3. Analog to Digital Converter (A / D)
Transducers can be used to detect different physical phenomena such as movement, electrical signals, radiation energy, thermal energy, magnetic, or mechanical energy. Transducer is used to convert one type of energy to another. Usage The type of input or output of the transducer depends on the type of signal being detected or the process being controlled. Devices with input functions are called sensors with the function of detecting physical events that change according to some parameters like heat or pressure. While the device with the output function is called the actuator. Transducers and sensors are used to convert physical phenomena into electrical signals (voltage or current) which are then converted into digital signals used for subsequent stages such as computers, digital systems, or storing in memory [15].
2.5. Internet of Things
Internet of things (IoT) is a network set that consist of physical devices, and other electronics embedded system, software, sensors, actuators, and network connectivity which enable these environment to collect and exchange data. IoT is also well known as a global infrastructure for some information society, enabling advanced information services by interconnecting (both physical and virtual) things based on existing and involving interoperable information and communication technologies [16].
The IoT will allows any objects to be sensed or controlled remotely wherever there any existing network infrastructure, creating opportunities for integration of the real world into computer-based systems, to intend in improved efficiency, accuracy, and economic benefit in addition to reduced human intervention [17,18]. When IoT is augmented with complex sensors and actuators, the technology will becomes an instance general class of cyber-physical systems, which also overwhelm other technologies such smart grids, virtual power plants, smart homes, intelligent transportation and smart cities.
Figure 1 shown that a physical thing may represented in the information world by one or more virtual things, but a virtual thing can also exist without any associated physical thing. A device is a piece of equipment with mandatory capabilities of communication and optional capabilities for sensing, actuation, data capture, data storage, and data processing. The devices plays a role to collecting various information and provide it to the information/communication networks for further advance processing [13].
3. Research Methodology
3.1. System Design
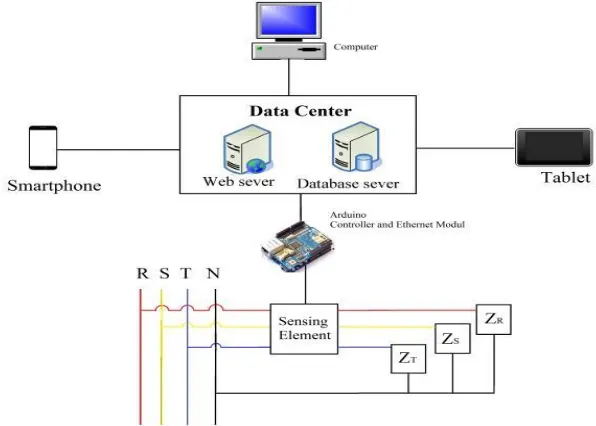
This research proposed a system that can monitor the amount of electricity in a three-phase distribution panel by utilizing the Internet network as a means of sending data. Figure 2 shows the structure diagram of the developed system.
Figure 2. Structure diagram of online monitoring of distribution power system based Arduino and internet network
3.2. Hardware Design
The hardware consist of a voltage sensor which used a combination of voltage transformer and resistive voltage divider, a current sensor combined with current transformer and burden resistor, a signal conditioning circuit used an offset enhancer and a comparator where Arduino and Arduino- Ethernet-shield were used as main controller. Figure. 3, 4, 5, 6 shown the schematic wiring diagram of several sensor that be used on this research.
Figure 5. Structure diagram for signal conditioning of voltage and current sensor output.
Figure 6. Structure diagram of sinus - square signal converter.
3.3. Software Design
The software in this research was developed using several programming languages, such as C programming language, PHP, HTML, and Javascript. The program on the Arduino uno controller board was designed for gathering the input from of the sensor, calculates the voltage, current, active power, apparent power, power factor and frequency of the power system, and sends the data to the server. The program was built by using the Arduino IDE (C programming language). The value of energy consumption was obtained from the calculation process on the server. This process was done by assuming the measured power is constant in the measurement range time.
4. Results and Discussion
4.1. Measurement Device Testing
To ensure that the designed system provide valid information, then before the system applied, the testing process was conducted in the Laboratory of Electrical Quantities Measurement, Electrical Engineering Department, University of Lampung (UNILA) by using standard laboratory measuring instruments.Shown on Table 1 and 2, are the data obtained based ontesting process whivch consist of hardware, software, and measurement accuracy testing.
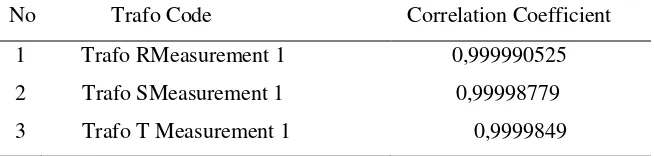
Table 1. Results of V-T correlation coefficient test on measurement devices 1 and measurement devices 2
No Trafo Code Correlation Coefficient
1 Trafo RMeasurement 1 0,999990525
2 Trafo SMeasurement 1 0,99998779
Table 2. Results of CT correlation coefficient test on measurement devices1 and measurement devices 2
No CT Code Correlation Coefficient
1 CT R Measurement 1 0,999965
2 CT S Measurement 1 0,999938
3 CT T Measurement1 0,999938
Based on Table 1 and Table 2 it shown that all voltage transformers and current transformers used have correlation coefficient values greater than 0.999. This indicates that this device has a good linearity and suitable for use as a sensor.
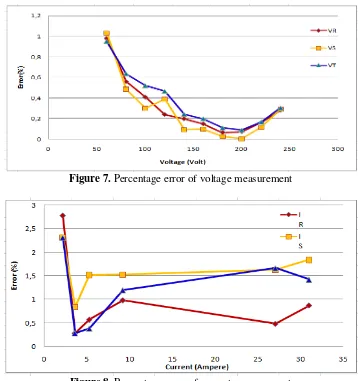
Figure 7. Percentage error of voltage measurement
Figure 9. Percentage error of power measurement
Figure 10. Percentage error of power factor measurement
Figure 11. Percentage error of frequency measurement
4.2. Online Monitoring of Electrical Quantities Applied atMechanical Engineering Dept Power Panels, UNILA
Electrical quantities online monitoring has been done in power distribution panel located in Building H Faculty of Engineering UNILA. Figure 12 untill 17 are the results of monitoring within a period of one week starting on Friday, July 21, 2017 at 09.10 WIB until Friday, July 28, 2017 at 09.10 WIB
Figure 12. Voltage profile at power distribution panel of Building H Mechanical Engineering Unila 21 July 2017-28 July 2017
Figure 12 describes the fluctuates of voltage value on power panel. It can be seen that a considerable drop voltage was happened in the time span at 08.00 WIB until 17.00 WIB for every day, except on 22 and 23 July. The voltage drop occurs during working hours, due to the large number of electrical loads such as air conditioners, computers, and other equipments. While starting in the afternoon until the morning and on weekends, the use of the load is reduced, so the voltage would back to its normal condition.
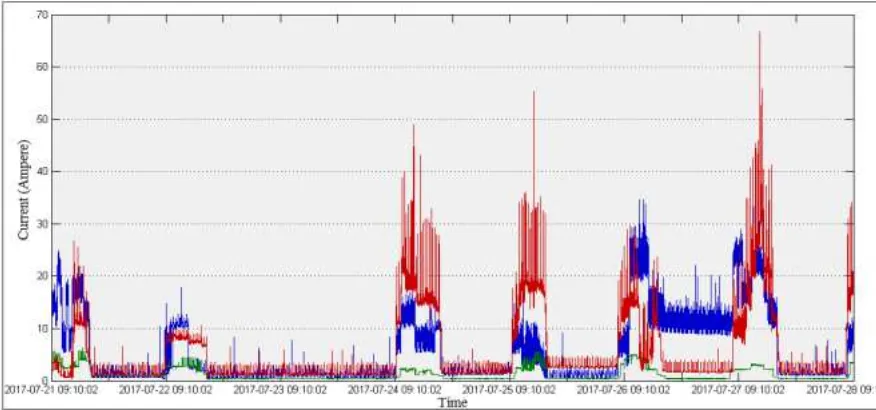
As the same case like the voltage shown in Figure 13, the current value also fluctuates. The current value will increase during working hours except holidays. This illustrates that the use of electrical energy is tends to during work hours. In addition, the important thing to note is that the current values between phases have considerable differences as a result of unbalanced loads. The load tends to accumulate on one phase which in this case is the phase R. This case means that in the future, No load is able to be connected to the phase R anymore.
Figure 14. Power profile at power distribution panel of Building H Mechanical Engineering Unila 21 July 2017-28 July 2017
The graph in Figure 14 is an image of the power value. It appears that the pattern look ssimilar to the current profile described infigure 13.Thisshows that the power value is proportional to the current change. But the change is not always linear with current changes, because it is also influenced by the value of power factor.
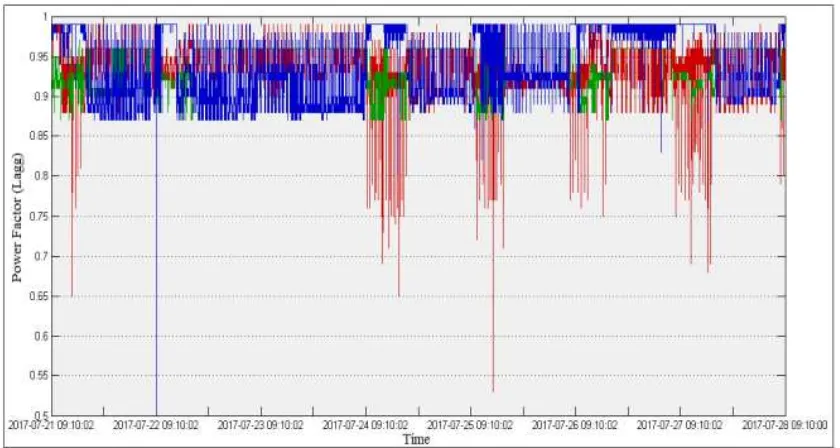
It shown on Figure 15 that the power factor also fluctuates. The observed value is still within the allowed range, even tends to be good
Figure16. Energy consumption profile at power distribution panel of Building H Mechanical Engineering Unila 21 July 2017- 28 July 2017
Figure 16 describes the amount of energy consumption. Based on the figure above, The magnitude of energy consumption has a considerable difference, this illustrates that there is an imbalance in the distribution of one-phase load.
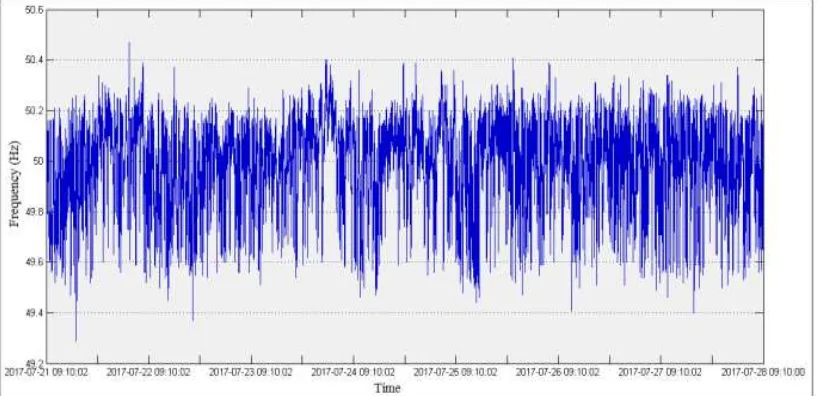
Figure 17. Frequency profile at power distribution panel of Building H Mechanical Engineering Unila 21 July 2017- 28 July 2017
Figure 17 shows the fluctuation of frequency in the H building of Mechanical Eengineering power panels. it can be understood because the load is changing at any time, besides this fluctuation is not only due to load changes in the measured panels only, but also the influenced by other loads.
5. Conclusion
as the result of uneven load installed for each phase, and also due to the working hour pattern in the H building Department of Mechanical Engineering which is still tends to be done during the day (working hours). Forthe future work, monitored and recorded data in server should be utilized for estimation and future improvement of electrical power system
Acknowledgement
Author would like to express gratitude to The Ministry of Research, Technology and Higher Education Indonesia and Unversity of Lampung, who have facilitated and supported this research.
References
[1]. G.F.Nama, M.Komarudin, H.Priambodo, Mardiana,H.D. Septama, 2014. Electricity, Temperature, and Network Utilization Monitoring at Lampung University Data Centre Using Low Cost Low Power Single Board Mini Computer. In The Regional Conference on Computer and Information Engineering (RCCIE), Yogyakarta Indonesia, pp 184-189.
[2]. D.Despa, A.Kurniawan, M.Komarudin, Mardiana, G.F.Nama, 2015. Smart monitoring of electrical quantities based on single board computer BCM2835, 2nd International Conference on Information Technology, Computer, and Electrical Engineering (ICITACEE)
[3]. D.Despa, Mardiana, G.F.Nama,M.Bernard, 2016. Multi-Area Smart Monitoring of Electrical Quantities Based on Mini Single Board Computer BCM 2835. 8th International Conference on Electrical Power, Electronics, Communications, Controls and Informatics System 2016 (EECCIS 2016), Malang.
[4]. D.Despa, M.A.Muhammad, H.Gusmedi, N.Amaro. 2017. Sistem Monitoring Besaran Listrik Dengan Teknologi IoT (Internet of Things). Bandar Lampung
[5]. G.F.Nama, D.Despa, Mardiana, 2016. Real-time monitoring system of electrical quantities on ICT Centre building University of Lampung based on Embedded Single Board Computer BCM2835, International Conference on Informatics and Computing (ICIC), Lombok, Indonesia. [6]. G.F.Nama, M.Ulvan, A.Ulvan, A.M.Hanafi, 2015. Design and Implementation of Web-Based Geographic Information System for Public Services in Bandar Lampung City - Indonesia, 2015 International Conference on Science in Information Technology (ICSITech), pp 270-275, Yogyakarta, Indonesia.
[7]. G. F. Nama, M. Komarudin, H.D. Septama. 2015. Performance Analysis of Aruba TM Wireless Local Area Network Lampung University, 2015 International Conference on Science in Information Technology (ICSITech), pp 41-46, Yogyakarta, Indonesia.
[8]. N.Wasif, Concepts in Electric Circuits. 2008.Ventus Publishing ApS. Bookboon.com [9]. S.Sudaryanto, Analisis Rangkaian Listrik Jilid1, 2012.Bandung: Darpublic.
[10]. R.J.Fowler, Electricity Principle&Applications.2008.New York: McGraw-Hill. [11]. C.Cekmas,T.Barlian, Rangkaian Listrik, 2013. Jakarta: ANDI
[12]. W.Allen, B.F.Wollenberg. Power Generation, Operation, and Control, 1996. New York: JohnWiley&Sons,Inc.
[13]. T. Cegrell. Power System Control Technology, 1986. Prentice Hall Company. [14]. T.H. Rosemary, Data Acquisition for Sensor System, 1997. London: Chapman &Hall. [15]. E.M.Paolo, Data Acquisition System, 2013. Newyork: Springer.com.
[16]. V.Ovidiu, F.Peter. Internet of Things: Converging Technologies for Smart Environments and Integrated Ecosystems,2013. Aalborg, Denmark, Rivers Publishers.
[17]. S. Gérald. The Internet of Things: Between the Revolution of the Internet and the Metamorphosis of Objects. European Commission Community Research and Development Information Service. Retrieved August 2017.
![Figure 1. Technical overview of the IoT [13]](https://thumb-ap.123doks.com/thumbv2/123dok/3994699.1938119/5.595.96.488.551.744/figure-technical-overview-iot.webp)