Article
http://ijfac.unsri.ac.id
DOI: 10.24845/ijfac.v2.i2.39 39
Study on Quality of Water from Various Resources of Tidal Zonetaken on Dry Season at Muliasari
Village Tanjung Lago District
Indah Hamida1, Robiyanto Hendro Susanto2, PoedjiLoekitowati Hariani3*
1
Student at Environmental Management Program, Graduate Program, UniversitasSriwijaya, Padang Selasa, Bukit Besar Palembang, 30139
2
Soil Science Department, Faculty of Agriculture, UniversitasSriwijaya, InderalayaOganIlir, 30662
3Chemistry Department, Faculty of Mathematics and Natural Science,UniversitasSriwijaya,Inderalaya,
OganIlir, 30662
*Corresponding Author: [email protected]
Abstract
Contamination by organic matters, nutrient, pathogenic bacteria, micro pollutant and detergent/surfactant caused quality decrease of water in tidal zone. This study was aimed to evaluate quality of various water resources and to elaborate correlation between tidal environment condition and water resources quality at Muliasari village district of Tanjung Lago. Water sample was taken by purposive sampling method. Analysis result using Storet method showed average value of several parameters at high tide are: temperature 31.37°C;TSS 74.28 mg/L;pH 3.38; salinity 1.82; DO 5.05 mg/L; BOD 32.51 mg/L; COD 98.5 mg/L; ammonia 0.29 mg/L; phosphate 0.1690 mg/L; Fe 0.272 mg/L and Coliform 0.31/100 mg/L. At low tide these parameters had values for temperature 27.13°C; TSS 67.14 mg/L; pH 3.38; salinity 1.7; DO 4.86 mg/L; BOD 14.13 mg/L; COD 43.71; ammonia 0.244 mg/L; phosphate 0.1695 mg/L; Fe 0.232 mg/L and Coliform 0.32/100 mg/L. According to Governor’s provision no.16/2005 on water quality standard, water from various resources of Muliasari village were moderately polluted. Domestic waste water management is needed at this area followed by training and enhance occupant’s awareness to maintain hygiene and environment quality. Monitoring effort is also necessary on water resources quality for at least once every 6 months.
Keywords:Water quality, tidal zone, domestic waste
Abstrak (Indonesian)
Article Info
Air yang terkontaminasibahanorganik, nutrient, bakteripatogen, mikro polutan dan detergen/ surfaktan menyebabkan menurunnya kualitas suatu perairan. Penelitian ini bertujuan untuk mengkaji kualitas berbagai sumber air, mengkaji hubungan kualitas lingkungan daerah pasang surut terhadap kualitas berbagai sumber air di desa Muliasari Kecamatan Tanjung Lago. Penelitian ini merupakan penelitian survei. Pengambilan sampel air dilakukan dengan metode
purposive sampling. Hasil penelitian menunjukkan bahwa kualitas air di desa Muliasari berdasarkan analisis dengan menggunakan metode storetmaka diperoleh nilai rata-rata suhu pasang (31,370C) surut (27,130C). TSS pasang (74,28 mg/L) surut (67,14 mg/L). pH pasang (3,38) surut (3,38). Salinitas pasang (1,82) surut (1,7). DO pasang (5,05 mg/L) surut (4,86 mg/L). BOD pasang (32,51 mg/L) surut (14,13 mg/L). COD pasang (98,5 mg/L) surut (43,71 mg/L). Amonia pasang (0,29 mg/L) surut (0,244 mg/L). Fosfat pasang (0,1690 mg/L) surut (0,1695 mg/L). Fe pasang (0,272 mg/L) surut (0,232 mg/L). Coliform pasang (0,31/100 mg/L) surut (0,32/100 mg/L). Status mutu air di desa Muliasari berdasarkanPeraturanGubernurSumsel No.16 Th. 2005 tentang baku mutu air masuk dalam kategori cemar sedang. Berdasarkan hasil tersebut maka perlu adanya pengelolaan limbah domestic, sosialisasi dan pelatihan kesadaran masyarakat untuk menjaga kebersihan, dan upaya pemantauan kualitas air sungai paling sedikit 1 kali dalamsetiap 6 bulan.
Keywords: kualitas air, pasangsurut, limbahdomestik
Received 4 March 2017 Received in revised 19 May 2017
DOI: 10.24845/ijfac.v2.i2.39 40 INTRODUCTION
Water is the most important environmental component for human life. It is needed by mostly living organism on its living process on earth [1]. Poor quality of water can trigger many problems to human. Clean and provide in enough quantity of water on the other hand are something to be expected by community to fulfill daily needed and other activities. Among the activities need enough clean water are manufactures, city sanitation and crops fields.
Low quality of water caused decrease in life support of environment and ecosystem to human and other creatures in the area. It will affect directly to the safety and healthstatus especially for human being. Low quality of water also reduced productivity, decrease its capacity to provide resources and eventually decrease the ability of natural to provide resources. Contamination by organic matters, nutrient, pathogenic bacteria, micro pollutant and detergent/surfactant came from domestic waste are believe to be responsible for dropping quality of water [2]. In order to evaluate the quality of water from various resources and its correlation to tidal zone environmental condition, research was conducted at Muliasari village of Tanjung Lago district. This study was aimed to provide insight and new approach of environmental management in the area to fulfill domestic needed on water.
MATERIALS AND METHODS
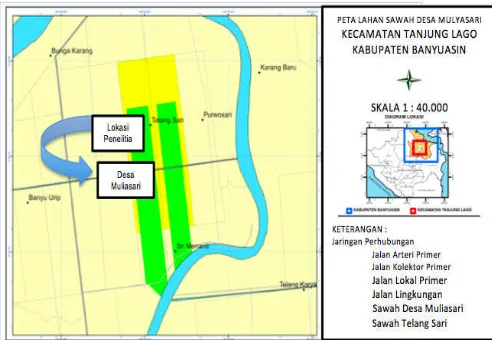
Research was conducted on May until July 2016 at Primary channels, Secondary channel SPD, Tertiary channel and pond located at Muliasari Village. Samples
were taken from 7 different stations at the village namely; station 1 (primary channel), station 2 (SPD canal at tertiary channel 2), station 3 (tertiary channel 2), station 4 (pond at tertiary channel 2), station 5 (SPD canal at tertiary channel 6), station 6 (tertiary channel 6) and station (pond at tertiary channel 6).
Figure 1. Research location maps at Muliasari Village Tanjung Lago District (Source:Agriculture and Animal
Husbandry Bureau, Banyuasin Districts, 2014)
Data was gathered by using survey method combined with chemical analysis in laboratory. Water sample was taken by purposing sampling method i.e. sample location was picked up intentionally. Research station and location coordinate point were depicted on Table 1:
Tabel 1 Stations and research location coordinate point at Muliasari village Tanjung Lago district
Station Position
Latitude (South) Longitude (East)
Station 1(Primary channel) 2039’59.3” 104044’08.6” Station 2(SPD canal at TC 2) 2038’37.3” 104044’32.9” Station 3(Tertiary channel 2) 2038’22.4” 104044’31.1” Station 4(Pond at TC 2) 2038’36.9” 104044’35.4” Station 5(SPD canal at TC 6) 2038’07.1” 104044’29.2” Station 6(Tertiary channel 6) 2038’14.3” 104044’30.5” Station 7(Pond at TC 6) 2038’11.2” 104044.30.1”
Table 2. Classification of water quality according to Storet method
No Class Score Status Remark
1 Class A 0 Very good Fulfill threshold
2 Class B -1 s/d -10 Good Lightly polluted
3 Class C -11 s/d -30 Moderate Moderately polluted
4 Class D ≥ -30 Bad Heavily polluted
DOI: 10.24845/ijfac.v2.i2.39 41 Table 3Scoring system to determined water quality status
Sample amount
Score
Parameter
physic chemistry biology
< 10 Source: Provision of Ministry of Environmental no. 115/2003
Water quality measurement was carried out in situ and ex situ (BTKL laboratory Palembang). Physical parameters being determined were temperature whereas chemical parameters were pH, salinity, DO, BOD, COD, TSS, ammonia, phosphate and Fe. Coliform was the only biological parameter being identified. All measurements were done twice at low and high tide events.
Conclusion on water quality status was confirmed according to Storet method by comparing water quality data with quality standard threshold provisioned by Ministry of Environmental no. 115/2003 and South Sumatera Governor no. 16/2005. Class of water quality status was determined based on classification system by US-EPA (Environmental Protection Agency). According to the system, water quality was divided into 4 classes (Table 2). Scoring on water quality was made based on measurement results on physical, chemical and biological properties as depicted in Table 3.
RESULT AND DISCUSSION
Water quality concern with its properties, organisms contained and other components confined. Water quality determine quantitatively using several
parameters including temperature, pH, salinity, DO, OD, COD, TSS, ammonia, phosphate, Fe and Coliform. Result of samples measurement compare with water quality threshold for water taken from river provisioned by authority was displayed on figures below.
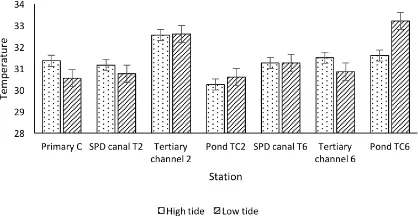
Average Temperature
Average temperature detected on the water during high tide was between 30.25-32.55°C whereas during low tide was between 30.55-33.2°C. Aquatic organism is able to survive only within certain temperature range. If water temperature goes too far from forbearance range, it can compromise the ability of organism to survive. Sunlight radiation is the main factor that influence water temperature. Significant contribution also provided by rock, sand and mud condition at the tidal zone. Temperature in 7 locations of research at high and low tide are represent on Figure 2.
According to quality threshold provided by Governor’s provision no. 16/2005, water temperature on high and low tide at Muliasari Village still fulfill temperature range between 25°C-35°C as required.
DOI: 10.24845/ijfac.v2.i2.39 42 Figure 3. TSSanalysis result on soils at high and low tide
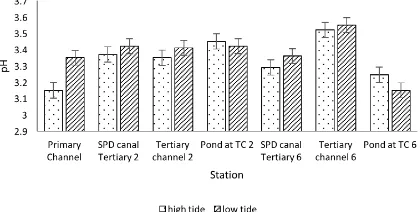
Figure 4. Result of pH measurement on water at high and low tide, Muliasari Village
Figure 5. Salinity measurement result at high and low tide of Muliasari VillageTanjung Lago District
DOI: 10.24845/ijfac.v2.i2.39 43 Figure 7. BOD analysis result at high and low tide of MuliasariVillageTanjung Lago District
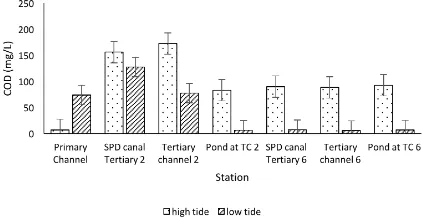
Figure 8. COD analysis result at high and low tide of Muliasari VillageTanjung Lago District
Figure 9. Result ofammonia analysis at high and low tideMuliasariVillage Tanjung Lago District
DOI: 10.24845/ijfac.v2.i2.39 44 Figure 11. Fe analysis result of water at high and low tide Muliasari Village
Figure 12. Coliformresult of analysis on water samples at high and low tide, Muliasari Village
Total Suspended Solid
Total suspended solid related to water turbidity which comprise of mud, fine sand and microorganism. Result of TSS measurement is display on Figure 3. Average value obtained for this parameter is 30-130 mg/L at high tide and 20-170 mg/L at low tide. Highest value of TSS at high tide was found at station 2 (SPD canal at Tertiary 2) and lowest value was detected at station 1 (Primary channel). At low tide, highest TSS value was found at station 1 (Primary channel) whereas lowest TSS was found out at station 5 (SPD canal at Tertiary 6).
High TSS value correspond to human activities such as farming, livestock, toilet and bathing. Increase of turbidity in water are directly influenced by high TSS contained. Suspended matters contaminated causedturbid water [3]. Suspended matters can be organic such as biomass, microorganism and inorganic such as clay and dust [4]. Turbidity due to high TSS might hampered sunlight penetration which is important for metabolism of organisms. Result of TSS measurement also appears that at high tide, station 2-5 does not meet quality threshold approved as well as station 1-3 at low tide. The allowed threshold approved according to authority is 50 mg/L.
Acidity (pH)
Average value of pH measured at tidal zone is 3.15-3.52 at high tide and 3.15-3.55 at low tide. The result shows no significance different of pH during high and low tide.
pH value obtained both at high and low tide show water in this area is acid. The existence of dissolved carbon dioxide and carbonate ions create acid condition in the body of water [5]. Carbon dioxide and carbonate ions are well known as acid forming chemical species. It chemical interaction with water could create acid compound such as H2CO3. Acidity of water can be decreased if the amount of these species in water is reduced.
Threshold value for pH of water according to governor’s provision is between 6-9. By this rule, water at all station where samples acquired does not meet acidity allowed. Environmental management certainly needed to overcome this situation and make water in the area can be used safely.
Salinity
Salinity is a measure of salt content in water. Samples taken from station 1 through 7 shows salinity as depicted on Figure 5. Average value of salinity found at 1.3-2.
Salinity shows a slight different between high and low tide. Salinity increase when salt water from ocean approaches land at high tide. At low tide, sea water was pulled and caused to decrease salinity. Water pool in pond at TC 2 and TC 6 shows same value of salinity. This certainly due to no sea water influence affect salinity.
DOI: 10.24845/ijfac.v2.i2.39 45 Figure 6 shows laboratory analysis result of dissolve
oxygen (DO) water samples from all station. At high tide, DO has average 4.15-5.5 mg/L whereas at low tide it has between 3.65 to 5.35 mg/L.
Samples water from high tide shows slightly higher DO than at low tide. Water circulation from ocean at high tide contribute to increase DO of water. Lower DO at low tide might cause by addition of organic and inorganic materials from shore whilst water amount is decrease. Dry season also gave contribution to lowering DO at low tide. Fallen leaf and branches from plant certainly increase contamination of water by organic matters hence decrease dissolved oxygen [1]. Dissolved oxygen is important for organism metabolism. Minimum requirement according to Governor’s provision no 16/2005 is 6. According to this rule, all station has DO value below threshold approved.
Biological Oxygen Demand (BOD)
Result from laboratory analysis on BOD shows that at high tide samples has value between 1.95 to 58.2 mg/L whereas at low tide 1.89 to 40.25 mg/L. It appears from Figure 7 that samples from high tide has higher BOD than from low tide.
Organic materials decompose biologically in water by microorganism in the present of oxygen supply. Large amount of BOD concentration means high amount of organic wastes need to be decomposed by microorganism [6]. Some samples show higher than other on its BOD indicate the existence ofhighly decomposition process by bacteria while other is relatively low. According to data displayed at high tide, station 2-7 has BOD value higher than threshold approved by authority while at low tide station 1-3 shows same result. The threshold value maximum for biological oxygen demand according to Governor’s provision is 2 mg/L.
Chemical Oxygen Demand (COD)
Chemical oxygen demand (COD) is a measure of the capacity of water to use up oxygen during decomposition of organic matter and oxidation of inorganic substances such as ammonia and nitrite. COD value obtained from laboratory analysis at high tide is between 7 to 172.5 mg/L while at low tide between 6 to 127.5 mg/L.
High COD value indicate large amount of waste water with organic content from settlement has been discharged into the tidal zone. This domestic waste usually discarded via drainage which flow to the river and eventually came to the shore. Agricultural activity in addition to settlement also gave contribution to highly COD detected [7].As can be seen on Figure 8, High COD value which proved do not meet standard assigned by Governor’s provision are station 2-7 at high tide and
station 1-3 at low tide. COD according to the provision should have maximum value at 10 mg/L.
Ammonia
Average value of ammonia content in the water samples as depicted on Figure 9 are 0.155 to 0.4 mg/L at high tide and 0.16 to 0.45 mg/L at low tide. The highest sources of ammonia are nature origin; from decomposing biomass and from the excreta of humans and animals. Man-made sources also available and give contribution such as the use of fertilizers and waste disposal sites or industrial processes.
Environment assessment at the location confirmed that excessive use of fertilizer and domestic waste from near-by settlement influenced ammonia concentration in the water. Linier correlation between high concentration of ammonia and intense activity from agriculture using fertilizers and settlement without waste management had been reported [5]. Poor drainage and sanitation is also give rise of ammonia in water environment. Standard quality threshold for ammonia according to the rule is 0.5 mg/L maximum, hence the water still meet the criteria required. Fertilizer and domestic waste although gave rise on ammonia level, still can be tolerate by environment. Caution certainly must be applied due to ammonia level just slightly below maximum level approved by authority.
Phosphate
Analysis of Phosphate on the water samples conducted at laboratory gave average result 0.1605 to 0.1935 mg/L at high tide and 0.1575 to 0.183 mg/L at low tide. The result as displayed on Figure 10 is slightly different between one sample’s station to another.
Phosphate is ions form of phosphorus, an element largely found naturally in rock and other mineral deposits. There are three different form of Phosphate: orthophosphate, metaphosphate and organically bound Phosphate. Orthophosphate in addition to natural processes also can be produced from man-influenced sources such as sewage treatment, agricultural sites and application of particular fertilizer [8].
Phosphate is ionic compound which practically soluble in water environment. It is harmless except if it exists in very high level. At high concentration Phosphate can caused digestive problem to human and animal. Water quality threshold approved for Phosphate content is 0.2 mg/L maximum. Result from samples analysis shows maximum for high tide is 0.1935 and low tide 0.183 mg/L. By this condition, all station still fulfill requirement as class I water for daily utilization.
DOI: 10.24845/ijfac.v2.i2.39 46 Laboratory analysis carried out to determine Fe
obtained 0.155 to 0.325 mg/L at high tide and 0.185 to 0.31 mg/L at low tide. Iron dissolved in water in two different ion form: Fe2+ and Fe3+ or commonly known as Ferro and Ferri ions. Its form depends on acidity of water and availability of oxygen.
` At pH 7.5-7.7, Ferri ions is oxidized and form chemical bond with hydroxide to produced Fe(OH)3 which is insoluble and precipitated at the bottom in reddish color. Insoluble iron deuce can only be found in anaerobic and acid water [5]. Iron content > 1.0 mg/L in water environment is hazardous for aquatic organism live [5]. Water quality threshold for iron in water is 0.3 mg/L which is not fulfill by sample water from station 1 at high tide and station 4 and 5 at low tide.
Coliform
Coliform bacteria are indicator organism for the presence of pathogens in the water sample. According to laboratory resultobtained, maximum content of Coliform in the water samples are 1.1 at high tide and 2.25 at low tide per 100 mL water.
Most of stations where samples were taken showed no Coliform found in the water. Samples which were detected Coliform is Station 3, 4 and 5 in a very small number. Generally, Coliform is settled in the bottom of water. Affected by water flow in and out at tidal event, the bacteria appeared to be hard to grow optimally hence almost none was found. Coliforms are always present in the digestive tracts of animals, including humans, and are found in their wastes. They come into the water via runoff from poor drainage through river and increase especially at dry season [9]. Maximum 100 per mL water is still tolerate according to Governor’s provision no 16/2005 for class I water.
Water quality status at Muliasari Village according to Storet method
Status on water quality at Muliasari village was determined according to Storet method. The method is carried out by comparing analysis result and quality threshold approved by Governor’s provision no 16/2005. Score acquired by Storet method is -27 for high tide and 27 for low tide indicate water is moderately polluted and categorized as class C water.
CONCLUSION
Based on the findings of this study the following conclusions can be drawn:
1. Water quality status at Muliasari Village according to The Governor’s provision no 16/2005 is moderately polluted and can be classified into C class.
2. Several parameters do not meet threshold allowed i.e. pH, DO, BOD and COD while others such as ammonia, Fe, Phosphate and Coliform has value slightly below maximum value allowed by the authority.
3. It is necessary for residents in the research location to increase their awareness on waste domestic management as well as agricultural to maintain and monitor water quality.
REFERENCES
[1] W.A. Wardhana, DampakPencemaranLingkungan, Penerbit Andi, Yogyakarta, 2004.
[2] A. Chinyama, Sustainable Sanitation Systems for Low Income Urban Areas-A Case of the City of Bulowayo, Zimbabwe. Physics and Chemistry of the Earth,50-52:233-238, 2012.
[3] Fisesa. E.D., I. Setyobudiandi dan M. Krisanti. 2014. Kondisi Perairan dan Struktur Komunitas Makrozoobenthos di Sungai Belumai, Kabupaten Deli Serdang, Provinsi Sumatera Utara. Depik. 3 (1): 1-9.
[4] Manik, Karden Eddy Sontang. PengelolaanLingkunganHidup. Djambatan. 2009. [5] H. Effendi, Telaahkualitas air: Bagi Pengelolaan
Sumber Daya dan Lingkungan Perairan. Kanisius. Yogyakarta, 2003.
[6] Yuliastuti, E. 2011. Kajian Kualitas Air Sungai Nginro dalam Upaya Pengendalian Pencemaran Air. Tesis. Universitas Diponegoro. Semarang.
[7] A.B. Supangat,
PengaruhberbagaiPenggunaanLahanTerhadapKuali tas Air Sungai dikawasanHutanPinus di Gombong,
Kebumen, Jawa Tengah.
JurnalPenelitianHutandanKonservasiAlam. Vol.5. No.3. pp 267-276, 2008.
[8] J.R. Casali, J.Gimenez, J.Diez, J.D.C. Alvarez-Moros, M. de Lersundi, M.A.Goni, Y.Campo, R. Chahor, J. Gastesi, Lopez,Sediment production and water quality of watersheds with contrasting land use in Navarre (Spain). Agricultural Water Management, 97 pp.1683-1694, 2010.
[9] Feliatra, Sebaran Bakteri Eschericia coli di PerairanMuara Sungai Bantan Tengah Bengkalis Riau. FakultasPerikanandanKelautan, Universitas Riau, Pekanbaru. JurusanBiogen. Vol 1, hal 178-181, 2002.