Air Cargo Capacity on Cargo Terminal Development Plan
at Soekarno-Hatta International Airport
ABSTRACT
The purpose of this study was to find out the capacity of cargo volume, the needs of cargo warehouse space and utilization in 2023. The writer used quantitative analysis method with linier regression analysis method and a simple least squares method to calculate and forecast the cargo capacity at the amount needs. The calculation of the amount of cargo volume has been projected from the counting of 2010 to 2023, where the amount of desired cargo volume which was approximately 1,500,000 tons can be achieved around the year 2022 to 2023, while the amount of cargo volume at this time in 2013, reaching about 741,000 tons. In 2014 a new warehouse or domestic and international cargo terminal should be built to expand the space of the warehouse so that the old cargo terminal at IA terminal can be replaced.
Keywords: air cargo capacity, the cargo warehouse space, warehouse utilization. Ricky P. Ricardianto Hendro Kuntohadi Muhammad Rifni
STMT Trisakti STMT Trisakti STMT Trisakti
[email protected] [email protected] [email protected]
the total number of cargo activity is going to reach 1 million tons and it is expected optimistically by PT. Angkasa Pura II and assisted by LAPI_ITB forecast that it will reach 1.5 million tons in 2022 or 2023 (PT Angkasa Pura, 2012 and directorate of air transport, 2009). To accommodate the cargo activities, PT Angkasa Pura II (Persero) needs careful planning studies professionally in order to continue the implementation that is design planning as well as the tender documents for the auction of the physical construction.
It takes additional reference ma-terials such as a comparative study to other similar facilities that already exist and can be used as a viable model as an example of
Introduction
Soekarno-Hatta airport plays an important role in the development process of the State of Indonesia because it is the main entrance connecting Indonesia with other countries and other regions within Indonesia.
airport buildings and facilities complete with modern cargo terminal, effectively and efficiently.
The review of literature in this study includes theories relating to the theory of statistical analysis from Kadir (2010), J. Supranto (2008) about regression and correlation, a simple least squares method, air cargo (IATA 2004, IATA AHM 810, 2008, IATA 2009, IATA SGHA section 5, 2013, ICAO Annex Np. 10,14,16,18, 1999) such as: service and cargo handling systems, outbound cargo handling, inbound cargo handling, Cargo Terminal Management, knowledge of some basic facilities at the cargo terminal (international import and entrance zone / inbound domestic and international export and out zone/ outbound domestic as well as import lines: red, green, and yellow).
Logistics is a strategic management process of the removal and storage of goods, spare parts and finished goods from suppliers, among the company’s facilities and to customers (Bowersox, 2002)
According to IATA and ICAO (IATA 2004, IATA AHM 810, 2008, IATA 2009, IATA SGHA section 5, 2013, ICAO Annex Np. 10,14,16,18, 1999), cargo is any goods sent by aircraft but post or other property under international postal convention agreements and baggage carried by passengers.
According to the decree of the Minister of Transportation. No Km.14 1989 on the control of passengers, luggage and cargo transported by civil aircraft cargo is aircraft goods that is equipped with the Air Cargo Letter (SMU) including luggage sent through cargo shipment procedures.
From the definition above-mentioned definition of cargo essentially has the same meaning and can be inferred that the cargo is goods or items transported by the conveyance to be sent from the place of origin to the destination and equipped with appropriate documents and sent through
the delivery procedures.
According to Suharto and Eko Probo (2010), “Cargo is defined simply as all goods that are sent by air (aircraft), sea (ships), or land (container truck) that is usually for trade, both between regions/ cities in the country and between countries (international) known as export-import.
There are three main parties associated with the shipment of cargo, namely the shipper and or the receiver (consignee); the carrier; and the ground handling and or warehouse operator. Shipper can be an individual, business entity, performed directly without intermediaries, or through freight forwarding services known as freight forwarders or freight forwarders ship or aircraft.
Export
Suharto and Eko Probo (2010) states, exported goods are goods that have been loaded or to be loaded on a carrier to be removed from the customs area. The goods exported must pass the documents examination. In order to encourage export, a physical examination often carried out as minimum as possible, so the investigation only conducted on the documents.
Based on the definition above, the writer can conclude that export is a trade activity of a company to remove the goods from the customs territory, sold or traded in the customs territory of the other country.
Research Method
Regression and Correlation Theory and a Simple Least Squares Method
Regression and Correlation Analysis (Kadir, 2010)
connection or not between two or more variables, measure the strength of relationship, making predictions based on the strength of that relationship.
This technique is useful to study the variables that have a relationship based on the theory previously constructed so that the direction of linkage is expected to be found.
Regression and Correlation Analysis
Functional relation : Y = f(X) Regression analysis :
Y = f(X) ……… Y = a + b(X)
Y = dependent variable
a = constants when the independent variable (X) = 0
X = independent variable For example: Y = 10 + 0.5 X
Source: J. Supranto (2008)
Simple Least Square Method
Method of simple Least Squares:
An estimate of the value of a and b of the equation Y = a + bX based on the observation data resulting of the smallest (minimum) squared errors sum. Least Square method is a method that generates forecast data with the smallest error of squares forecasting.
Simple Least Square Method
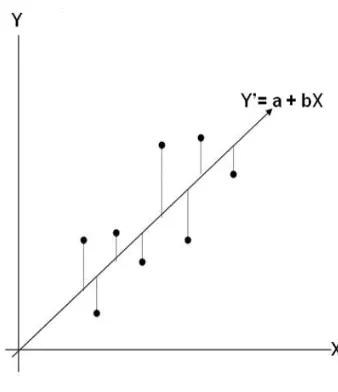
FORECASTING, Linier Regression, Equation: Y = a+bX
To get the regression equation above use 2 ways:
1. two normal equations: ∑Y = an + b∑X
Estimatation value: Y’ = a +bX
Figure 1 Forecasting, Linier Regression
Source: J. Supranto (2008)
Data Analysis Method
Multiple calculations such as a least square method and Linier regression forecasting are used to calculate the air cargo capacity. All necessary data compiled in Microsoft Excel file where each data has label and value that indicates purpose and conditions of the data. Then the data will be invoked by using the program.
Data and needs necessary for the counting:
1. Relatively equal service capacity within a maximum of 10 years or up to 2023, as efforts to improve the standards cargo terminal service at Soekarno-Hatta airport.
ton/ aircraft, the amount of aircraft/ day, the amount of cargo ton/ day.
3. The aircraft movement for domestic, international, outgoing, incoming, import, and export category.
4. The average calculation of the amount of the air cargo capacity (ton/ aircraft) 5. The calculation of the needed of
warehouse’s space and capacity
6. The calculation of air cargo capacity in the 2010 up to 2023 period
7. The calculation of air cargo warehouse utilization year 2023
Data Analysis Program
Once the data is collected and analyzed, the next step is to make the program analysis. Data analysis was carried out through the following three approaches:
a) Approach method with several annual departure counting (KAK PT. Angkasa Pura II, PT. Perentjana Djaja, 2012), only as a basic comparison calculation. b) The calculation of capacity forecasting
or the amount of cargo using Regression and Correlation Analysis Theory and Simple Least Square Method (j. Supranto, 2008)
c) The calculation for the forecasting of warehouse space and cargo terminal needed, using Microsoft excel file.
Data Collection Technical
Among the necessary data are data on the number of cargo, data needed to solve the calculation problem of air cargo. The data obtained through interviews with PT. Angkasa Pura II (Cargo General Manager, operator and staff at building 528, cargo area) and PT. Jasa Angkasa Semesta manager, regarding to the activity in the calculation of the amount of air cargo at
existing cargo terminal at Terminal IA
Data considered and taken into account: 1) The number of air cargo data at Soekarno-Hatta aiport, since 2001 to 2013 and the data of the biggest amount of air cargo in the world in 2012/2013, as a comparison (Airport Council International, 2013).
3) Data on the percentage of the green line, yellow line and red line on the import existing cargo terminal will be planned at Soekarno Hatta Airport Cargo Terminal (PT Angkasa Pura II, 2013). 6) The traffic Movement of cargo flight and
aircraft type with a large haulage capacity (tonnage minimum amount), specialized cargo aircraft schedules, th enumber of departure of the aircraft (LAPI-ITB, 2012).
7) The increasing trend of cargo terminal use (LAPI-ITB, 2012).
8) Percentage composition of cargo goods, bulk goods and packed goods (PT Jasa Angkasa Semesta, 2012).
9) Facilities of freight forwarder cargo agent activities in receiving the delivery of goods to customers and cargo reception facilities before the departure entering the area of the terminal cargo (restricted area).
of general cargo items and special cargo of cool storage, dangerous goods storage, etc.
All the data found will be used as consideration to construct the amount of calculation or the air cargo capacity.
Findings and Discussion
Logistic Industry Background
1) Airport is part of logistic business which is needed by manufacturing industry and has physical supply (inbound) and physical distribution (outbound) activities.
2) Airport needs to pay attention to shipper needs of air cargo shipment services. 3) The Shipper position in air cargo system
as a demand generator and Shipper has criteria in choosing air cargo service providers.
From the research / planning LAPI ITB (2012) forecast data regarding the realization of Soekarno-Hatta airport cargo traffic in 2011 consisting of outgoing 176,152 tons, export 180,800 tons, incoming 28,265, import 178,121 tones, and import rush 70,987 tons
In this case, the writer collect the field data that import cargo is divided and explained in detail to become (percentage based on the existing data):
1) Green line 70% = 70% x 178,121 ton =
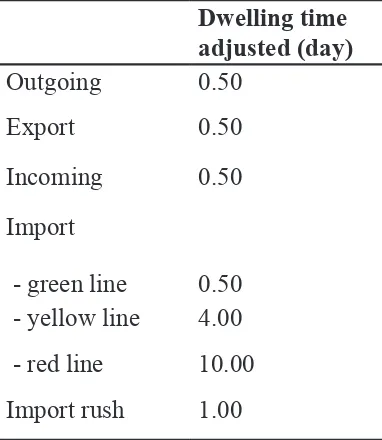
Then the writer found the important thing in the operation of cargo warehouse is a long time to be / stay (dwelling time) in the warehouse, (PT Jasa Angkasa Semesta, 2012), namely:
1. For outgoing cargo (fit to domestic inter-island airplane) is averaged over the 0.5 day
2. For Export cargo is on average for 0.5 day
3. For incoming cargo (loading of the airplane inter-island) is the average over the 0.5 day
4. To import cargo green line during the 0.5 day
5. For import cargo yellow line during the 4 day
6. For import cargo red line during the 10 day
7. For import cargo rush for 1 day.
Green line means the process of obtaining documents PIB (Import Declaration) was smooth. It means there is no problem on the documents, freight, duty payments, and no importer status in the special notes (black list).
Yellow line means there are problems on documents and payment of customs duties.
The red line is usually due to suspected document does not correspond with the state of the cargo. The importer also has a bad record for example smuggling, document manipulation, etc.
The number of aircraft movements at Soekarno Hatta Airport in 2011 regarding to monthly data for the domestic and international as in the table above obtained from the study LAPI ITB (2012)
The detail of the cargo aircraft movement was processed by the writer as followed (50% is based on the observation at existing cargo terminal):
1) Outgoing = 504,382 x 50% = 252,191 airplane
2) Incoming = 582,382 x 50% = 252,191 airplane
airplane
4) Export = 107,548 x 50% = 53,774 airplane
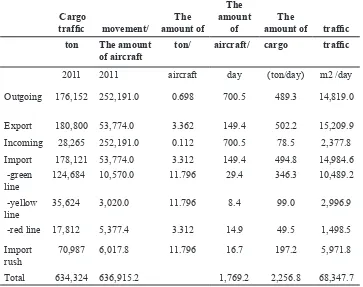
The table above shows that cargo traffic must enter the warehouse on average per day. Then there is data which is observed and processed by the author on dwelling time (length of stay) in a warehouse in units of days for each type of cargo categories: outgoing, incoming, green line import, yellow line imports, red line imports, and the import rush.
Sample of the counting of cargo outgoing per day:
There is cargo traffic in as much as 14,819.0 m2 in m2. Here the dwelling time is 0.5 days. The calculations in 1 day just need space = 14,819.0 / 2 = 7,409.5 m2 for 1 tier stacking height. If high stacking shelf life is 2 tier, then the area of warehouse space required = 7,409.5 / 2 = 3,704.7 m2.
The next is an example calculation for import cargo red lines per day:
There is cargo traffic in as much as 1,498.5 m2 in m2. Here the dwelling time is 10 days. Calculations within 1 day need space = 1,498.5 x 10 = 14,984.6 m2 for 1 tier stacking height. If high stacking shelf life is 2 tier, then the area of warehouse space required = 14,984.6 / 2 = 7,492.3 m2.
Calculation of warehouse space needed per day in the table above for all categories of cargo (outgoing, incoming, green line imports, yellow line imports, red line imports, and the import rush) based on the amount in the above table is = 27,196.0 m2.
Counting sample:
Warehouse utilization estimation in 2015:
1) The existing warehouse space is 49,956
m2 (PT. Angkasa Pura II).
2) The estimation of warehouse utilization needed for average 2 tier stack is 37,152 m2
3) The warehouse utilization estimation in 2015 is 37,152/49,956 x 100% = 75% (over utilized)
Warehouse utilization estimation in 2023:
1) The existing warehouse space is 49,956 m2
2) The estimation of warehouse utilization needed for average 2 tier stack is 69,331
3) The warehouse utilization estimation in 2015 is 69,331/49,956 x 100% = 139%, so that the warehouse will be lack of space.
Conclusion
After the analysis and discussion of the calculation of the amount of new air cargo capacity, then a conclusion can be drawn as a basis to begin planning an air cargo terminal construction both domestically and internationally.
The space of Cargo warehouse needed in 2010 – 2023
The capacity of the amount of Cargo Volume by 2023
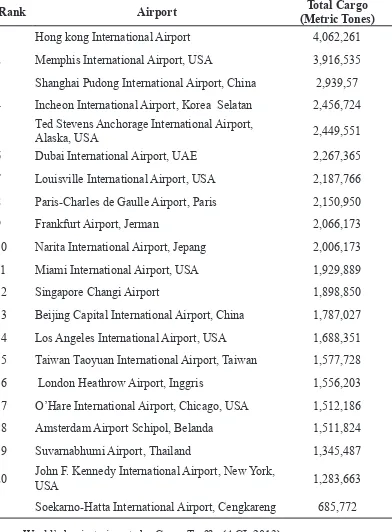
The amount of cargo volume (tons): Seen from the results of the study, the amount of air cargo is projected to reach approximately 741.394 million tones in 2013 and is forecast or projected to reach 1.5 million tons in 2023. Forecasting results are consistent with the calculation in annual cargo departure (Data PT. Planners Djaja) , only when compared with the projection of the LAPI-ITB and PT. Angkasa Pura II, achieving the amount of 1,500,000 tons of cargo has actually been achieved by four international airports, airport in Asia, namely Tao Yuan in Taiwan and in Europe, namely Heathrow in the UK, U.S. and Chicago O’Hare at Schipol in the Netherlands in 2012 or 11 years before a new projection which Indonesia can achieve.
Requirement number of air cargo since 2010 with a capacity of 586,736,000 tones are expected to rise in 2023 to reach a capacity of 1.617,099 billion tons. Air cargo capacity increased by 176%.
Air Cargo Warehouse Utilization in 2023
The utilization of warehouse in Soekarno-Hatta Airport in 2014 is 64%, which includes in the level of over utilized. Meanwhile the utilization prediction in 2015 will be 75%. The warehouse utilization forecast in 2019 will be 139%. This condition will be over utilized, will be over flow. In 2014 a new warehouse or cargo terminal should be built to expand the space of the warehouse. The forecast of warehouse space is needed with 60% utilization level.
References
[Kemenhub RI] Kementerian Perhubungan Republik Indonesia. Direktorat
Angkutan Udara, Direktorat Jenderal Perhubungan Udara. 2009. Data tentang kapasitas kargo. Jakarta: Kemenhub RI.
[IATA] International Air Transport Asociation. 2004. Cargo & Separate Express Facilities Terminal, Airport Development. Reference Manual 9th 2004, Chapter 0. Montreal: IATA [IATA] International Air Transport
Asociation. 2008. AHM 810, Annex A. Aircraft Handling Services. Montreal: IATA
[IATA] International Air Transport Asociation. 2009. Airport Development Reference Manual. 9th Edition. Montreal: IATA
[IATA] International Air Transport Asociation. 2013. SGHA, Annex A, section 5. Standard Ground Handling Agreement. Montreal: IATA
[ICAO] International Civil Aviation Organization. 1999. Annex No. 10,14,16,18, Aerodrome Standards, Aerodrome design and operations. 3rd Edition. Montreal: ICAO
J. Bawesox, Donald. 1995. Manajeman logistik. Edisi ke-1. Jakarta: Bumi Aksara.
Kadir, 2010. Statistika. Jakarta: Rosemata Sampurna..
[Kemenhub RI] Kementerian Perhubungan Republik Indonesia Keputusan Menteri Perhubungan Republik Indonesia Nomor KM 14 Tahun 1989. Tentang Penertiban Penumpang, Barang dan Kargo yang Diangkut Pesawat Udara Sipil. Jakara: Kemenhub RI.
[LAPI ITB] Lembaga Afiliasi Penelitian dan Industri Institut Teknologi Bandung. 2012. Grand Design Bandar Udara Internasional Soekarno-Hatta. Bandung: LAPI ITB
Majid, S.A. dan Warpani, E.P.D. 2010. Ground Handling Manajemen Pelayanan Darat Perusahaan Penerbangan. Jakarta: Rajawali Pers.
PT Angkasa Pura II (persero) dan PT Perentjana Djaja. 2012. Kerangka Acuan Kerja (KAK)
PT Jasa Angkasa Semesta. 2012. Data tentang Jumlah Kargo pada Tiga Jalur Kargo Udara Internasional.
Air Cargo Growth Cargo Flight Traffic Movement
Table 1 The Movement of The Busiest Cargo Traffic in The World, 2012
Rank Airport Total Cargo
(Metric Tones)
1 Hong kong International Airport 4,062,261
2 Memphis International Airport, USA 3,916,535
3 Shanghai Pudong International Airport, China 2,939,57 4 Incheon International Airport, Korea Selatan 2,456,724 5 Ted Stevens Anchorage International Airport, Alaska, USA 2,449,551
6 Dubai International Airport, UAE 2,267,365
7 Louisville International Airport, USA 2,187,766 8 Paris-Charles de Gaulle Airport, Paris 2,150,950
9 Frankfurt Airport, Jerman 2,066,173
10 Narita International Airport, Jepang 2,006,173
11 Miami International Airport, USA 1,929,889
12 Singapore Changi Airport 1,898,850
13 Beijing Capital International Airport, China 1,787,027 14 Los Angeles International Airport, USA 1,688,351 15 Taiwan Taoyuan International Airport, Taiwan 1,577,728
16 London Heathrow Airport, Inggris 1,556,203
17 O’Hare International Airport, Chicago, USA 1,512,186
18 Amsterdam Airport Schipol, Belanda 1,511,824
19 Suvarnabhumi Airport, Thailand 1,345,487
20 John F. Kennedy International Airport, New York, USA 1,283,663
Soekarno-Hatta International Airport, Cengkareng 685,772
Source : World’s busiest airports by Cargo Traffic (ACI, 2013)
The amount
Cargo
traffic Dwelling time The amount
The amount ton/
aircraft/ The amount
ton Adjusted
(day) aircraft aircraft day ton/day
Outgoing 176,152 0.50 252,191.0 0.698 700.5 489.3
Export 180,800 0.50 53,774.0 3.362 149.4 502.2
Incoming 28,265 0.50 252,191.0 0.112 700.5 78.5
Import 178,121 53,774.0 3.312 149.4 494.8
Green
line 124,684 0.50 10,570.0 11.796 29.4 346.3
yellow
line 35,624 4.00 3,020.0 11.796 8.4 99.0
red line 17,812 10.00 5,377.4 3.312 14.9 49.5
Import rush
70,987 1.00 6,017.8 11.796 16.7 197.2
634,324 636,915.2 1,769.2 2,256.8
The Analysis of Warehouse Cargo Space Needs
Table 2 The Amount of Cargo Traffic
Table 3 Cargo Dwelling Time at Soekarno Hatta Cargo Terminal Warehouse
Source: LAPI-ITB, PT. Angkasa Pura II, PT. Jasa Angkasa Semesta (2012) and pro-cessed by the writer (based on least square method and linier regression forecasting calculation)
Source: PT. Jasa Angkasa Semesta (2012) and processed by the writer Dwelling time
adjusted (day)
Outgoing 0.50
Export 0.50
Incoming 0.50
Import
Cargo
traffic movement/
The amount of
The amount
of
The
amount of traffic ton The amount
of aircraft
ton/ aircraft/ cargo traffic
2011 2011 aircraft day (ton/day) m2 /day
Outgoing 176,152 252,191.0 0.698 700.5 489.3 14,819.0
Export 180,800 53,774.0 3.362 149.4 502.2 15,209.9
Incoming 28,265 252,191.0 0.112 700.5 78.5 2,377.8
Import 178,121 53,774.0 3.312 149.4 494.8 14,984.6
-green
line 124,684 10,570.0 11.796 29.4 346.3 10,489.2
-yellow
line 35,624 3,020.0 11.796 8.4 99.0 2,996.9
-red line 17,812 5,377.4 3.312 14.9 49.5 1,498.5
Import rush
70,987 6,017.8 11.796 16.7 197.2 5,971.8
Total 634,324 636,915.2 1,769.2 2,256.8 68,347.7
Table 4 The Movement of Cargo Aircraft at Soekarno Hatta Airport in 2011
Table 5 The calculation of air cargo average capacity (the amount of ton/ aircraft) Source: PT. Angkasa Pura II, LAPI ITB (2012) and processed by the writer
Source: LAPI-ITB, PT. Angkasa Pura II, PT. Jasa Angkasa Semesta (2012) and processed by the writer Cargo
aircraft movement in 2011
domestic inter
national
outgoing incoming import export
Jan 40,407 8,517
Feb. 37,610 8,176
Mar 41,635 9,028
Apr 40,203 8,807
May 42,729 9,220
Jun 42,425 8,968
Jul 41,628 9,036
Augs 42,574 9,337
Sep 42,760 8,846
Okt 43,459 9,269
Nov 43,137 9,145
Des 45,815 9,199
The Calculation of Average of Warehouse Space and Cargo Weight
Table 6 The Calculation of the needs of Air Cargo Warehouse Space based on the height of the rack (tier)
Source: LAPI-ITB, PT. Angkasa Pura II, PT. Jasa Angkasa Semesta (2012) and processed by the writer
(using microsoft excell file calculation)
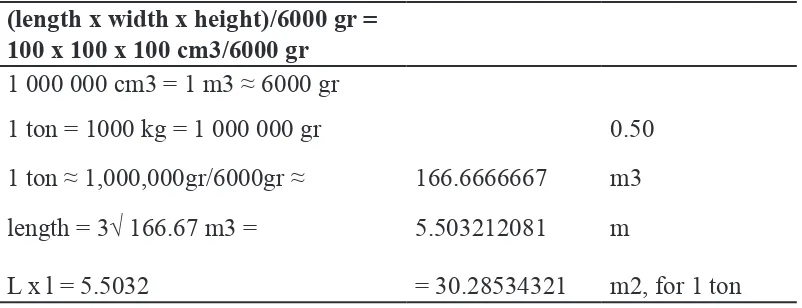
(length x width x height)/6000 gr = 100 x 100 x 100 cm3/6000 gr
1 000 000 cm3 = 1 m3 ≈ 6000 gr
1 ton = 1000 kg = 1 000 000 gr 0.50
1 ton ≈ 1,000,000gr/6000gr ≈ 166.6666667 m3
length = 3√ 166.67 m3 = 5.503212081 m
L x l = 5.5032 = 30.28534321 m2, for 1 ton
Traffic Needs Needs Needs
m2 /day dwelling time
Space m2
/day Space m2 /day
Space m2 /day 1 tier adjusted
(day) 1 tier 3 tier 2 tier
Outgoing 14,819.0 0.50 7,409.5 2,469.83 3,704.7
Export 15,209.9 0.50 7,605.0 2,534.99 3,802.5
Incoming 2,377.8 0.50 1,188.9 396.30 594.5
Import 14,984.6 0.0 0.00 0.0
-green line 10,489.2 0.50 5,244.6 1,748.20 2,622.3 -yellow line 2,996.9 4.00 11,987.6 3,995.88 5,993.8 -red line 1,498.5 10.00 14,984.6 4,994.85 7,492.3 Import rush 5,971.8 1.00 5,971.8 1,990.61 2,985.9
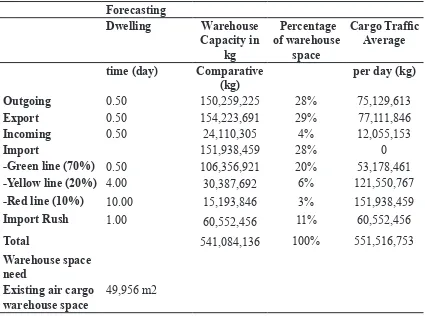
Table 7 The Needs of Air Cargo Warehouse Capacity in Kg.
Source: LAPI-ITB, PT. Angkasa Pura II, PT. Jasa Angkasa Semesta, LAPI-ITB (2012) and processed by the writer (using microsoft excell file calculation)
Forecasting
Dwelling Warehouse
Capacity in kg
Percentage of warehouse
space
Cargo Traffic Average
time (day) Comparative (kg)
per day (kg)
Outgoing 0.50 150,259,225 28% 75,129,613
Export 0.50 154,223,691 29% 77,111,846
Incoming 0.50 24,110,305 4% 12,055,153
Import 151,938,459 28% 0
-Green line (70%) 0.50 106,356,921 20% 53,178,461
-Yellow line (20%) 4.00 30,387,692 6% 121,550,767
-Red line (10%) 10.00 15,193,846 3% 151,938,459
Import Rush 1.00 60,552,456 11% 60,552,456
Total 541,084,136 100% 551,516,753
Warehouse space need
Existing air cargo warehouse space
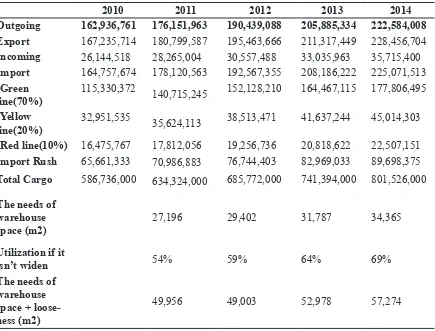
2010 2011 2012 2013 2014 Outgoing 162,936,761 176,151,963 190,439,088 205,885,334 222,584,008 Export 167,235,714 180,799,587 195,463,666 211,317,449 228,456,704 Incoming 26,144,518 28,265,004 30,557,488 33,035,963 35,715,400 Import 164,757,674 178,120,563 192,567,355 208,186,222 225,071,513 -Green
line(70%)
115,330,372 140,715,245 152,128,210 164,467,115 177,806,495
-Yellow line(20%)
32,951,535 35,624,113 38,513,471 41,637,244 45,014,303
-Red line(10%) 16,475,767 17,812,056 19,256,736 20,818,622 22,507,151 Import Rush 65,661,333 70,986,883 76,744,403 82,969,033 89,698,375
Total Cargo 586,736,000 634,324,000 685,772,000 741,394,000 801,526,000
The needs of warehouse space (m2)
27,196 29,402 31,787 34,365
Utilization if it
isn’t widen 54% 59% 64% 69%
The needs of warehouse space + loose-ness (m2)
49,956 49,003 52,978 57,274
Table 8 The Forecasting of Air Cargo Capacity 2010 – 2014 Period (in kg, utilization, the needs of warehouse space and warehouse space + loose)
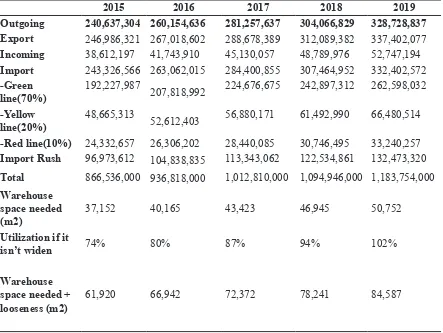
Table 9 The Forecast of Air Cargo Capacity 2015 – 2019 Period
(in kg, utilization, the needs of warehouse space The needs of warehouse space +
Source: LAPI-ITB, PT. Angkasa Pura II, PT. Jasa Angkasa Semesta (2012) and processed by the writer (based on least square method and linier regression forecasting calculation)
2015 2016 2017 2018 2019
Outgoing 240,637,304 260,154,636 281,257,637 304,066,829 328,728,837 Export 246,986,321 267,018,602 288,678,389 312,089,382 337,402,077 Incoming 38,612,197 41,743,910 45,130,057 48,789,976 52,747,194 Import 243,326,566 263,062,015 284,400,855 307,464,952 332,402,572 -Green
line(70%) 192,227,987 207,818,992 224,676,675 242,897,312 262,598,032 -Yellow
line(20%)
48,665,313 52,612,403 56,880,171 61,492,990 66,480,514
-Red line(10%) 24,332,657 26,306,202 28,440,085 30,746,495 33,240,257 Import Rush 96,973,612 104,838,835 113,343,062 122,534,861 132,473,320
Total 866,536,000 936,818,000 1,012,810,000 1,094,946,000 1,183,754,000
Warehouse space needed (m2)
37,152 40,165 43,423 46,945 50,752
Utilization if it
isn’t widen 74% 80% 87% 94% 102%
Warehouse space needed + looseness (m2)
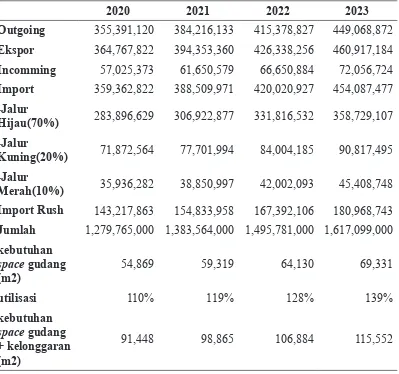
Table 10 The Forecast of Air Cargo Capacity 2020 – 2023 Period
(in kg, utilization, the needs of warehouse space, the needs of warehouse space + looseness)
Warehouse Cargo Utilization in 2023
Table 11 Air Cargo Warehouse Utilization
Source: LAPI-ITB, PT. Angkasa Pura II, PT. Jasa Angkasa Semesta (2012) and processed by the writer (based on least square method and linier regression forecasting calculation)
Source: processed by the writer based on the training data conducted by UNCTAD (1993) and
field experience.
2020 2021 2022 2023
Outgoing 355,391,120 384,216,133 415,378,827 449,068,872 Ekspor 364,767,822 394,353,360 426,338,256 460,917,184 Incomming 57,025,373 61,650,579 66,650,884 72,056,724 Import 359,362,822 388,509,971 420,020,927 454,087,477 -Jalur
Hijau(70%) 283,896,629 306,922,877 331,816,532 358,729,107 -Jalur
Kuning(20%) 71,872,564 77,701,994 84,004,185 90,817,495 -Jalur
Merah(10%) 35,936,282 38,850,997 42,002,093 45,408,748 Import Rush 143,217,863 154,833,958 167,392,106 180,968,743 Jumlah 1,279,765,000 1,383,564,000 1,495,781,000 1,617,099,000 kebutuhan
space gudang (m2)
54,869 59,319 64,130 69,331
utilisasi 110% 119% 128% 139%
kebutuhan space gudang + kelonggaran (m2)
91,448 98,865 106,884 115,552
Utilization Meaning
0% – <30% Under Utilized 30% - <50% Normally Utilized 50% - <60% Fully Utilized
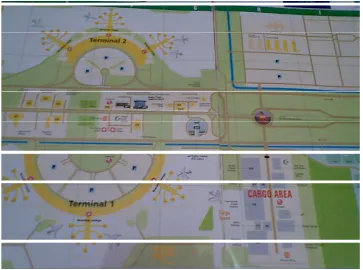
Figure 1 Cargo Terminal Development Plan Source: PT. Angkasa Pura II (2012)