Fusion of 3D models derived from TLS and image-based techniques for CH enhanced
documentation
P. Bastonero a,, E. Donadio a, F. Chiabrando b, A. Spanò a
a Dipartimento di Architettura e Design, Politecnico di Torino, Viale Mattioli 39, Torino, 10125, Italy – paola.bastonero, elisabetta.donadio, antonia.spanò@polito.it
bDipartimento di Ingegneria dell’Ambiente, del Territorio e delle Infrastrutture, Politecnico di Torino, Corso Duca degli Abru zzi 24, Torino, 10129, Italy – [email protected]
KEY WORDS: TLS, RPAS, image matching, 3D models, model fusion, Cultural Heritage
ABSTRACT:
Recognizing the various advantages offered by 3D new metric survey technologies in the Cultural Heritage documentation phase, this paper presents some tests of 3D model generation, using different methods, and their possible fusion. With the aim to define potentialities and problems deriving from integration or fusion of metric data acquired with different survey techniques, the elected test case is an outstanding Cultural Heritage item, presenting both widespread and specific complexities connected to the conservation of historical buildings. The site is the Staffarda Abbey, the most relevant evidence of medieval architecture in Piedmont. This application faced one of the most topical architectural issues consisting in the opportunity to study and analyze an object as a whole, from twice location of acquisition sensors, both the terrestrial and the aerial one.
In particular, the work consists in the evaluation of chances deriving from a simple union or from the fusion of different 3D cloud-models of the abbey, achieved by multi-sensor techniques. The aerial survey is based on a photogrammetric RPAS (Remotely piloted aircraft system) flight while the terrestrial acquisition have been fulfilled by laser scanning survey. Both techniques allowed to extract and process different point clouds and to generate consequent 3D continuous models which are characterized by different scale, that is to say different resolutions and diverse contents of details and precisions. Starting from these models, the proposed
The Preservation and Conservation issues of built Heritage refer increasingly many specialized studies organized in system, since the interactions with natural and human influences make the vulnerability of cultural assets or their risk of damage, decline or loss very higher than earlier.
The geomatic techniques, especially range based (Terrestrial Laser Scanning –TLS) or image based (digital photogrammetry and image matching techniques) have specialized and enhanced in almost every process phase, from data acquisition to the generation of 3D metric products, up to the surface modelling and finally to the representation and dissemination. Summarizing, the CH metric documentation is a field of study which is endowed with well tested specific strategies, and based on a wide range of experiences.
By now, it’s well accepted that an accurate selection and integration of different survey techniques is more suitable than standalone methods. So keywords as multi-sensor, multi-scale, multi-resolution, multi-precision, multi-contents result models or final representations are always more frequently used and requested in CH environment.
In the field of metric survey and more generally in spatial information managing, the concept of integrating the acquisition data techniques or the processing methods is almost common, while the principles of data fusion has been carefully discussed and stated by the scientific community, in fact many consideration and deliberations on the use of correct terms have been declared by specifically established working-groups, dealing in Earth Observation. (Wald 1999). After the first appearing in the literature in the 1960s, mostly as mathematical models for data manipulation, two decades after several
efforts have been addressed to unify terms and procedures on data fusion, thus the fields of interests increased a lot (robotics, engineering, pattern recognition, geo-science, mine detection, military applications, remote sensing, traffic control, aerospace systems, medicine). (www.data-fusion.org).
A general concept of fusion refer that different sources of information are combined to improve the performances of a system; a widening concept identify data fusion as a set of methods, tools and means using data coming from various sources of different nature, in order to increase the quality of the requested information. Also with the aim to decide an order in a so wide subjects, some different levels of data fusion have been introduced: the low level fusion, called data fusion, combines several sources of raw data to produce new data that is expected to be more informative and synthetic than the inputs; the intermediate level fusion, called feature level fusion, that combines various features that may come from several raw data sources, from different sensors of different time; the last level, which is decision fusion, includes voting methods, statistical methods, fuzzy logic based methods. (Dasarthy, 1994)
Even among ISPRS very many Working Groups (WG) have directed their researches towards fusion procedures, and a reorganization concerning principles and their terms of reference have been carried out, principally by the IC WG "Integration of Image Analysis and GIS". Furthermore a detailed reports concerning the results of a wide collection of studies made a list of some topical items, among which there were: use of rules and models, quality indicators and control, reliability, importance of data structure etc. (Baltsavias, Hahn, 2000)
aerial images, and two-dimensional maps as sources for the reconstruction of 3D buildings models (Vosselman, 2002). Other experiences investigated the fusion in order to perform the automation procedures to register imagery on points models generated by TLS (Forkuo, King, 2004). Other type of studies have been directed to the fusion of multi-sensor 3D models purposed to the achievement of multi-resolution surface models in CH environment (Bonora, Tucci, Vaccaro, 2005)
1.2 Aims of the research and the test case
This paper present a test concerning the fusion of points model with the aim to improve the descriptive contents of the entire 3D building model, particularly the roof and another element in a very crucial and problematic position, which is the roof ledge. The higher portion of masonry, just before the connection with the roof, is the ending of the building, so in every historical period architects gave full attention to the technological and decorative characterization of ledges; contemporary these parts of the buildings are usually far from terrestrial scanners positions, so the resulting models are often less detailed and accurate, presenting a minor resolution than lower parts of the building.
The improvement of the resolution and the level of detail of the whole model of an historical building is connected with the set of problems concerning the integration and consultation of the interdisciplinary data that are gathered together in the knowledge phase of Cultural Heritage items. This is a very topical issue since, in recent years, the architectural CH knowledge and documentation phase has become an essential part in any restoration and conservation plan.
The integration and the storage of plenty of interdisciplinary analyses have become an essential need since they allow a better object monitoring and they also guide the following planning phase.
The new survey technologies, supported by Geomatic methods, have demonstrated great potentialities when applied to objects belonging to different Cultural Heritage categories. These techniques allow to quickly acquire a big amount of data, with high precision and quality, and to develop various 3D models and representations at different scale and resolution (Patias, Santana; 2012).
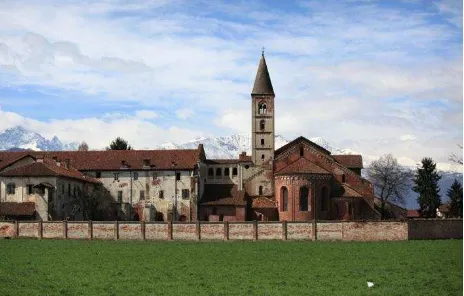
The experimental data fusion procedure presented in this paper has been applied to the Cistercian Staffarda Abbey (Figure 1). The Staffarda Abbey is a monastery, located near Saluzzo in north-west Italy, founded in the XII century by Cistercian monks. The abbey complex grew larger between XII-XIII centuries thanks to several property disposals and to land reclamation, and until the 15th century Staffarda was a very important regional cultural and economic centre, with a gradual
Figure 1. The Cistercian Staffarda Abbey with the snowy Alps in the background. (CN) Piedmont – Italy.
decline from that date onwards (Rotunno, 2011).
As a result of modifications over the centuries, the monastery combines both roman and gothic architectural style and includes the Santa Maria Church, the cloister and other monastic rooms (the dormitory, the refectory…), the covered market and the guestrooms (Beltramo, 2010).
Nowadays the monastery, managed by Ordine Mauriziano, represents one of the most important testimonies of Medieval Architecture in Piedmont.
The aim of the test here presented was to investigate the type of analysis that may be developed on a 3D model deriving by the integration of data acquired by multi-sensor techniques, terrestrial and aerial, and to compare its potentialities with those offered by two detached 3D models.
The opportunity to study an object as a whole, from both terrestrial and aerial point of view, is one of the topical architectural issues, since it allows to perform more detailed analysis useful for knowledge and monitoring phase.
Nowadays the new survey technologies make this aim more achievable thanks to the possibility to acquire more compatible terrestrial and aerial data and to integrate them each other (Chiabrando and Spanò, 2013).
In particular, this application used data coming from two different 3D surveys of the abbey: the first one was made by a RPAS (Remotely Piloted Aircraft Systems) photogrammetry operation which involved the whole complex (Bastonero, 2013), the second one was made by terrestrial laser scanner techniques based on LiDAR (Light Detection And Ranging) and was centred on the Santa Maria Church (Donadio, 2013).
These techniques allowed to extract and process different point clouds and to generate 3D models at different scale. The attempt to operate a data fusion between these data derives from the complementary nature of them: the point cloud generated by RPAS photogrammetry operation included the roofs of the complex and the point cloud made by terrestrial laser scanner techniques included the facades of the Church.
2. 2. DIFFERENT 3D SURVEY METHODS: TLS AND RPAS PHOTOGRAMMETRY
LiDAR (Light detection and ranging) techniques are a suitable 3D survey technology for Cultural Heritage documentation and knowledge phase since they allow to quickly acquire, through a laser emission, relevant and continuous information on articulated object surfaces with high level of precision and quality.
In particular, a scan is constituted by widespread clouds, comprising millions of points from which several images, concerning the registered cloud projections or sections, may be extracted for 2D traditional plotting. Furthermore, 3D textured models can be developed in order to study the geometry, the material, the surface degradation of the object and its structure or structural decay.
The RPAS are even more a common photogrammetric technique that uses RPAS platform which operates unmanned and with a ground control station. This technology combines the features of the close range photogrammetry (high precision and static acquisition) with those of the aerial photogrammetry and it is employed for nadiral multi-images applications (Eisenbeiβ, 2013).
local or global reference systems for all the measures. Furthermore, the use of a global or however recognizable coordinate system allows the continuous integration of data acquired with different techniques.
2.1 TLS survey
The aim of the laser scanning survey applied to the Santa Maria Church was to survey it, both internally and externally, in order to process 2D traditional restitution and to generate a 3D model wherein study the geometry, the walls conditions, the vaults and the structure in general, at diverse height, at an architectural scale (1:50-1:100). All that means that the accuracy of about 1-2 cm is needed.
The laser scanner employed for this application was the Faro Focus 3D scanner (range from 0.6 m up to 130 m, measurement speed 976,000 points/second, integrated colour camera). The acquisition phase consisted in several interdependent operations:
a topographical network measurement, achieved by GNSS technique, in order to fix a unique coordinate system for all measures;
the laser scanning acquisition (9 scans inside and 9 scans outside the church) (Figure 2);
the topographical measure of the targets, placed on the surface of the Church, using total station, so that it was further possible to relate all scans each other and to place them into the global coordinate system.
Figure 2. Nadiral view of the point clouds acquired by laser scanner. Green cue-balls mark the scans positions.
In this phase is very important to consider an overlapping (60% minimum) between adjacent scans and also a minimum sharing of 3 targets, in order to be able afterwards to connect all the scans together with an high accuracy.
2.1.1 TLS data processing: the first step of TLS data processing consisted in the union of the different point clouds acquired and in their registration by GCPs (ground control points) into the measured coordinate system. (maintaining a deviation under 0.2 cm). In this way it was possible to reach a single cloud composed of the millions of points acquired It is important to highlight that a point cloud is a 3D model wherein there is always a void between adjacent points and therefore there is no topological information, for this reason it is highly advisable to generate a 3D surface model (mesh) able to create afterwards some textured continuous models, section profiles and other metric representation such as front projection
including orthophotos etc.. The model has been meshed using the software 3D Reshaper (Technodigit).
Figure 3. Coloured and merged point clouds of the north facade - image extracted from 3D Reshaper
The mesh processing was made in two steps: in a first step a rough mesh with regular triangles was created, in a second step a deviation error was entered in order to refine the mesh. Since the point cloud was abundant on the facades but lacking on the roofs, it was necessary to process two different mesh with different parameters: the facade mesh was made with a triangle of 0.04 m size while the roofs one was made with a triangle of 0.08 m size. However it’s obvious that only the portions of the roof with declivity oriented toward the scan position can be surveyed (Figure 4).
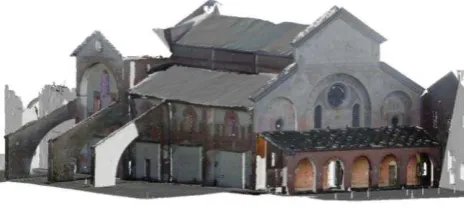
Figure 4. Final 3DModel after the merger between the two distinct mesh (front/roofs)
The following operation consisted in the model texturing, using the images took in situ according to photogrammetric parameters (Figure 5).
Figure 5. Final textured mesh
In particular, the presented laser survey and related 3D textured model has enabled a stratigraphic analysis applied on the north facade using detailed orthophotos (Figure 7).
This application demonstrated the LiDAR potentialities for the Cultural Heritage knowledge phase thanks to its high precision data and its various feasible representations, which represent a remarkable support for interdisciplinary analysis.
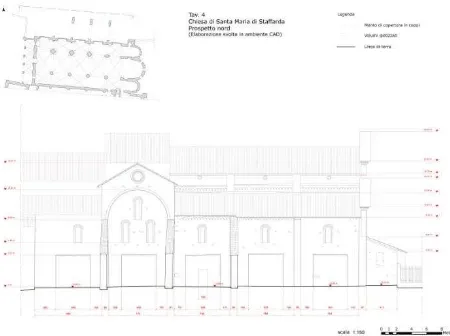
Figure 6. North front processed from laser scanner data
Figure 7.. Stratigraphic analysis of the north facade processed on image extracted from point cloud
2.2 RPAS (Remotely piloted aircraft system) survey
The purpose of the RPAS photogrammetry operation was to survey the entire Staffarda Abbey from the top, in order to study its volumetric system and the roofs conservation status. In order to achieve this purpose, a 3D model including the roofs of the complex, connected elements such us chimneys and ledges, and the surrounding ground has been generated by means of an image matching process.
This operation would have been quite unfeasible using only terrestrial survey techniques, since in architectural application the acquisition of data over certain heights need the use of an elevator, unless a minor resolution model is satisfactory. The RPAS tool employed in this application was a Vertical Take off and Landing 1.2 kg-HexaKopter (Mikrokopter), which is able to lift up to 1kg-playload (Figure 8) (Rinaudo et al.,2012) . The system was settled by 6 motors, 6 adaptor card (in order to control the speed and the rotation), 1 Fight Control adaptor card, 1 remote control, 1 Navi Control, 1 GPS receiver, 1 MK3MAG sensor equipped with a three-axial magnetometer (in order to
control the vehicle's balance), 1 wireless connection kit and 1 pc settled as ground control station.
A Sony NEX 5 camera with a 16 mm focal length, pixel size of 5.22 m and sensor size of 23,4x15,6 mm was used during the acquisition process.
The survey processing consisted in three main stages: – Survey project and flight planning
– Data acquisition – Data processing
Figure8. RPAS - hexaKopter (Mikrokopter)
According to the traditional rules of aerial photogrammetric acquisition, the flight plan evaluation, which entailed several calculations to achieve an adequate images overlapping for the later acquisition phase, was processed.
This first step was developed using analytic calculations, considering a 50m-flying height, a 73,125x48,75 image format on the ground and a 80% along - 50% across image overlap (Figure 9). The flying speed was set about 3m/s.
Figure 9. RPAS flight plan
The acquisition phase consisted in three main operations: the RPAS flight, the topographic network measurement, that was achieved by GNSS technique in order to generate a reference system for all the measures. Moreover, several GCPs have been measured with an accuracy higher than 1cm, in order to reference all the further processed data to a common coordinate system.
MicMac by IGN (France). Both the software employed a modified version of the SIFT algorithm (Lowe, D., 2004) for tie points extraction. As a first result the images have been automatically aligned, according to the shared features that have been identified in the overlapping portions of images. This process allowed to generate a first 3D point cloud that include all the portions of the building acquired during the flight (in the analyzed case a special attention was focused on the roofs of the complex and in the surrounding ground). (Figures 10 and 11).
Figure 10. Calculated Tie Points in Photoscan
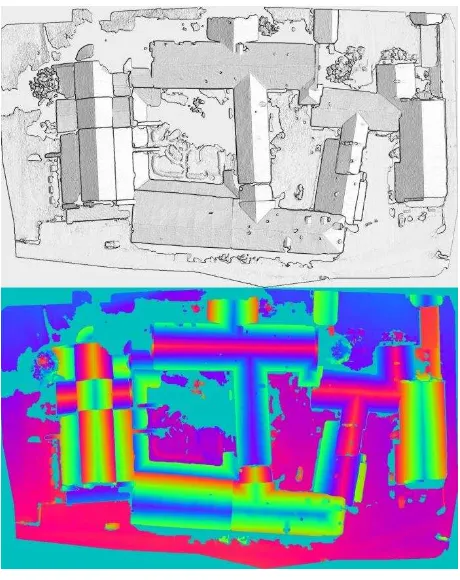
During this first step of processing, the internal orientation and a first alignment of the images was performed as well (Abdel-Wahab et al. 2012). Afterwards, when the bundle block adjustment ended (in both the software is performed using 40 GCPs), the final step consisted in the image-matching. After that the 3D information could be visualized as a coloured point cloud, as a 3D surface model (mesh) representing continuous information all over the complex (Figure 12), or both shaded or coloured depth maps (Figure 13) (. Furthermore a textured model using acquired images is easily achievable (Figure 14). Finally, the realization of the true orthophoto in order to obtain a more typical cartographic product is effective as well. All these products are very useful in the case of Staffarda, since their contents are able to provide a big amount of information about the general building geometry, the shape of architectural elements, their materials and their safety conditions.
Figure 11. Visualization of calculated Tie Points with camera location in MicMac
Figure 12. 3DModel visualization (Photoscan)
Figure 13. DSM extracted using MicMac: shaded view (above), 8bit colour view (below)
Figure 14. Textured 3DModel
In Table 1 some informations about the matching results using the two software are reported.
MicMac
Number of images 64
Pose Distance 50.602 m
GSD 14.61 mm
Coverage area 22494 m2
Tie-points 1827552
Extracted points 12720234 Photoscan
Number of images 64
Pose Distance 50.602 m
GSD 14.61 mm
Coverage area 22494 m2
Tie-points 330943
3. 3. DIFFERENT SENSORS CLOUDS FUSION AND NEW MODELS
As well known and tested by scientific community (Kerstenand and Lindstaedt, 2012, Hullo et al., 2009; Fritsch et al., 2011; Fritsch et al., 2012), the point cloud obtained by RPAS photogrammetry allowed to generate a 3D model of the roofs of the entire complex which was, however, defective of information on the external masonry ledge, since the images were only acquired with a nadiral point of view. Conversely, the point cloud acquired by laser scanner technique allowed to develop a 3D model very detailed on the facades but with a lack of information on the roofs and ledges.
For these reasons, a data fusion of the two point clouds was tested, in order to define the complexities of its generation and to show the potentialities offered by a final unique 3D model (Wenzel et al., 2012; Nex and Remondino, 2011). This test took place within the software 3D Reshaper and it was focused on a portion of the Santa Maria Church.
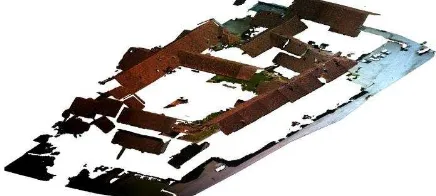
First of all, it was necessary to extract the roofs point cloud earlier generated through the image matching process. A first attempt has been made using the point cloud generated and extracted from Photoscan. (Figure 15).
Figure 15. Point cloud extracted using Photoscan software
When both point clouds and point clouds were imported and integrated within the software 3D Reshaper, using the same coordinate system supplied by the GCPs, it was possible to verify the potential of this union through a mesh generation (Figure 16).
Figure 16. Point clouds data fusion
In order to obtain the best mesh, several tests were carried out using different parameters (mesh in two steps and mesh with regular sampling) and different triangle sizes.
Despite these attempts, the generated 3D model was not satisfying for the purpose, due to the excessive noise that characterized the point cloud extracted from Photoscan (Figure 17-18).
Figure 27. Point cloud extracted from Photoscan. This zoom on the Church allows to notice the noise affecting the cloud.
Figure 18. 3DModel processed with regular sampling method (distance between points of 0.2 m) from data fusion.
Therefore, the purpose to achieve a better point cloud, has been pursued with another software: the open source suite MicMac , from which a new point cloud based on the same images have been extracted (Pierrot-Deseilligny and Clery, 2011) (Figure 19).
This software allowed to generate a new dense point cloud that offer a very low level of noise and therefore it is more suitable for the intended purpose. Once generated and imported the new point cloud, several new mesh were carried out again. The result of this second test was definitely more satisfactory. A new complete and detailed 3Dmodel on both fronts and roofs was generated, on which it was also possible to project the texture, using images from both surveys (Figure 20-21).
Figure 20. Final 3D model processed with “Regular Sampling” method (distance between points: 0.08 m).
Figure 21. A view of a span of the Church. The mesh has been processed with the “Mesh in two steps” method (distance between points: 0.07 m; deviation error: 0.05 m). The final
textured 3Dmodel is on the right.
4. CHANCES DERIVED FROM DATA FUSION
The last accurate overall 3D model offers the chance to study the facades and the roof together with higher details (the mean value is about 2cm) and also it has been possible to extract complete section profiles by whom the connection between wall and roof is clearly readable in details (Figure 22-23).
The test has showed once again that 3D models generated from TLS data are able to provide information at architectural scale about the general geometry (Moussa et al., 2012), the masonries and structure of the building at diverse heights.
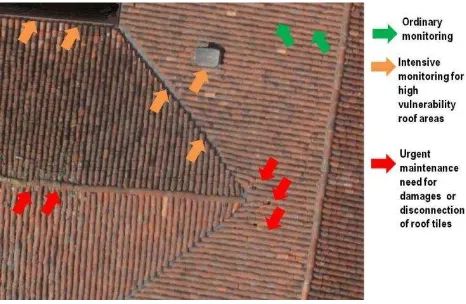
Figure 22. A proposal of different level of damages and vulnerable elements on the roof. The reading of roof deterioration con be applied on a 0.02 m resolution texture.
Furthermore the texture projection enable to highlight decay interesting the whole building, such as plaster degradation, anomalies of the structures, moistness and other environmental cause of damages.
Figure. 23. High details of ledges and adjacent areas on final textured model
Table 2. Abilities of data and process fusion
Despite all of these potentialities, this model lacked information on the roof, which were partly and hardly manually recomposed on the mesh. For these reasons, this model was not proper to fully meet the needs of the architectural scale by itself (e.g. it was not possible to extract complete sections throughout, using them as an efficient start point for drawing the traditional 2D sections).
The image matching process generated a 3Dmodel of the roofs of the complex, that allowed to study their conservations status, to model the ground adjacent to the building and also to draw the roofs plan.
However this model cannot provide suitable information about a key point of architectural heritage, in the eyes of technological, stylistic and maintenance peculiarities, which is the roof ledge and the connection with masonries and the constructive system of the roof.
The presented test showed how the integration among different types of data (for source, resolution, accuracy) acquired by different techniques, enables to achieve higher detailed information about the objects and suitable models or other representations in a critical point of buildings.
The data fusion permitted to save time in the surface model processing phase, since the data employed in this operation were equally plentiful on the entire object.
It was also possible to increase the radiometric information through the texture projection overall the volume, from the front to the roofs.
Therefore the final model proved the excellent complementarity that may be fulfilled by a fusion process of data deriving from different acquisition techniques. All the processing parts were developed in different period of time, an overall estimation of working time necessary to achieve the final products could be quantified in a month (2 expert operators).
process fusion for the achievement of depth contents and multi-scale models and representations, earlier unattainable.
5. REFERENCES
References from Journals:
Abdel-Wahab, M., Wenzel, K., Fritsch, D., 2012. Automated and Accurate Orientation of Large Unordered Image Datasets for Close-Range Cultural Heritage Data Recording. Photogrammetrie - Fernerkundung - Geoinformation (PFG). Vol. VI, pp. 679-689.
Chiabrando, F., Spanò, A., 2013. Points clouds generation using TLS and dense-matching techniques. A test on approachable accuracies of different tools. ISPRS ANNALS Of The Photogrammetry, Remote Sensing And Spatial Information Sciences, II-5/W1, DOI: 10.5194, pp. 67-72.
Dasarthy, B., 1994. Decision Fusion, IEEE Computer Society Press.
Eisenbeiβ, H., 2013. The potential of unmanned aerial vehicle for mapping. System Engineering and Technology (ICSET), IEEE 3rd International Conference, pp. 135-145
Hirschmuller, H., Buder, M., Ernst, I., 2012. Memory efficient semi-global matching. In: ISPRS Annals of the Photogrammetry, Remote Sensing and Spatial Information Sciences, Vol. I-3, pp. 371-376;
Kersten, T.P., Lindstaedt, M., 2012. Potential of Automatic 3D object reconstruction from multiple Images for applications in Architecture, Cultural Heritage and Archaeology. International Journal of Heritage in the Digital Era, Multi Science Publishing, pp. 399-420
Lowe, D., 2004. Distinctive Image Features from Scale-Invariant Keypoints, International Journal of Computer Vision, Vol. 60, Number 2, pp. 91-110.
Vosselman, G., 2002. Fusion of Laser Scanning Data, Maps, and Aerial Photographs for Building Reconstruction. IEEE transactions on geosciences and remote sensing, Vol. 1, pp. 85-88
Wald, L., 1999. Some terms of reference in Data Fusion. IEEE transactions on geosciences and remote sensing, 37(3), pp. 1190-1193.
References from Books:
Beltramo, S., 2010. L’abbazia cistercense di Santa Maria di Staffarda, L’Artistica editrice, Cuneo.
Rotunno, E., 2011. L’Abbazia di Staffarda,L’Artistica Editrice, Savigliano.
References from Other Literature:
Baltsavias, E., Hahn, M., 2000. Integrating spatial information and image analysis – one plus one makes ten. In: International Archives of the Photogrammetry, Remote Sensing and Spatial Information Sciences, Amsterdam, Holland, Vol. XXXIII, Part B2, pp. 63-74.
Bastonero, P., 2013. UAV (unmanned aerial vehicle) esperienza sull’abbazia di Staffarda, Master of Science thesis, tutors A. Spanò, F. Chiabrando, Politecnico di Torino;
Bonora, V., Tucci, G., Vaccaro, V., 2005. 3D data fusion and multi-resolution approach for a new survey aimed to a complete model of Rucellai’s chapel by Leon Battista Alberti in Florence.
In: CIPA 2005 XX International Symposium, Torino, Italy, Vol. XXXVI, Part 5/C34, pp. 679-684
Pierrot-Deseilligny, M. ,Clery, I.,2011. APERO, an Open Source Bundle Adjusment Software for Automatic Calibration and Orientation of a Set of Images ISPRS Archives, International Workshop 3D-ARCH, on CD-ROM, Trento, Italy.
Donadio, E., 2013. Tecnica laser scanning e tecnologia GIS per l’analisi stratigrafica del patrimonio storico costruito: la Chiesa di Santa Maria dell’abbazia di Staffarda; Master of Science thesis, tutors A. Spanò, S. Beltramo, F. Chiabrando, Politecnico di Torino;
Fritsch, D., Abdel-Wahab, M., Cefalu, A., Wenzel, K., 2012, Photogrammetric Point Cloud Collection with Multi-camera System. In: Progress in Cultural Heritage Preservation: 4th International Conference, pp.11-20
Fritsch, D., Khosravani, A.M., Cefalu, A., Wenzel, K., 2011. Multi-Sensors and Multiray Reconstruction for Digital Preservation. In: Photogrammetric Week 2011, Berlin, Germany, pp. 305–323
Forkuo, E., King, B., 2004. Automatic fusion of photogrammetric imagery and laser scanner point clouds. In: The International Archives of Photogrammetry and Remote Sensing and Spatial Information Sciences, Istanbul, Turkey, Vol. XXXV, Part. B4, pp. 921-926
Hullo, J.F., Grussenmeyer P., Fares S., 2009. Photogrammetry and dense matching approach applied to the documentation of the cultural heritage site of Kilma (Saudi Arabia). In: CIPA 2209 XXII International Symposium, Kyoto, Japan.
Moussa, W., Abdel-Wahab, M., Fritsch, D., 2012. An Automatic Procedure for Combining Digital Images and Laser Scanner Data. In: The International Archives of the Photogrammetry, Remote Sensing and Spatial Information Sciences; Melbourne, Australia, Vol. XXXIX, Part B5, pp. 229–234.
Nex, F., Remondino, F, 2011. Range and image data integration for man-made object reconstruction. In: The International Archives of Photogrammetry, Remote Sensing and Spatial Information Sciences, Munich, Germany, 38(3/W22), on CD-Rom, pp. 149–154
Patias, P., Santana, M., 2012. Introduction to heritage documentation. In: CIPA heritage documentation best practices and applications, Series 1, 2007-2009, pp. 9-13.
Rinaudo, F., Chiabrando, F., Lingua, A., Spanò, A., 2012. Archaeological site monitoring: UAV photogrammetry can be an answer. In: The International Archives of Photogrammetry and Remote Sensing and Spatial Information Sciences, Melbourne, Australia, Vol. XXXIX, Part. B5, pp .583-588
Wenzel, K., Abdel-Wahab, M., Cefalu, A., Fritsch D., 2012. High-Resolution Surface Reconstruction from Imagery for Close Range Culture Heritage Applications. In: The International Archives of the Photogrammetry, Remote Sensing and Spatial Information Sciences, Melbourne, Australia, Vol. XXXIX, Part B5, pp. 133–138.
6. AKNOWLEDGEMENTS