Rob Mitchell,* John Fritz, Ken Moore, Lowell Moser, Ken Vogel, Daren Redfearn, and David Wester
ABSTRACT documented for switchgrass and big bluestem (Perry
and Baltensperger, 1979; George and Hall, 1983; Griffin Predicting forage quality would help producers schedule hay
har-and Jung, 1983; Mitchell et al., 1994a). However, most vesting to obtain desired hay quality. Our objective was to determine
if growing degree day (GDD), day of the year (DOY), mean stage of the studies that have evaluated changes in forage count (MSC), and mean stage weight (MSW) could be used to predict quality have been comparisons of switchgrass and big in vitro digestible dry matter (IVDDM), crude protein (CP), and bluestem on specific DOYs or at generalized vegetative neutral-detergent fiber (NDF) of ‘Trailblazer’ switchgrass (Panicum or reproductive stages. No studies have been conducted virgatum.) and ‘Pawnee’ big bluestem (Andropogon gerardiiVitman) where changes in the forage quality of switchgrass and grown in Nebraska and Kansas. This field study was conducted from big bluestem have been documented with quantified 1990 to 1993 at Mead, NE on Typic Argiudoll soils and from 1992 to
changes in morphological development. 1993 at Manhattan, KS on Aquic Argiudoll soils. Plants were sampled
The morphological development of perennial grasses at 1-wk intervals in 1990 and 1991 and at 2-wk intervals in 1992 and
is an important consideration when making forage man-1993. They were morphologically classified as MSC and MSW and
agement decisions (Kalu and Fick, 1983; Moore and analyzed for IVDDM, CP, and NDF. Switchgrass IVDDM and CP
were best predicted by GDD models, which accounted for 86 and Moser, 1995). Plant maturity is the primary factor affect-91% of the variation, respectively, whereas NDF was best predicted ing the morphological development and forage quality by MSC and MSW. Big bluestem IVDDM was best predicted by within a species (Kalu and Fick, 1983; Nelson and Moser, MSW and CP was best predicted by GDD, which both accounted for 1994). A system for quantifying the morphological de-90% of the variation. Mean stage weight accounted for 74% of the velopment of perennial grasses based on the MSC and variability in big bluestem NDF. The DOY model adequately
pre-MSW was developed by Moore et al. (1991). This system dicted forage quality due primarily to the determinate growth habit
was used to quantify the morphological development of these species. Morphological development accurately predicted
of switchgrass and big bluestem in Nebraska and Kansas forage quality in many instances. Although no universal parameter
(Mitchell et al., 1997) and differentiate the develop-adequately predicted concentrations of IVDDM, CP, and NDF, it
mental stages in weeping lovegrass [Eragrostis curvula was possible to accurately predict quality with readily available
envi-ronmental data and measures of plant maturity. (Schrad.) Nees] in Texas (McFarland and Mitchell, 2000). A knowledge of the forage quality relationships with morphological development may aid in making planning decisions such as when to harvest hay or graze
T
he forage quality of warm-season grassesisini-pastures (Hill et al., 1995). tially moderate to high but declines rapidly with
Forage quality should be matched to animal require-maturity (Perry and Baltensperger, 1979; Griffin and
ments. Systems for quantifying the relationships be-Jung, 1983; Mitchell et al., 1994a). Switchgrass and big
tween the morphological stage of development and for-bluestem are perennial, warm-season grasses that are
age quality have been successfully developed for alfalfa native to the central Great Plains. These grasses are
(Medicago sativa L.) (Kalu and Fick, 1981; Kalu and photoperiod sensitive (Benedict, 1941) and determinate
Fick, 1983). However, in perennial, cool-season grasses in growth habit. Switchgrass has an erect growth form
such as tall fescue (Festuca arundinacea Schreb.), the with leaves evenly distributed throughout the canopy,
morphological development was a poor predictor of whereas big bluestem maintains numerous basal leaves
the forage quality (Hill et al., 1995). Predicting forage (Moser and Vogel, 1995). Switchgrass and big bluestem
quality changes based on accumulated GDD, DOY, or have become increasingly important as pasture grasses
developmental morphology would provide valuable in-in the central and eastern USA because they are
produc-formation for estimating animal performance or pre-tive during the hot summer months when cool-season
dicting potential forage quality losses associated with grasses are relatively unproductive (Moser and Vogel,
delaying harvest (Hill et al., 1995). The objective of this 1995). Changes in the concentrations of IVDDM, CP,
study was to determine if the GDD, DOY, MSC, and and NDF throughout the growing season have been well
MSW could be used to predict the forage quality for switchgrass and big bluestem grown in several environ-R. Mitchell and D. Wester, Dep. of Range, Wildlife, and Fisheries
Management, Texas Tech Univ., Lubbock, TX 79409; J. Fritz, Dep. ments in the central Great Plains. of Agron., Kansas State Univ., Manhattan, KS 66506; K. Moore, Dep.
of Agron., Iowa State Univ., Ames, IA 50011; L. Moser, Dep. of MATERIALS AND METHODS Agron., Univ. of Nebraska, Lincoln, NE 68583; K. Vogel,
USDA-ARS, Dep. of Agron., Univ. of Nebraska, Lincoln, NE 68583; and D. Prediction Equation Development
Redfearn, Louisiana State Univ. Agric. Cent., Southeast Res. Stn.,
Pure stands of Trailblazer switchgrass and Pawnee big
blue-Franklinton, LA 70438. Joint contribution of the Univ. of Nebraska,
stem were seeded in 1986 as a randomized complete block
Lincoln Agric. Res. Division, Journal Ser. no. 12039; Kansas State Univ., Contribution no. 96-117-J; and Texas Tech Univ., T-9-791.
Abbreviations:CP, crude protein; DOY, day of the year; GDD, grow-Received 25 Feb. 2000. *Corresponding author (rob.mitchell@
ing degree days; IVDDM, in vitro digestible dry matter; MSC, mean ttu.edu).
stage count; MSW, mean stage weight; NDF, neutral-detergent fiber; RMSE, root mean square error.
Published in Agron. J. 93:118–124 (2001).
MITCHELL ET AL.: PREDICTING FORAGE QUALITY IN SWITCHGRASS AND BIG BLUESTEM 119
split-plot with six replicates on a Sharpsburg silty clay loam into six subplots (1.7 by 2.5 m) that were randomly assigned for each harvest date. The same field sampling procedure soil (fine, montmorillonitic, mesic, Typic Argiudoll) at the
University of Nebraska Agricultural Research and Develop- used for the collection of prediction samples was used for the validation samples. Vegetation on the plots to be harvested ment Center near Mead, NE (418119 N, 968339 W). Whole
plots (1.2 by 4.6 m) were species and subplots were harvests. in 1993 remained undisturbed throughout the 1992 growing season. In 1993, the previously nonharvested portion of each Standing dead material was mowed to a 2-cm stubble height,
and residue was removed before the initiation of spring growth whole plot was divided into six subplots and randomly assigned for each harvest date. Standing dead material was mowed to each year. Nitrogen was applied in late May 1990 and 1991
at 110 kg N ha21. Plots were hand-weeded throughout the a 2-cm stubble height and residue was removed before the
initiation of spring growth. Nitrogen was applied in late May growing season.
The tillers used for morphological classification were hand- 1992 and 1993 at 110 kg N ha21. In Nebraska, switchgrass and
big bluestem were harvested on 20 May, 3 and 17 June, 2 and clipped at ground level from 0.09-m2quadrats that were
ran-domly located within each whole plot. The tillers were trans- 14 July, and 12 Aug. 1992 and 1993. In Kansas, both species were harvested on 19 May, 4 and 19 June, 1 and 14 July, and ported to the laboratory and morphologically classified using
the system described by Moore et al. (1991). Quantitative 10 Aug. 1992. The harvest dates in 1993 were 10 and 25 June, 12 and 22 July, and 6 and 18 August. Plants were hand-clipped indices of developmental morphology were assigned at the
conclusion of each growing season based on the total number and morphologically classified as MSC and MSW, and forage quality analyses were conducted in the same manner as the of events in the vegetative and elongation stages. The MSC
and MSW were determined for each species at each harvest calibration study.
The concentrations of IVDDM, CP, and NDF in validation date to quantify the developmental morphology of the tiller
populations. The accumulated GDD were calculated as the samples were predicted using the regression equations for accumulated GDD, DOY, MSC, and MSW developed from sum of the difference between the mean daily temperature
and a base temperature of 108C after 1 January. the calibration study. The predicted forage quality values (Y) were regressed against the actual laboratory forage quality The first growth of switchgrass and big bluestem were
sam-pled at approximately 7-d intervals beginning 6 June and con- values (X) of the replicate means from the validation sample set for each species across environments using the PROC cluding 6 Sept. 1990 and beginning 22 May and concluding 3
Sept. 1991. Whole-plant samples used for the IVDDM, CP, REG procedure of SAS (SAS Inst., 1985). The goodness of fit for each model was determined by evaluating the coefficient and NDF were clipped to ground level from 0.25-m2quadrats,
sorted to remove dead tissue, oven-dried to a constant weight of determination, root mean square error (RMSE), slope, and intercept of the regression line describing the relationship at 558C, and ground to pass a 1-mm screen. Concentrations
of the IVDDM were determined using the inoculation and between the predicted and actual forage quality values. The intercepts were evaluated to determine if they differed from direct acidification procedure described by Marten and Barnes
(1980). Rumen fluid was collected from two cannulated steers 0 (P50.05) and if the slopes differed from 1 (P50.05).
(Bos taurus); one was maintained on an alfalfa hay diet and
the other on a corn (Zea maysL.) cob diet. The rumen fluid
RESULTS AND DISCUSSION
from each cannulated steer was mixed in a 1:1 ratio (vol./vol.),Environmental Conditions
and the rumen fluid mixture was combined with a buffer containing 1 g L21urea [(NH
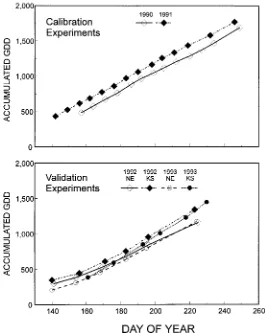
2)2CO] in a 1:1 ratio (vol./vol.). The accumulated GDD appeared greater in 1991 than
Crude protein was quantified using the Kjeldahl procedure
in 1990 (Fig. 1). The accumulated GDD in Nebraska
for N determination (g kg21CP
5g kg21N
36.25; AOAC,
appeared similar throughout the 1992 and 1993 growing
1990). The NDF concentration was determined according to
seasons; similar GDD accumulations were observed in
Goering and Van Soest (1970).
Kansas during the 1992 and 1993 growing seasons (Fig.
The accumulated GDD, DOY, MSC, and MSW were
in-1). However, the accumulated GDD at the conclusion
cluded as independent variables. Linear, quadratic, and cubic
effects were evaluated, with replicate means of the indices of of sampling in Kansas were at least 15% greater in 1992
forage quality as dependent variables of the pooled data set and 1993 than those accumulated in Nebraska by the
for each species from 1990 and 1991 using the PROC REG same date. Additionally, accumulated GDD for the cali-procedure of SAS (SAS Inst., 1985). Data from 1990 and 1991 bration experiments were approximately 10% higher were pooled so that the calibration data set represented a than those accumulated during the validation exper-broad range of environmental conditions. Higher-order equa- iments.
tions were selected based on the significance (P5 0.10) of
The long-term average annual precipitation at Mead,
additional coefficients.
NE is 680 mm, with 500 mm occurring between 1 April and 1 October. The annual precipitation was near or Validation of Prediction Equations exceeded the long-term average at Mead, NE in 1990, 1991, 1992, and 1993, totaling 687, 780, 658, and 859
The validation study was conducted in 1992 and 1993 at
the University of Nebraska Agricultural Research and Devel- mm, respectively. The long-term average annual
precip-opment Center near Mead, NE and the Kansas State Univer- itation at Manhattan, KS is 860 mm, with 600 mm
oc-sity Agronomy North Farm near Manhattan, KS (398119 N, curring between 1 April and 1 October. The annual 968339 W). Validation plots for Trailblazer switchgrass and precipitation in Manhattan, KS during 1992 and 1993 Pawnee big bluestem were established in 1991 on a Sharpsburg was above the long-term average, with 1053 and 1264 silty clay loam soil in Nebraska and on a Wymore silty clay mm occurring each year, respectively.
loam soil (fine, montmorillonitic, mesic, Aquic Argiudoll) in
Kansas as randomized complete blocks arranged as split-plots
Fit of Calibration Equations
with three replicates. Whole plots (5 by 10 m) were speciesThe regression equations for predicting the
switch-and were divided into two equal portions (5 by 5 m). In 1992,
Fig. 1. Accumulated growing degree days (GDD) for calibration and validation studies near Mead, NE in 1990, 1991, 1992, and 1993 and Manhattan, KS in 1992 and 1993.
MSW had coefficients of determination$0.92 and low model gave nearly as good of fit (r250.94). The
whole-plant IVDDM ranged from 295 to 746 g kg21 for
RMSE statistics (Table 1). However, the regression
equations for predicting the switchgrass NDF from the switchgrass and 275 to 695 g kg21 for big bluestem.
As the growing season progressed, the whole-plant GDD, DOY, MSC, and MSW had coefficients of
deter-mination#0.70. The regression equations for predicting IVDDM declined by an average of 4 g kg21d21for both
switchgrass and big bluestem. The decline in switchgrass the big bluestem IVDDM and CP from the GDD, DOY,
MSC, and MSW had coefficients of determination$0.83 and big bluestem IVDDM as the growing season pro-gressed was consistent with previous research in the and low RMSE statistics. The regression equations for
predicting the big bluestem NDF from the GDD, DOY, central Great Plains (Perry and Baltensperger, 1979; Mitchell et al., 1994a). The concentrations of IVDDM MSC, and MSW had coefficients of determination#0.75
and were generally higher than for switchgrass (Table in switchgrass were generally greater than those ob-served for big bluestem on common days of the year, 1). The calibration equations with the highest coefficient
of determination and lowest RMSE for the IVDDM, which was similar to previous research (George and Hall, 1983).
CP, and NDF based on the GDD, DOY, MSC, or MSW
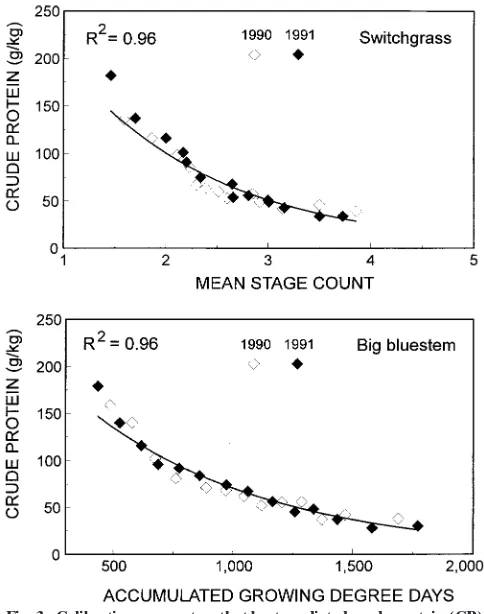
were plotted for both species (Fig. 2, 3, and 4). In many The switchgrass CP calibration data was best pre-dicted by a quadratic MSC model, which accounted for cases, the linear models accounted for less variability
than the quadratic or cubic models. However, where 96% of the variability in the CP (Fig. 3), whereas a linear MSC model accounted for only 80% of the variability in the linear models provide reasonable results, data from
the linear models are discussed to provide a simpler the CP. The switchgrass CP was predicted nearly as well by GDD, DOY, and MSW models (Table 1); therefore, interpretation of the data and may have additional
util-ity for predicting qualutil-ity parameters. a DOY equation would be the easiest to use. The big bluestem CP calibration data were better predicted by The switchgrass IVDDM calibration data was best
predicted by a quadratic DOY model, which accounted a quadratic model based on accumulated GDD than any other model (Table 1). The quadratic accumulated for 96% of the variability in the IVDDM (Fig. 2),
whereas a linear DOY model accounted for 91% of the GDD model accounted for 96% of the variability in the CP (Fig. 3), whereas a linear GDD model accounted variability in the IVDDM. The big bluestem IVDDM
calibration data was best predicted by a linear accumu- for only 84% of the variability in the CP. The whole-plant CP ranged from 34 to 182 g kg21for switchgrass
MITCHELL ET AL.: PREDICTING FORAGE QUALITY IN SWITCHGRASS AND BIG BLUESTEM 121
Table 1. Calibration equations, coefficients of determination, and root mean square errors (RMSE) for predicting forage quality with day of the year (DOY), accumulated growing degree day (GDD), mean stage count (MSC), and mean stage weight (MSW) for switchgrass and big bluestem grown near Mead, NE in 1990 and 1991.
Quality parameter Calibration equations Coefficient of determination RMSE
g kg21
Switchgrass
IVDDM† 1059.9920.81(GDD)10.0002(GDD2) 0.95 28
2398.03215.68(DOY)10.03(DOY2) 0.96 27
1387.842507.26(MSC)160.5(MSC2) 0.92 38
1439.612518.17(MSW)161.22(MSW2) 0.92 36
CP‡ 263.8520.30(GDD)10.0001(GDD2) 0.95 9
879.3827.29(DOY)10.016(DOY2) 0.95 9
421.332221.04(MSC)131.84(MSC2) 0.96 8
414.052202.05(MSW)127.01(MSW2) 0.94 9
NDF§ 540.4210.37(GDD)20.0001(GDD2) 0.49 31
23253.96156.51(DOY)20.26(DOY2)
10.0004(DOY3) 0.70 25
389.361246.60(MSC)240.03(MSC2) 0.45 33
405.361218.76(MSW)232.75(MSW2) 0.43 33
Big bluestem
IVDDM 835.0220.33(GDD) 0.97 23
1281.3224.05(DOY) 0.94 32
1381.662677.42(MSC)1105.41(MSC2) 0.92 38
1126.222397.86(MSW)146.53(MSW2) 0.93 35
CP 277.3220.31(GDD)10.0001(GDD2) 0.96 9
868.9927.05(DOY)10.015(DOY2) 0.92 12
439.852304.80(MSC)156.08(MSC2) 0.83 17
352.812200.94(MSW)131.22(MSW2) 0.87 15
NDF 602.9610.19(GDD)20.00006(GDD2) 0.70 20
537.2010.84(DOY) 0.52 25
504.131179.54(MSC)228.72(MSC2) 0.75 18
269.21509.5(MSW)2180.4(MSW2)
121.7(MSW3) 0.75 18
† IVDDM, in vitro digestible dry matter. ‡ CP, crude protein.
§ NDF, neutral-detergent fiber.
and 28 to 179 g kg21 for big bluestem and declined as
the growing season progressed. Previous research has reported similar declines in the switchgrass and big blue-stem CP with the progression of the growing season (Griffin and Jung, 1983). The switchgrass CP has been reported to be lower than big bluestem on common DOYs (Griffin and Jung, 1983). However, when the switchgrass and big bluestem CP were compared across all environments in the current study, no differences (P . 0.10) were found, which indicates the need to further evaluate quality differences in switchgrass and big bluestem.
The switchgrass NDF calibration data was best pre-dicted by a cubic DOY model, which accounted for 70% of the variability in the NDF (Fig. 4), whereas a quadratic DOY model accounted for 63% of the vari-ability in the NDF. Throughout the growing season, the switchgrass whole-plant NDF ranged from 637 to 819 g kg21. The big bluestem NDF calibration data was best
predicted by quadratic MSC and cubic MSW models, both which accounted for 75% of the variability in the NDF (Fig. 4). A linear MSC model accounted for 68% of the variability in the NDF, and a quadratic MSW model accounted for 70% of the variability in the NDF. Throughout the growing season, the big bluestem whole-plant NDF ranged from 646 to 791 g kg21.
Predicted vs. Actual Equations
A perfect agreement between predicted and actual
forage quality data would require an intercept of 0.0 Fig. 2. Calibration parameters that best predicted in vitro digestible (no bias), a linear coefficient equal to 1.0, anr2equal
Fig. 3. Calibration parameters that best predicted crude protein (CP) concentration for switchgrass and big bluestem grown near Mead,
NE in 1990 and 1991. Equation of the line is given in Table 1. Fig. 4. Calibration parameters that best predicted neutral-detergent fiber (NDF) concentration for switchgrass and big bluestem grown near Mead, NE in 1990 and 1991. Equation of the line is given in The best prediction equations for switchgrass and big Table 1.
bluestem were determined by evaluating ther2, RMSE,
intercept, and linear coefficient of each validation
equa-the variation associated with equa-the NDF in Nebraska and tion (Tables 2 and 3). Of the calibration equations
iden-Kansas and had low RMSE statistics of 18 g kg21. The
tified as having the best fits for the IVDDM, CP, and
GDD and DOY equations had lower coefficients of NDF of switchgrass and big bluestem (Table 1), only
determination (r25 0.73 and 0.71) and higher RMSEs
the GDD model for the big bluestem CP was also the
(40 and 36 g kg21). The GDD and DOY have been
best equation for comparing predicted and actual values
reported to be better predictors of the forage fiber com-(Table 3).
ponents than the morphological development in cool-The switchgrass IVDDM and CP were best predicted
season grasses (Hill et al., 1995). The biological premise by the GDD regression equations across environments,
is that increasing temperature generally increases the accounting for at least 86% of the variation in forage
cell wall component of grasses (Van Soest, 1982). Conse-quality (Table 2). However, the DOY, MSC, and MSW
quently, the incorporation of temperature in the GDD equations all had high coefficients of determination
calculation helps explain cell wall deposition. However, (r2 $ 0.76) and reasonable RMSEs (#74 g kg21) for
based on the coefficient of determination, the switch-predicting the IVDDM. The GDD equation accounted
grass NDF did not respond to the GDD in as predictable for 86% of the variation associated with the IVDDM
a manner as previous observations with cool-season in Nebraska and Kansas and had an RMSE of 67 g kg21.
grasses but was best predicted by the morphological de-The switchgrass CP was also well predicted by the DOY,
velopment. MSC, and MSW equations, which had high coefficients
The big bluestem IVDDM was best predicted by the of determination (r2 $ 0.82) and low RMSEs (#20 g
MSW regression equation across environments (r2 5
kg21), indicating that switchgrass CP follows very
pre-0.90; Table 3). However, the GDD, DOY, and MSC dictable patterns throughout the growing season. From
equations all had high coefficients of determination a managerial aspect, the DOY may be the best general
(r2$0.86) and low RMSEs (44 g kg21). The big bluestem
predictor of the IVDDM and CP, whereas predictions
CP was best predicted by the GDD regression equation based on GDD may be more accurate within a large
across environments (Table 3). The coefficient of deter-geographic region. The switchgrass NDF was best
pre-mination for the GDD equation was considerably higher dicted by MSC and MSW regression equations, which
than for all other equations. The GDD equation ac-were similar across environments. The MSC and MSW
MITCHELL ET AL.: PREDICTING FORAGE QUALITY IN SWITCHGRASS AND BIG BLUESTEM 123
Table 2. Validation of the switchgrass calibration equations for forage quality parameters (g kg21) based on accumulated growing degree
day (GDD), day of the year (DOY), mean stage count (MSC), and mean stage weight (MSW) models for switchgrass grown near Mead, NE and Manhattan, KS in 1992 and 1993 (n524). Parenthetic values following intercepts and linear coefficients are theP
values for the intercept50 test and slope51 test, respectively.
Quality parameter Model type Intercept Linear coefficient r2† RMSE‡
IVDDM§ GDD 218.1 (0.75) 1.14 (0.18) 0.86 67
DOY 120.1 (0.04) 0.80 (0.05) 0.76 66
MSC 35.6 (0.51) 0.97 (0.74) 0.83 65
MSW 42.1 (0.49) 0.96 (0.70) 0.78 74
CP¶ GDD 227.0 (0.01) 1.32 (0.01) 0.91 15
DOY 211.1 (0.33) 1.01 (0.92) 0.82 18
MSC 236.4 (0.01) 1.26 (0.02) 0.87 18
MSW 235.2 (0.01) 1.24 (0.05) 0.84 20
NDF# GDD 296.3 (0.39) 1.12 (0.42) 0.73 40
DOY 92.5 (0.35) 0.65 (0.66) 0.71 36
MSC 231.4 (0.01) 0.66 (0.01) 0.82 18
MSW 227.6 (0.01) 0.67 (0.01) 0.83 18
† Coefficient of simple determination. ‡ Root mean square error.
§ IVDDM, in vitro digestible dry matter. ¶ CP, crude protein.
# NDF, neutral-detergent fiber.
and had an RMSE of 18 g kg21. The DOY regression bluestem (Table 3). However, the accumulated GDD
or DOY often provided reasonable forage quality pre-equation also had a high coefficient of determination
and low RMSE, but it did not predict CP as well as the dictions. The DOY adequately predicted the forage quality parameters for both species in the validation GDD equation. For the NDF, the cubic MSW equation
accounted for 74% of the variation. The GDD, DOY, study due primarily to the photoperiod sensitivity of both species and the general predictability of weather and MSC equations had lower coefficients of
determina-tion and RMSEs and linear coefficients that were differ- patterns (i.e., rainfall and temperature). From a forage quality perspective, these data are contrary to the gen-ent than 1.0.
The GDD or DOY regression equations were gener- eral recommendation to manage these species based on the status of the plant instead of the calendar date ally better predictors of the forage quality of switchgrass
and big bluestem than the MSC or MSW regression (Mitchell et al., 1994b). It is unlikely that forage quality predictions based on DOY equations developed in the equations. The MSW was a better predictor of the
for-age quality of big bluestem than the MSC (Table 3). central Great Plains would be appropriate in the north-ern and southnorth-ern extremes of the species range. Varia-The MSW is based on the weight of individual tillers,
whereas the MSC is a weighted average of all of the tions in the photoperiod and adapted cultivars would make forage quality estimations difficult on the species tillers present (Kalu and Fick, 1981). Because mature
big bluestem tillers weighed more than juvenile tillers level. However, GDD models are more likely than DOY models to be applicable for adapted cultivars over large (data not shown), the MSW incorporated the dilution
of forage quality by the mature tillers, and therefore geographic regions. Incorporating additional environ-mental variables such as hours of above-horizon sun-was a better predictor of the big bluestem IVDDM, CP,
and NDF than the MSC (Kalu and Fick, 1981). light, radiant energy, wind speed, or deviation between pan evaporation and precipitation to GDD may increase No single variable was able to consistently predict the
IVDDM, CP, and NDF for switchgrass (Table 2) or big the precision of forage quality estimates across
numer-Table 3. Validation of the big bluestem calibration equations for forage quality parameters (g kg21) based on accumulated growing
degree day (GDD), day of the year (DOY), mean stage count (MSC), and mean stage weight (MSW) models for big bluestem grown near Mead, NE and Manhattan, KS in 1992 and 1993 (n524). Parenthetic values following intercepts and linear coefficients are the
Pvalues for the intercept50 and slope51 test, respectively.
Quality parameter Model type Intercept Linear coefficient r2† RMSE‡
IVDDM§ GDD 88.5 (0.06) 0.92 (0.29) 0.87 44
DOY 41.8 (0.36) 0.90 (0.24) 0.86 44
MSC 55.4 (0.22) 0.90 (0.22) 0.86 44
MSW 66.6 (0.08) 0.88 (0.07) 0.90 35
CP¶ GDD 239.5 (0.01) 1.60 (0.01) 0.90 18
DOY 226.6 (0.05) 1.23 (0.08) 0.81 20
MSC 8.3 (0.59) 0.89 (0.46) 0.62 23
MSW 5.3 (0.71) 0.91 (0.52) 0.67 21
NDF# GDD 197.4 (0.01) 0.69 (0.01) 0.70 19
DOY 350.7 (0.01) 0.46 (0.01) 0.65 14
MSC 313.0 (0.01) 0.56 (0.01) 0.63 18
MSW 298.4 (0.01) 0.58 (0.01) 0.74 15
† Coefficient of simple determination. ‡ Root mean square error.
§ IVDDM, in vitro digestible dry matter. ¶ CP, crude protein.
Goering, H.K., and P.J. Van Soest. 1970. Forage fiber analyses (appa-ous environments (Onstad and Fick, 1983; Hill et al.,
ratus, reagents, procedures, and some applications). Agric. Handb. 1995).
379. USDA-ARS, Washington, DC.
The morphological development provided reasonable Griffin, J.L., and G.A. Jung. 1983. Leaf and stem quality of big blue-predictions for several forage quality parameters in stem and switchgrass. Agron. J. 75:723–726.
Hill, N.S., M.L. Cabrera, and C.S. Agee. 1995. Morphological and switchgrass and big bluestem. The developmental
mor-climatological predictors of forage quality in tall fescue. Crop phology of switchgrass and big bluestem occurs in a very
Sci. 35:541–549.
predictable manner, and it increased linearly with the Kalu, B.A., and G.W. Fick. 1981. Quantifying morphological develop-DOY across six environments in Nebraska and Kansas ment for studies of herbage quality. Crop Sci. 21:267–271.
Kalu, B.A., and G.W. Fick. 1983. Morphological stage of development (Mitchell et al., 1997). Although predictable, the
mor-as a predictor of alfalfa herbage quality. Crop Sci. 23:1167–1172. phological development of a plant, as quantified by the
Marten, G.C., and R.F. Barnes. 1980. Prediction of energy digestibility MSC and MSW, is a biological phenomenon and
re-of forages with in vitro rumen fermentation and fungal enzymes sponds to macroenvironmental and microenvironmen- systems. p. 61–71.InW.J. Pigden et al. (ed.) Standardization of tal factors. It is not surprising that the mean of a response analytical methodology for feeds. Proc. Int. Workshop, Ottawa, Canada. 12–14 Mar. 1979. Int. Res. and Dev. Cent. Rep. 134e. variable (plant development) does not consistently and
Unipub, New York. accurately predict another response variable (forage
McFarland, J.B., and R.B. Mitchell. 2000. Fire effects on weeping quality). The MSC and MSW integrate the tiller develop- lovegrass tiller density and demographics. Agron. J. 92:42–47. ment over a range of stages in tiller populations. Future Mitchell, R.B., R.A. Masters, S.S. Waller, K.J. Moore, and L.E. Moser.
1994a. Big bluestem production and forage quality response to research needs to evaluate if separating and analyzing
burning date and fertilizer in tallgrass prairie. J. Prod. Agric. tillers by developmental stage improves the predictability
7:355–359. of forage quality parameters. It is likely that the tiller age
Mitchell, R.B., K.J. Moore, L.E. Moser, J.O. Fritz, and D.D. Redfearn. within a developmental stage impacts the forage quality in 1997. Predicting developmental morphology in switchgrass and big a similar manner to tiller maturity. Although morpholog- bluestem. Agron. J. 89:827–832.
Mitchell, R.B., L.E. Moser, B.E. Anderson, and S.S. Waller. 1994b. ical development accurately predicted the forage quality
Switchgrass and big bluestem for grazing and hay. Univ. of Ne-in many Ne-instances, the greatest utility to the scientific
braska Coop. Ext. Serv. NebGuide G94-1198-A.
community in collecting standardized morphological de- Moore, K.J., and L.E. Moser. 1995. Quantifying developmental mor-velopment (MSC or MSW) data may be in communicat- phology of perennial grasses. Crop Sci. 35:37–43.
ing population growth stage data that is precise and Moore, K.J., L.E. Moser, K.P. Vogel, S.S. Waller, B.E. Johnson, and J.F. Pedersen. 1991. Describing and quantifying growth stages of numerically quantified, rather than presenting DOY or
perennial forage grasses. Agron. J. 83:1073–1077. qualitative maturity estimates. Even though no
univer-Moser, L.E., and K.P. Vogel. 1995. Switchgrass, big bluestem, and sal parameter was able to adequately predicted the con- indiangrass. p. 409–420.InR.F. Barnes et al. (ed.) Forages: An centrations of IVDDM, CP, and NDF in switchgrass introduction to grassland agriculture. 5th ed. Iowa State Univ. and big bluestem, it was possible to accurately predict Press, Ames.
Nelson, C.J., and L.E. Moser. 1994. Plant factors affecting forage quality with readily available environmental data and
quality. p. 115–154.InG.C. Fahey, Jr. et al. (ed.) Forage quality, measures of plant maturity.
evaluation, and utilization. ASA, CSSA, and SSSA, Madison, WI. Onstad, D.W., and G.W. Fick. 1983. Predicting crude protein, in vitro
REFERENCES true digestibility, and leaf proportion in alfalfa herbage. Crop
Sci. 23:961–964. AOAC. 1990. Official methods of analysis. 15th ed. AOAC,
Arling-Perry, L.J., Jr., and D.D. Baltensperger. 1979. Leaf and stem yields ton, VA.
and forage quality of three N-fertilized warm-season grasses. Agron Benedict, H.M. 1941. Effect of day length and temperature on the
J. 71:355–358. flowering and growth of four species of grasses. J. Agric. Res.
SAS Institute 1985. SAS user’s guide: Statistics. 5th ed. SAS Inst., 61:661–672.
Cary, NC. George, J.R., and K.E. Hall. 1983. Herbage quality of three
warm-Van Soest, P.J. 1982. Nutritional ecology of the ruminant. O and B season grasses with nitrogen fertilization. Iowa State J. Res. 58: