GEOLGICAL STRUCTURE MAPPING OF THE BENTONG-RAUB SUTURE
ZONE, PENINSULAR MALAYSIA USING PALSAR REMOTE SENSING DATA
Amin Beiranvand Pour*, Mazlan Hashim Geoscience and Digital Earth Centre (Geo-DEC) Research Institute for Sustainability and Environment (RISE)
Universiti Teknologi Malaysia (UTM) 81310 UTM Skudai, Johor Bahru, Malaysia
*Corresponding author: [email protected] Commission VI, WG VI/4
KEY WORDS: PALSAR data; structural geology mapping; Bentong-Raub Suture Zone; tropical environments
ABSTRACT:
The Bentong-Raub Suture Zone (BRSZ) of peninsular Malaysia was selected as case study to evaluate the capability of the Phased Array type L-band Synthetic Aperture Radar (PALSAR) satellite remote sensing data for structural geology mapping in tropical environments. The structural elements in the BRSZ were enhanced using multi-polarization configuration of PALSAR data at a regional scale. Adaptive local sigma and directional filters were applied to PALSAR data for detailed structural mapping. Numerous tectonic lineaments with consistent variation in trend, length and density were detected in the study area. Structural analysis of the BRSZ reveals that two distinct parts can be defined, a western part affected mainly by ductile fabrics in the Cameron Highlands and an eastern part affected mainly by brittle deformation in the BRSZ. Ductile deformation indicates several generation of folding in the Cameron Highlands. Several faults, joints and fractures represent brittle deformation events in the BRSZ. The results of this study demonstrate the usefulness of PALSAR satellite remote sensing data for mapping geological structures in tropical environments.
1. INTRODUCTION
Structural geology mapping is one the most important analysis for hydrocarbon and mineral exploration and geotechnical investigations. Structural geology is the first stage to any regional geophysical and geochemical surveys aiming at identifying new mineralized provinces (Hashim et al., 2013; Pour and Hashim 2014, 2015). Structural geology mapping is at the core of geotechnical site assessment for bridges, dams, tunnels, nuclear reactors, waste disposals and etc. Therefore, geological study could not be conducted without the input of structural information for any study area. On satellite images, geological structures such as faults, fractures, folds, brittle and ductile shear zones and deformational events could be detected. for the Title and Abstract and in two columns for all subsequent text. All text should be single-spaced, unless otherwise stated. Left and right justified typing is preferred.
Numerous structural geology studies have been conducted in arid and semi-arid regions using optical and radar satellite data (Raharimahefa, and Kusky, 2007, 2009). The analysis of geological structures using optical satellite remote sensing data in tropical environments is complicated as a consequence of the vegetation cover, persistent cloud coverage and limited bedrock exposures.
Synthetic Aperture Radar (SAR) image data provide information different from that of optical sensors. SAR is an active microwave remote sensing system which can acquire data regardless of day or night time, cloud, haze or smoke over a region. Clouds are reasonably transparent to microwave providing measurements with almost any weather conditions.
Radar transmits and detects radiation between 2.0 to 100 cm, typically at 2.5-3.8 cm (X band), 4.0-7.5 cm (C band), and 15.0-30.0 cm (L band) (Campbell, 2007).
Phased Array type L-band Synthetic Aperture Radar (PALSAR) is a L-band SAR sensors with multi-mode observation function (Fine mode, Direct downlink, ScanSar mode, and Polarimetric mode). It has multi polarization configuration (HH, HV, VH, and VV), variable off-nadir angle (9.9 to 50.8 degrees), and switching spatial resolution (10 m, 30 m, 100 m for Fine, Polarimetric, and ScanSar modes, respectively) and swath width observation (30 km, 70 km, and 250-350 km for Polarimetric, Fine and ScanSar modes, respectively) (Igarashi, 2001). L-band SAR data can observe the forest’s underlying surface features as well as the canopy because of its penetration capability [9]. Thus, in tropical environments, L-band SAR data provide the possibility of obtaining more useable geological structure information.
In this study, PALSAR data were evaluated for structural geology mapping in tropical environments. Southeastern part of Bentong-Raub Suture Zone (BRSZ), Peninsular Malaysia (Fig. 1) was selected as case study. This study aims to detect geological structure elements such as faults, folds, fractures, brittle and ductile shear zones and deformational events in BRSZ using Polarimetric modes of PALSAR data.
ISPRS Annals of the Photogrammetry, Remote Sensing and Spatial Information Sciences, Volume II-2/W2, 2015 Joint International Geoinformation Conference 2015, 28–30 October 2015, Kuala Lumpur, Malaysia
This contribution has been peer-reviewed. The double-blind peer-review was conducted on the basis of the full paper.
Fig.1. Simplified geological map of the peninsular Malaysia.
2. MATERIALS AND METHODS
2.1 Geology of the study area
The north-south trending Bentong-Raub Suture Zone (BRSZ) extends from Thailand through Raub and Bentong to the east of Malacca, Peninsular Malaysia (Fig. 1). This suture represents the main Palaeo-Tethys Ocean that was destroyed by collision between the Sibumasu and Sukhothai continental terranes of Southeast Asia (Metcalf., 2013). The BRSZ has accommodated considerable strike-slip movement. The formation of the BRSZ was probably coeval with the emplacement of major faults. Many gold mines and prospects in the Peninsular Malaysia are associated with the major lineaments along the BRSZ.
2.2 PALSAR data
Two Polarimetric Mode Quad polarization Level 4.1 PALSAR scenes were obtained from the Earth and Remote Sensing Data Analysis Center (ERSDAC) Japan for southeastern part of the Bentong-Raub Suture Zone (BRSZ), Peninsular Malaysia. The images (PASL4100706061550471312030001 and PASL4100706061550391312030000) (Path/Row 485/7 and 485/8) were acquired on 6 June 2007. Polarimetric mode scenes have high accuracy orbit data with good quality, 25 m pixel spacing, 16 bits per pixel, 44km observation width in range direction, 73km observation width in azimuth direction, incident angle 24.0◦, and off-nadir angle of 21.5◦. The data are geo-reference and geo-coded. The PALSAR data were processed using the ENVI (Environment for Visualizing Images) version 4.8 software package in this study.
2.3 Data processing
Radar images are inherently corrupted by speckle. The presence of speckle in an image reduces the detectability of ground targets, obscures the spatial patterns of surface features and decreases the accuracy of automated image classification (Singhroy, 1992). In this study, the adaptive Local Sigma filter was selected and applied to accomplish speckle reduction and preserving both edges and features (Schowengert, 2007). Directional filters were applied to the PALSAR Local Sigma resultant image for edge enhancement and detailed identification of linear features. A linear filter is calculated in the spatial domain as a weighted sum of pixels within the moving window. Directional filters are used to enhance specific linear trends in an image. Directional filter is very useful for producing artificial effects suggesting tectonically controlled linear features [12]. Four principal Directional filters: N-S, E-W, NE-SE-W, and NW-SE with a 7*7 kernel size were applied to the resultant image. 7*7 kernel matrix was selected to enhance semi-smooth and smooth/rough features. Directional filter angles were adjusted as N-S: 0◦, E-W: 90◦, NE-SW: 45◦, and NW-SE: 135◦.
3. RESULTS AND DISCUSSION
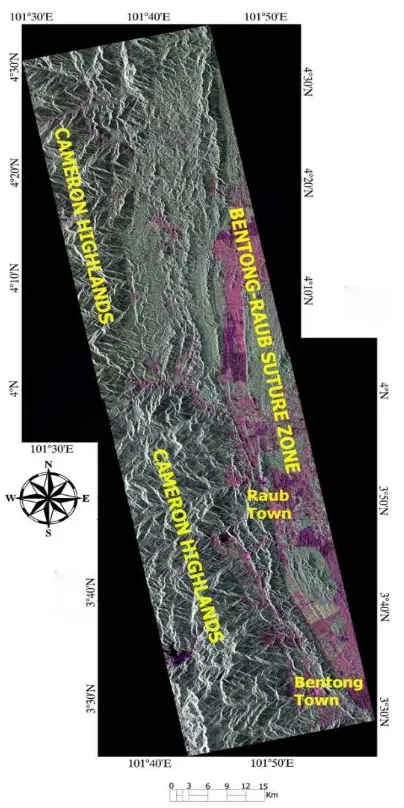
Local Sigma resultant images with different polarization configuration were assigned to RGB color-composite to provide visual interpretation of southeastern part of the Bentong-Raub Suture Zone. HH polarization image was assigned to red, HV polarization image was assigned to green, and VV polarization image was assigned to blue. Figure 2 shows RGB color-composite image generated from PALSAR polarimetry observation data. Major change in deformation style is obvious from the west to the east in the study area. Structural trends of the BRSZ and collision and compressional structures in the Cameron Highlands are identified. Main orientations in the BRSZ are N-S, NE-SW, and NW-SE. (Fig. 2). Structural analysis reveals that two distinct parts can be defined in the study area, a western part affected mainly by ductile fabrics in the Cameron Highlands and an eastern part affected mainly by brittle deformation in the BRSZ.
For detailed mapping of lineament structures in the Bentong-Raub Suture Zone, directional filters were applied to HH, HV, VH, and VV polarization images. It seems that HV polarization is more suitable for lineament extraction and edge enhancement than other polarization images. Geological structures are more recognizable after directional filtering in the HV polarization image. It is evident that cross polarization is more sensitive to lineament. Therefore, RGB color-composite was allocated to N-S, NE-SW, and NW-SE (R: 0◦, G: 45◦, B: 135◦) with filtering directions derived from the HV polarization image (Fig. 3). Two dominant directions can easily be identified, namely, N-S and NE-SW sets of lineaments (Fig. 3). More subtle lineaments strike approximately E-W and NW-SE. The continuous N-S striking lineament in the central to eastern part of the image corresponds to the boundary of the BRSZ. N-S trending structures of the BRSZ are apparent in Figure 3. The collision zone and compressional structures appear clearly in the Cameron Highlands. Generally, most of the lineaments are clustered in the western part of the image. These lines mostly strike NNE.
ISPRS Annals of the Photogrammetry, Remote Sensing and Spatial Information Sciences, Volume II-2/W2, 2015 Joint International Geoinformation Conference 2015, 28–30 October 2015, Kuala Lumpur, Malaysia
This contribution has been peer-reviewed. The double-blind peer-review was conducted on the basis of the full paper.
Fig. 2. RGB color combination of PALSAR polarimetric HH, HV and VV images, southeastern part of the Bentong-Raub Suture Zone.
Large scale structural features indicate ductile deformation dominated over fracturing in the Cameron Highlands (Fig. 3). Deformation in this region shows the shortening zone oriented parallel to the BRSZ. Some folding features with different axial plans and strik-slip faults are detected in this region. Folds types identified by structural analysis, including upright folds, overturned folds, recumbent folds and chevron (kink) folds. According to the axial plans of the folds, several deformation events occurred during the collision. It seems that the contractional strain affected the Cameron Highlands by sinistral shearing. N-S, NE-SW and NW-SE strike-slip faults often conjugated and they are sinistral and dextral with a maximal directed constraint N-S.
Faults, fractures and joints dominate the eastern of the image (Fig. 3). Several faults, joints and fractures represent brittle deformation events in the BRSZ. Reverse and strike-slip faults (sinistral) are common in this region. Some normal faults are also detected. Faults are divided into major groups, the first group are marked by long, old and well-exposed fractures that trend NW-SE and the second group are short and younger faults
that trend E-W and NE-SW. The younger faults cut older faults and some of them are perpendicular to the old fractures. It is
Fig.3. RGB image of N-S (0◦), NE-SW (45◦), and NW-SE (135◦) directional filters, southeastern part of the Bentong-Raub Suture Zone.
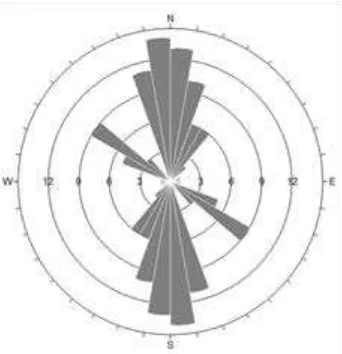
evident that the lineament structures in brittle zone are younger than ductile folding events in the western part of the region. Rose diagram was used in this study for the interpretation of the main direction of strike for each fault or fracture set (Fig.4). Rose diagram displays three major trends from 243 total lineaments mapped in study area. The dominant trend is N (N000-N010), (N010-N020), (N340-350) and (N350-360) direction. Two other important peaks are in NNE (N030-N040) and NW (N290-N300) directions. The N and NNE trends are mostly defined by faults, which dominate the eastern part of the study area. NW trend is interpreted as the axial traces of the folds in the western part of the study area.
Additionally, produced lineament maps using PALSAR data for selected regions was compared with the lineament maps produced by the Department of Minerals and Geoscience (GSM), it is found that most of the line matched to each other. Table 1 shows the number of lineament found on maps
ISPRS Annals of the Photogrammetry, Remote Sensing and Spatial Information Sciences, Volume II-2/W2, 2015 Joint International Geoinformation Conference 2015, 28–30 October 2015, Kuala Lumpur, Malaysia
This contribution has been peer-reviewed. The double-blind peer-review was conducted on the basis of the full paper.
produced using PALSAR data as compared to the number of lineament from maps produced by the Department of Minerals and Geoscience (GSM).
Table 1: Total number of lineaments from Maps Produced by the Department of Mineral & Geoscience (GSM).
No Region Total No. of Ridge Lineament
(Dept of GSM)
Total Ridge Lineament (PALSAR images)
Total Fracture Lineament
(Dept.of GSM)
Total Fracture Lineament (PALSAR images)
1. Bentong 725 702 111 98
2. Raub 467 402 353 324
4. CONCLUSIONS
In the present study, it is observed that PALSAR remote sensing satellite data provide comprehensive structural geology information for mineral exploration and geotechnical applications in tropical environments. Detailed structural geology study using PALSAR data has been conducted in the BRSZ, peninsular Malaysia. Numerous tectonic lineaments with consistent variation in trend, length and density were detected in the study area. Structural analysis indicates two distinct parts, a western part affected mainly by ductile fabrics in the Cameron Highlands and an eastern part affected mainly by brittle deformation in the BRSZ. N-S, NE-SW and NW-SE trending lineaments are mapped in the study area. Results of this study demonstrate the applicability of PALSAR remote sensing data for structural geology mapping in tropical environments.
Fig.4. Rose diagram (10◦ classes) shows the lineament distribution in the study area.
ACKNOWLEDGEMENTS
This study was conducted as a part of TRGS grant (Vote no: R.J130000.7809.4L837), Ministry of Higher Education (MOHE) Malaysia. We are thankful to the Universiti Teknologi Malaysia for providing the facilities for this investigation.
REFERENCES
Campbell, J.B., 2007. Introduction to remote sensing, The Guilford Press, New York.pp.134-147.
Igarashi, T., 2001. ALOS Mission requirement and sensor specification, Adv. Space Research, vol.28(1), pp. 127-131, Hashim, M. S. Ahmad, M.A.M. Johari, A.B Pour., 2013. Automatic lineament extraction in a heavily vegetated region using Landsat Enhanced Thematic Mapper (ETM+) imagery, Adv. Space Research, vol.51, pp. 874-890.
Metcalf, I., 2013. Tectonic evolution of Malay Peninsula. J. Asian Earth Sci, vol.76, pp. 195-213.
Pour, A.B., Hashim, M., 2015 Structural mapping using PALSAR data in the Central Gold Belt Peninsular Malaysia, Ore Geology Reviews, vol.64, pp. 13-22.
Pour, A.B., Hashim, M., 2014. Structural geology mapping using PALSAR data in the Bau gold mining district, Sarawak, Malaysia, Adv. Space Research, vol.54 (4), pp. 644-654, Raharimahefa, T. T.M Kusky, 2007. Stuctural and remote sensing studies of the southern Betsimisaraka Suture, Madagascar, Gond. Research, vol.10, pp. 186-197,
Raharimahefa, T. T.M Kusky, 2009. Stuctural and remote sensing analysis of the southern Betsimisaraka Suture in northeastern Madagascar, Gond. Research, vol.15, pp. 14-27, Singhroy, V.H., 1992. Radar geology: techniques and results,” Episods, vol.15 (1), pp. 15-20.
Schowengert, R.A.m, 2007. Remote sensing: models and methods for image processing,” 3rd ed, Burlington, M.A, Academic Press, Elsevier. pp. 229-243.
ISPRS Annals of the Photogrammetry, Remote Sensing and Spatial Information Sciences, Volume II-2/W2, 2015 Joint International Geoinformation Conference 2015, 28–30 October 2015, Kuala Lumpur, Malaysia
This contribution has been peer-reviewed. The double-blind peer-review was conducted on the basis of the full paper.