SEMANTIC WORLD MODELLING AND DATA MANAGEMENT
IN A 4D FOREST SIMULATION AND INFORMATION SYSTEM
J. Roßmann a, M. Hoppen a *, A. Bücken a
a
Institute for Man-Machine Interaction, RWTH Aachen University, 52074 Aachen, Germany (rossmann, hoppen, buecken)@mmi.rwth-aachen.de
KEY WORDS: Forestry, LIDAR, Databases, GIS, Automation, Inventory, Modelling, Simulation
ABSTRACT:
Various types of 3D simulation applications benefit from realistic forest models. They range from flight simulators for entertainment to harvester simulators for training and tree growth simulations for research and planning. Our 4D forest simulation and information system integrates the necessary methods for data extraction, modelling and management. Using modern methods of semantic world modelling, tree data can efficiently be extracted from remote sensing data. The derived forest models contain position, height, crown volume, type and diameter of each tree. This data is modelled using GML-based data models to assure compatibility and exchangeability. A flexible approach for database synchronization is used to manage the data and provide caching, persistence, a central communication hub for change distribution, and a versioning mechanism. Combining various simulation techniques and data versioning, the 4D forest simulation and information system can provide applications with “both directions” of the fourth dimension. Our paper outlines the current state, new developments, and integration of tree extraction, data modelling, and data management. It also shows several applications realized with the system.
* Corresponding author.
1. INTRODUCTION
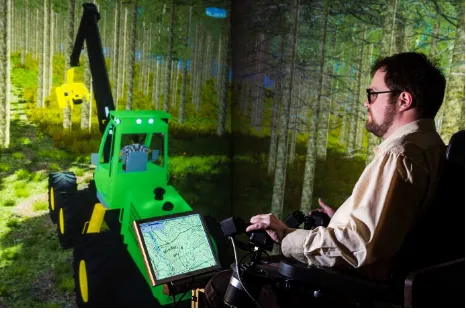
At 3D GeoInfo 2012, we presented an innovative and efficient way to generate “Virtual Forests” from remote sensing data (Bücken 2013). Individual trees are delineated from normalized digital surface models and annotated with height and species. This approach is the first step towards various forestall simulation applications based on real-world data like the simulation of forest machines (Figure 1), a flight simulator, or a tree growth simulation. To provide a basis for an efficient and modern data management of such vast datasets, a database-driven method for 3D simulation systems previously presented at 3D GeoInfo 2010 is used (Hoppen 2010). It provides a persistence layer and a common data schema for simulation systems. Now, it is enhanced by techniques for database-driven, distributed data management and simulation, and for data versioning.
Figure 1. A driver training with the forest machine simulator
In this new paper, we focus on the integration, enhancement, and on future trends regarding these two core technologies of a large-scale 4D forest simulation and information system. In particular, algorithms for the attribution of the individual tree, details on the GML-based object-oriented data model for tree data, and the concept of database-driven communication are presented. Overall, a shared world model is efficiently managed in a geo database and filled using modern techniques of semantic world modelling. The latter transform remote sensing data into a semantic object representation that can be used for the various simulation scenarios as mentioned above. Furthermore, data versioning can be used to analyse past scenarios like a windthrow, where the corresponding storm loss must be calculated. Furthermore, even simulated or predicted future values can be managed in a database for conservation, analysis, and comparison. These two concepts – simulation and versioning – add a fourth dimension yielding a 4D forest simulation and information system. Furthermore, given the performance of today’s database systems, it even becomes feasible to use the presented system for a multi-client simulation. Here, different clients are simultaneously working with the shared world model, while their actions’ effects are distributed over the very same active geo database system.
The paper is organized as follows. In the next section we give an overview of related work. In Section 3, the tree extraction approach is introduced and current results are presented. Subsequently in Section 4, the database interface is introduced, including database versioning and data streaming. Here, we give an insight into the systems 4D capabilities and current developments and show how the database interface and the tree extraction interact. After giving some details on the GML-based data modelling in the Virtual Forest in Section 5, some applications benefitting from realistic tree data are presented in Section 6. We conclude in Section 7 and end with references and acknowledgements.
International Archives of the Photogrammetry, Remote Sensing and Spatial Information Sciences,
2. RELATED WORK
There are several approaches for the delineation and attribution of individual trees from remote sensing data documented in literature. (Garcia 2007) compare four common algorithms for single tree delineation from nDSM (normalized digital surface model) datasets and point out their advantages and disadvantages. (Reitberger 2010) provides algorithms that work on full waveform data. The volumetric algorithm used in this paper focuses on nDSM-data. It can detect up to 90 percent of the trees in a spruce forest that is ready to harvest. (Hyyppä 1999) estimate the diameter at breast height of a tree depending on its height and crown diameter but do not specify the parameters of their heuristic as it might vary for different areas.
Concerning the database synchronization between a 3D system and a central database presented in this paper, no other approach provides such a high degree of flexibility and functionality. Basic solutions only use a database to store object positions etc. (Manoharan 2002) while the more sophisticated store the scene data itself. Some of these approaches support collaboration between clients (Schweber 1998), (Julier 2000), (Watanabe 2002), (Manoharan 2002), (Kaku 2005), (Walczak 2012), others do not (Vakaloudis 1998), (Schmalstieg 2007). Multiple data schemata are only supported by few systems (Watanabe 2002), (Schmalstieg 2007), (Walczak 2012), (Dassault Systèmes 2008), (Autodesk 2005). Finally, data versioning is only provided using proprietary data schemata (Vakaloudis 1998) or on file level using a CVS-like approach (Dassault Systèmes 2008), (Autodesk 2005). Overall, although several 3D systems have integrated databases, they do not achieve our tight integration of real-time 3D simulation and object-oriented database technology including persistence, collaboration, arbitrary data schema, and versioning.
3. SINGLE TREE DELINEATION AND ATTRIBUTION
The approach presented at 3DGeoInfo 2012 (Bücken 2013) efficiently generates individual trees with very limited user interaction. The idea of this algorithm is to associate a volume to each local maximum in the nDSM and to assign the local maxima to the groups “tree” and “lateral branch” based on their volumes. There are several ways how the total volume in the nDSM can be distributed among the local maxima. Figure 2 shows some possibilities. In the left distribution, the total volume of each local maximum mainly depends on the depth of the intersection between the peaks. Therefore, this distribution is not suitable, because for a tree with a split crown both parts will be classified as “lateral branch”. The distribution in the middle leads towards a behaviour similar to the watershed algorithm (Diedershagen 2003). While the watershed algorithm judges only based on the ground area of a local maximum, this variant would base its decision on the ground area and the height of a segment. The disadvantage is that the volumes of both segments are quite similar to each other. If we consider the size distribution between the trees in the forestry unit, it is difficult to find a suitable threshold for all trees when using this distribution. The distribution on the right hand side assigns the common basal volume of two peaks to the dominant one. Therefore, the dominant peak will be classified as a tree and the smaller peak will only be classified as an additional tree, if its own volume is significant enough.
Figure 2. Several possible distributions of the volume
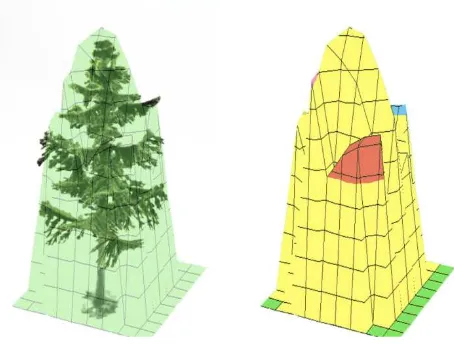
Figure 3 shows an example how the nDSM for a sample tree is assigned to the local maxima. A flow simulation that starts with the highest maximum can calculate this distribution. The typical runtime of this algorithm is O(n2), but with an implementation that takes advantage of the limited height of a tree and the denumerable amount of height levels in a tree (typically centimetre levels) it is possible to accelerate this algorithm to O(n). This more advanced implementation belongs to the class of plane sweep algorithms.
Figure 3. The distribution for the nDSM of a single tree
In our previous paper, we also showed how the threshold required to distinguish between the classes “tree” and “lateral branch” can be estimated with a heuristic based on the receiver operator characteristic.
The trees, generated with the volumetric algorithm, carry only the information directly available from the given data layers - e.g. their height, their crown area and their species. Other information like the stem diameter at breast height (DBH) is still missing. However, realistic forest models require information about the horizontal dimension of the trees to prevent a virtual environment from looking like an endless repetition of the same scene.
When a high resolution full waveform scan of a forestry unit is available, it is possible to detect the stems and their diameter directly from the remote sensing data (Reitberger 2010). However, when modelling large areas, there are usually only rather lowly resolved nDSMs available. Therefore, we needed to find a heuristic for the DBH that uses attributes that can be monitored directly from remote sensing data, and that provides
International Archives of the Photogrammetry, Remote Sensing and Spatial Information Sciences,
realistic estimates. In this paper, we present a heuristic for the class of spruces in our test areas in the federal state of North Rhine-Westphalia, Germany. Laser scanner data with approximately 6 points per square metre, as well as ground-truth data recorded during the last state forest inventory was used.
10,489 spruces were measured including individual heights and DBH values at the height of 1.30m above the ground. From those trees, the ones located in state-owned forestry units were selected where further information from forest inventory data is available. Unrealistic datasets were manually filtered from this result (e.g., trees with a height of 3m and a stem diameter of 90cm). 971 trees remained for the heuristic’s parameterization. These trees were located in all areas of North Rhine-Westphalia.
Crown areas of the sample trees were not recorded during the state inventory, thus a simple heuristic was used to estimate them. Therefore, the basal area was taken from the forest inventory data and the percentage of the basal area of the individual sample tree in relation to the area of the whole stand was calculated. We suppose that the share of the crown area in relation to the area of the forestry unit equals this percentage. Together with this information, a complete dataset is available, where each sample tree is annotated with its individual tree height, crown area and diameter at breast height. DataFit 9 (DataFit 2013) was used to calculate a relation between these parameters. The strong correlation is given in Table 1.
Height Crown Area DBH Height 1 0.7478184412 0.8851391766 Crown
Area
0.7478184412 1 0.8968172646
DBH 0.8851391766 0.8968172646 1
Table 1. The distribution for the nDSM of a single tree
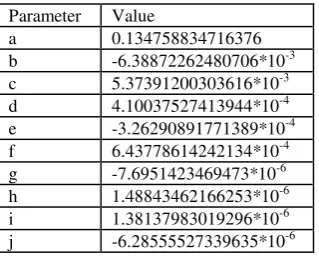
DataFit delivered the model given in equation (1) for the relation between height h, crown area A and diameter at breast height DBH with the parameters given in Table 2.
DBH(h,A) = a + bh + cA + dh2 + eA2 + fhA + gh3 + hA3 + ihA2 + jh2A
(1)
Parameter Value
a 0.134758834716376 b -6.38872262480706*10-3 c 5.37391200303616*10-3 d 4.10037527413944*10-4 e -3.26290891771389*10-4 f 6.43778614242134*10-4 g -7.6951423469473*10-6 h 1.48843462166253*10-6 i 1.38137983019296*10-6 j -6.28555527339635*10-6
Table 2. Parameters for equation (1)
DBH values calculated with this model show a standard deviation of 3.26cm when compared to the recorded DBH values.
Figure 4 shows a plot of the generated function. The sample points from the recorded data are marked with small black dots
and a line to show the difference between the calculated and the recorded value.
Figure 4. Graph of the generated function
The residual graph for the generated function (Figure 5) also shows only a small difference between the calculated and the measured DBH.
Figure 5. Residual graph of the generated function
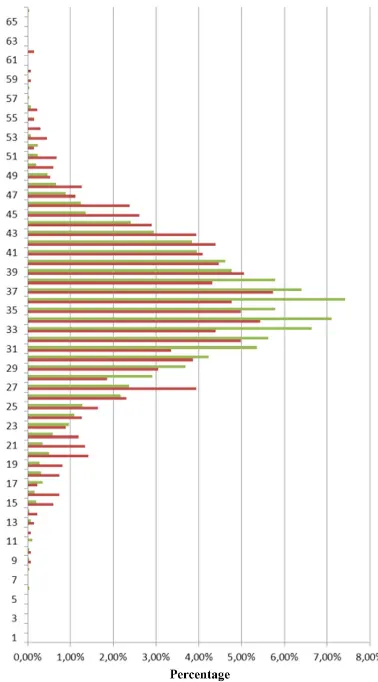
A different dataset was used for the verification of the generated heuristic. It was recorded in the project Virtual Forest II in forestry unit 121B1 in Schmallenberg-Schanze located in the Sauerland, North Rhine-Westphalia. The dataset contains information about more than 1000 spruces measured during a full record of the unit. We segmented the individual trees for this unit (see (Bücken 2013) for the segmentation results), calculated the diameter at breast height with the above formula and compared the distribution of breast height for the measured (red) and calculated (green) dataset in a histogram (Figure 6). It turns out that the generated heuristic models the attribute DBH in a quality more than sufficient for simulation purposes.
4. DATABASE INTERFACE
4.1 Database Synchronization
As previously introduced in (Hoppen 2010) and (Hoppen 2012), an approach for database synchronization can be used to connect a 3D simulation system with a central database (Figure 7). The 3D simulation system’s runtime database is used as real-time capable cache that drives the 3D simulation itself. In contrast, the central database provides persistence and versioning, a common application schema, and an integrated communication hub for collaboration or distributed simulation.
Synchronization is performed on three levels: schema, data and functional level. Thus, not only objects are replicated from the central database to the internal simulation database and kept “in sync”. At first, the simulation system adopts the data schema of the central database by synchronization to its internal simulation
International Archives of the Photogrammetry, Remote Sensing and Spatial Information Sciences,
database. This offers an advantage over the immediate usage of objects from the central database. By using replicated objects in the simulation database, details of the central database are hidden from all internal components of the simulation system (particles, physics, sensor data processing, rendering, etc.) allowing for transparent data access, real-time visualization and simulation. As mentioned above, the internal simulation database works as a cache, speeding up repeating access patterns. These would otherwise lead to repetitive queries to the central database. The central database also provides a persistence layer to the simulation system. This is due to the fact that changes made to replicate objects can be resynchronized back to the original counterpart objects within the central database.
Figure 6. Comparison of DBH values calculated from remote sensing data (green) with the terrestrial data (red)
An important part of data synchronization is change tracking and bidirectional resynchronization. Here, both databases’ notification services are used to track changes of original (central database) or replicate (simulation database) objects. Upon resynchronization, the collected information is used to bring such pairs of objects back “in sync”. Thus, not only changes in the simulation database are resynchronized to the central database, but also vice versa. This way, the central database can now also be used as an active communication hub. It can drive a distributed simulation or be used to implement distributed algorithms. Here, data changes can trigger different clients to compute a certain part of a distributed computation.
More details on database synchronization and the used databases VSD and SupportGIS Java (SGJ) are given in (Hoppen 2012).
Figure 7. Schema and data synchronization between a central (geo) database and a simulation database
4.2 Database Versioning
Another feature of the presented approach for database synchronization is versioning. Thus, the fourth dimension of time is not only supported by the several simulation techniques of the underlying simulation system. Additionally, the central SGJ database provides a mechanism that archives every previous version of a value with a time-stamp. An additional global log keeps record of all the changes corresponding to these versions. Versioned data and the change log can be transparently accessed by the database interface. User interfaces or other components of the simulation system can set a reference time and the database interface takes care of updating the corresponding replicates in the simulation database. The change of reference time leads to an update of the replicated data to match the chosen historic state.
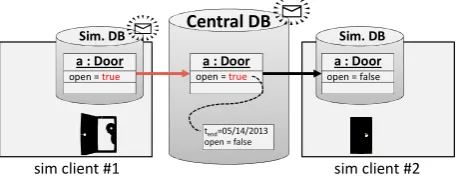
Using database versioning, change processes within the central database and its connected simulation clients can be recorded over time, archived, replayed, and analysed. An important basis for this is the change distribution mechanism mentioned above. When a simulation client, connected to the central database, changes a local replicate copy of an object, it synchronizes the change back to the original object within the central database. This change is tracked by the aforementioned versioning mechanism. It is also reported to all other connected clients that will adopt the change in their corresponding local replicate copies. Thus, by managing all objects in the central database, all changes can be globally recorded. A simple example is given in Figure 8. The central database contains a door object with an attribute “open” initially set to “false”. The object is synchronized to two simulation clients. Client #1 has just opened the door (“open” becomes “true”). The change was notified by its simulation database and synchronized to the central database. There, the previous value “false” is versioned with the current timestamp. Finally, the central database notified the change. In the next step, client #2 would adopt the change from the central database, thus also opening its replicate copy of the door.
International Archives of the Photogrammetry, Remote Sensing and Spatial Information Sciences,
Sim. DB
Figure 8. Example for DB-driven communication including versioning
After a simulation, one of the simulation clients can be used to access the historic data as mentioned above. For example, to replay a recorded movement of a vehicle where each database change represents a version of a position attribute, the client will iterate through the corresponding time frame. At each step, he will query its database interface to update all its replicate copies to the respective point in time. Another usage scenario is managing forest inventory data. Here, the central database holds a forest model while the simulation clients are used to access and update the data for inventory measures. Local changes are synchronized to the central database and the objects’ previous states are versioned.
The current versioning mechanism uses a standard approach of one time dimension with the system time of the database management system. Thus, the corresponding time-stamps cannot be chosen, but always correspond to the point in time a change is committed to the central database. (Elmasri 2010) calls this the “transaction time” and the database a “transaction time database”. Current developments of SGJ extend this notion to additional time dimensions allowing to specify arbitrary points in time. One of such time concepts is the “real time” tR that corresponds to a change, i.e. to an event. According to (Elmasri 2010), this time is called the “valid time” tV and a database supporting only this time dimension is called a “valid time database”. A database combining both concepts is called a “bitemporal database”. Our current specifications intend a third time dimension to represent the validation of a value in terms of its availability to other users. This notion is often used in the context of forest inventory data were properties of the managed objects are typically updated step-by-step during the year but insert simulated or predicted values with future time-stamps into a database. This makes results persistent and allows them to be analysed using database techniques. By using a second, orthogonal time dimension like the transaction time or a dedicated simulation time, multiple simulation runs can be inserted side by side into the database and compared. As an example, results from multiple runs of a tree growth simulation (see Section 6) with different parameters could be compared.
Besides time-stamps, other meta data was identified to be necessarily managed along with each version. Usually, the user is interested in the question “Who has changed what, when and why?”. The “when” and the “what” are recorded by the versioning mechanism itself. The “who” and the “why” have to be integrated into the meta data in terms of a job specification and a user specification.
To define the necessary behaviour of the versioning system, requirements were specified using the example of a single tree database. Therefore, an exemplary sequence of database operations was specified:
•CREATE: On 2013-06-01, user “A” inserts a tree object with
height 10m (and a derived DBH of 10cm) for tR 2014-01-01, tV 2014-01-01
•UPDATE: On 2014-06-01, user “B” updates the tree height to 12m (and a derived DBH to 12cm) for tR 2015-01-01, tV 2015-01-01
•UPDATE: User “B” made a mistake. On 2014-06-02, he
updates the tree height to 12.1m (and a derived DBH to 12.1cm) for tR 2015-01-01, tV 2015-01-01
•DELETE: The tree is felled on 2015-06-01. Driver “C” of the harvester measures a height of 14m and a DBH of 14cm. Subsequently, the tree is deleted. Both events are stored for tR 2015-06-01, tV 2015-06-01
•UPDATE: Forestry scientists find a new formula for the
relation between tree height and DBH that is applied to the database. The update is performed on 2015-08-01, tV 2016-01-01. For all values of tR, scientist “D” calculates the following DBH values: 2014-01-01: 10.5cm, 2015-01-01: 12.5cm
•UPDATE: An old data sheet is found containing exact measurements for 2014-02-01: On 2016-06-01, official in charge “E” updates the tree height to 10.1m (and a derived DBH of 10.1cm) for tR 2014-02-01, tV 2016-06-01.
Based on this example, queries and their intended results were specified:
Standard access patterns (“day-to-day business”): Get the current value of the reference tree as created and updated above
•SELECT: tR 2013-01-01, tV 2013-01-01: NULL
Same series of queries, but executed on 2017-01-01:
•SELECT: tR 2013-01-01, tV 2013-01-01: NULL points in time, the log itself shall also be able to be queried.
Queried on 2017-01-01: Get meta data on all changes of “C”
•UPDATE, on 2015-06-01, tR 2015-06-01, tV 2015-06-01:
“C”, (14m, 14cm), job 4711, harvesting measure
•DELETE, on 2015-06-01, tR 2015-06-01, tV 2015-06-01:
“C”, (14m, 14cm), job 4711, harvesting measure
4.3 Data Streaming
Another feature of the database interface is data streaming. Parts of huge datasets are loaded into the simulation database when required and are unloaded when not required anymore. It is used to save memory in the simulation database and speed up
International Archives of the Photogrammetry, Remote Sensing and Spatial Information Sciences,
data access by only loading required data. We distinguish tree types of streaming: spatial (or geometrical) streaming, hierarchical streaming and streaming for data processing.
Spatial streaming can be used to virtually move through huge 3D datasets like city or forest models. Here, the area is subdivided into tiles. A strategy when moving may be to load all objects within the bounding rectangle of nearby tiles and unload the other objects. Hierarchical streaming is used to access hierarchically structured, object-oriented data with a GUI element like a tree view. While opening a relation between objects will trigger a loading of all associated objects, closing the relation will trigger their unloading. For example in a CityGML scenario, opening a Building’s association to its BuildingParts will load all of them into the simulation database, closing it will unload them. resynchronized if necessary, and unloaded. Resynchronization is only applied when either the subset itself is changed or additional objects are created by data processing. In the latter case, such newly created objects may be unloaded as well. Streaming for data processing can use different iteration strategies. It may apply spatial streaming to process data spread over an area, hierarchical streaming to process a subtree structure of objects, or other specialized approaches. For example, the approach is used to apply the algorithms for tree extraction mentioned above to large forest areas. Forest stand objects are loaded stepwise from a stand inventory database. For each stand unit, the corresponding rasterized remote sensing data is retrieved (using another mechanism), tree data is extracted and corresponding tree objects are extracted. These tree objects are synchronized to the tree inventory database. Finally, the current stand object and the newly created tree objects are unloaded before the next stand object is loaded.
5. DATA MODELLING
In the context of the research project Virtual Forest, several GML-based data schemata have been developed to model the different types of inventory or other data. One of their key properties is the combination of geometry and numerical data into integrated object-oriented data models. This facilitates data integrity, as most other current data models in forest inventory store these two types of data in separate data management systems. They also inherently cover the hierarchical structure present in most inventory data by allowing to explicitly model objects and their interrelations. The use of GML-based schemata guarantees the data to be open for different applications rather than being locked in proprietary formats. Furthermore, standard OGC web services like WFS can directly be applied.
The object-oriented data models were mostly derived from previous relational or flat schemata. To date, these data models are designed for the forestry administration of North Rhine-Westphalia. Currently however, a usage by other (German) forestry administrations or private forest managers is evaluated. For that purpose, a schema family called ForestGML is in development. It shall further generalize and standardize data modelling and facilitate the application of the Virtual Forest’s
methods for other users. An abstract base schema called ForestGML-Base shall therefore contain all those basic structures and definitions needed by the core algorithms of the Virtual Forest. Based hereupon, specializations like ForestGML-NRW for North Rhine-Westphalia will capture all distinctive features of the respective users.
6. APPLICATIONS
A highly detailed forest model can serve as a foundation for realistic landscape visualizations. However, there are more applications for the data than visualization. In this section, we will introduce some of those.
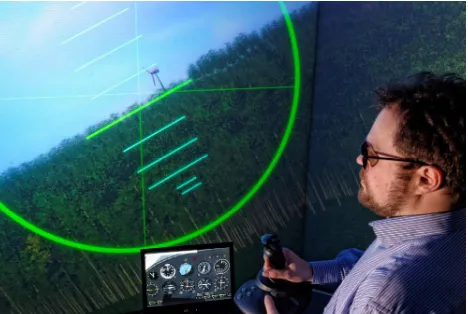
VFR (visual flight rules) flight training requires realistic landscape models – especially in areas close to airports. In this context, current commercial flight simulators use polygonal boxes to represent forests. This approach only provides a forest’s size as an obstacle but does not allow realism comparable to a real cockpit’s view. Realistic, large-scale forest models can serve as an alternative. When tree data is streamed from a central database as mentioned above, nearly endless landscapes become possible.
Figure 9 shows an example of a flight simulator using a highly detailed forest model as a landscape.
Figure 9. A flight simulator using a forest model as described in this paper
As another example, forest machine simulators require even more realistic models of their environment. Here, the forest model is no longer limited to visualization. An important part in the training of harvester drivers is to learn the physical limits of the forest machine. A harvester has quite strict limitations on certain gradient. If the weight is too high the harvester will flip over. The weight of a tree can be calculated directly from its volume. There are several approaches in the literature that specify the volume of a tree based on its height and DBH. Therefore, the introduced forest model can serve as a training scenario for a forest machine simulator. (
Figure 1) (Rossmann 2010)
While the two simulators previously introduced are used for operator training, the next will focus on forest development. A tree growth simulation like SILVA (Pretzsch 2002) can
International Archives of the Photogrammetry, Remote Sensing and Spatial Information Sciences,
calculate how the modelled forest will change over the next decades. This is valuable information for the owner to find an ideal cultivation scenario. The owner wants to maximize the profit but also wants to ensure a sustainable management strategy. The best trade-off between both can be calculated with such simulations based on our forest model (Roßmann 2011).
Besides simulation, the same model can also serve as a source of information for a forest surveyor. The surveyor can read information like the dominant height of a forest stand directly from the model. Furthermore, in the project Virtual Forest, algorithms were developed estimating other parameters of the forest unit based on the individual tree model.
The last example is a forest navigation system (Roßmann 2009). While GPS delivers poor localization results when used under the canopy, it is possible to use the detailed forest model as a navigation map and to recognize the current area of the forest in this map. This position lookup is similar to using a city map. For example, when seeing a large church in front of you, a city map can be used to determine your position. Tree groups in the forest have a sufficiently different layout in order to recognize them in a precise map. In this application, the GPS position is used as a coarse estimate of the real position. It specifies the area of the forest model that has to be searched for the tree group. A local map of the surrounding tree group is captured with a terrestrial laser scanner or a stereoscopic camera. A particle simulation is used to locate this group. It has been shown that the average positioning error with this method is only about 50cm. Before building this navigation system in reality, it was developed and tested using Virtual Testbed techniques (Roßmann 2011), based on the very same forest model (Figure 10).
Figure 10 A Virtual Testbed with a harvester using door-mounted laser scanners to generate a local tree map
These are only five examples of applications that benefit from the innovative database-driven, high detailed forest model.
7. CONCLUSION
This paper outlines current developments regarding data processing, modelling, and management in a large-scale 4D forest simulation and information system. We therefore summarize the status quo and new advancements of two of its main components and their integration. Using methods of semantic world modelling, tree data is extracted from remote
sensing data including position, height, crown volume, type and now also diameter to derive realistic forest models. This data is managed by a database synchronization approach combining local real-time caching with central communication and data versioning. The concept for a new advanced multi-dimensional versioning approach is introduced, which will provide even more flexibility in time-based data management. Using methods for data streaming, the integration of the two components is explained. Current developments regarding the generalization of data models to an ISO/OGC-compliant ForestGML further support the system’s flexibility towards other users. Finally, the various applications built on top of this system already prove its practicability.
8. REFERENCES
Autodesk, 2005. Best Practices for Implementing Autodesk Vault.
Bücken, A. and Roßmann, J., 2013. From the Volumetric Algorithm for Single-Tree Delineation Towards a Fully-Automated Process for the Generation of “Virtual Forests”. In:
Progress and New Trends in 3D Geoinformation Sciences - Lecture Notes in Geoinformation and Cartography, Berlin, Heidelberg, Springer, pp. 79–99.
Dassault Systèmes, 2008. ENOVIA V6 Architecture Performance Capability Scalability a Product Lifecycle Management Whitepaper Prepared by ENOVIA, a Dassault Systèmes Brand Executive Summary.
DataFit, 2013. http://www.oakdaleengr.com/datafit.htm (May 11, 2013).
Diedershagen, O., Koch, B., Weinacker, H., and Schütt, C., 2003. Combining LIDAR and GIS Data for the Extraction of Forest Inventroy Parameters. In: Proceedings ScandLaser 2003, Umeå, Sweden.
Elmasri, R. and Navathe, S., 2010. Fundamentals of Database Systems. 6th edition, Pearson.
Garcia, R., Suárez, J. C., Patenaude, G., 2007. Delineation of individual tree crowns for LiDAR tree and stand parameter estimation in Scottish woodlands. In: The European Information Society - Leading the Way with Geo-Information. Lecture Notes in Geoinformation and Cartography, Berlin, Springer, S. 55–86.
Hoppen, M., Roßmann, J., Schluse, M., and Waspe, R., 2010. A New Method for Interfacing 3D Simulation Systems and Object-Oriented Geo Data Sources. In: International Archives of Photogrammetry, Remote Sensing and Spatial Information Sciences 38 (Part 4/W15), 51–56.
Hoppen, M., Schluse, M. Roßmann, J., Weitzig, B., 2012. Database-Driven Distributed 3D Simulation. In: Proceedings of the 2012 Winter Simulation Conference (WSC 2012), Berlin, pp. 1-12.
Hyyppä, J. and Inkinen, M., 1999. Detecting and estimating attributes for single trees using laser scanner. In: The Photogrammetric Journal of Finland, vol. 16 (2), pp. 27–42.
Julier, S., Baillot, Y., Lanzagorta, M., Brown, D., and Rosenblum, L., 2000. Bars: Battlefield augmented reality
International Archives of the Photogrammetry, Remote Sensing and Spatial Information Sciences,
system. In: NATO Symposium on Information Processing Techniques for Military Systems, 9–11.
Kaku, K., Minami H., Tomii T., and Nasu H., 2005. Proposal of Virtual Space Browser Enables Retrieval and Action with Semantics which is Shared by Multi Users. In: 21st International Conference on Data Engineering Workshops (ICDEW’05), 1259-1259: IEEE.
Manoharan, T., Taylor, H., and Gardiner, P., 2002. A collaborative analysis tool for visualisation and interaction with spatial data. In: Proceedings of the seventh international conference on 3D Web technology, 75-83: ACM.
Pretzsch, H., Biber, P., and Dursky, J., 2002. The Single Tree-Based Stand Simulator SILVA: Construction, Application and Evaluation. For. Ecol. Manag. 162:3-21.
Reitberger, J., 2010. 3D-Segmentierung von Einzelbäumen und Baumartenklassifikation aus Daten flugzeuggetragener Full Waveform Laserscanner. Dissertation, TU Munic, Munich.
Roßmann, J., Krahwinkler, P. M., and Bücken, A., 2009. Mapping and navigation of mobile robots in natural environments. In: Advances in Robotics Research - Theory, Implementation, Application (German Workshop on Robotics 2009, TU Braunschweig), pp. 43-52.
Roßmann, J. and Jung, T., 2010. Interactive Dynamics-Based Simulation of Work Machines. In: VRCA Progress Report, Volume 4, Aachen, pp. 77–79.
Roßmann, J., Schluse, M., Waspe, R., and Moshammer, R., 2011. Simulation in the Woods: From Remote Sensing based Data Acquisition and Processing to Various Simulation Applications. In: Proceedings of the 2011 Winter Simulation Conference, Phoenix, Arizona, pp. 984 - 996, ISBN 978-1-4577-2109-0
Schmalstieg, D., Schall, G., Wagner, D., Barakonyi, I., Reitmayr, G., Newman, J., and Ledermann, F., 2007. Managing complex augmented reality models. In: IEEE Computer Graphics and Applications 27 (4): 48–57.
Schweber, Erick Von, 1998. SQL3D - Escape from VRML Island. http://www.infomaniacs.com/SQL3D/SQL3D-Escape-From-VRML-Island.htm (May 10, 2013).
Vakaloudis, A. and Theodoulidis, B., 1998. Spatiotemporal Database Connection to VRML.
Walczak, K., 2012. Dynamic Database Modeling of 3D Multimedia Content. In: Interactive 3D Multimedia Content, Chapter 4, 55–102, Springer, London.
Watanabe, C., and Masunaga, Y., 2002. VWDB2: A Network Virtual Reality System with a Database Function for a Shared Work Environment. In: Information Systems and Databases, 190–196, Tokyo, Japan.
9. ACKNOWLEDGEMENT
Virtual Forest: This project is co-financed by the European Union and the federal state of North Rhine-Westphalia,
European Regional Development Fund (ERDF). Europe – Investing in our future.
International Archives of the Photogrammetry, Remote Sensing and Spatial Information Sciences,