EXTENDING THE LIFE OF VIRTUAL HERITAGE: REUSE OF TLS POINT CLOUDS IN
SYNTHETIC STEREOSCOPIC SPHERICAL IMAGES
J. Garcia Fernandez a,*, K. Tammi b, A. Joutsiniemi a
a
TUT, School of Architecture, Tampere University of Technology, Rakennustalo Building, 33720 Tampere, Finland -
(jorge.garciafernandez, anssi.joutsiniemi)@tut.fi
b
TAMK,
School
of Construction
and Environmental Engineering,Tampere University of Applied Sciences,
Kuntokatu 3,
33520 Tampere, Finland - [email protected]
Commission II
KEY WORDS: Point Cloud, Terrestrial Laser Scanner, Reuse, VR, Stereoscopic, Spherical Images
ABSTRACT:
Recent advances in Terrestrial Laser Scanner (TLS), in terms of cost and flexibility, have consolidated this technology as an essential tool for the documentation and digitalization of Cultural Heritage. However, once the TLS data is used, it basically remains stored and left to waste.How can highly accurate and dense point clouds (of the built heritage) be processed for its reuse, especially to engage a broader audience? This paper aims to answer this question by a channel that minimizes the need for expert knowledge, while enhancing the interactivity with the as-built digital data: Virtual Heritage Dissemination through the production of VR content.
Driven by the ProDigiOUs project’s guidelines on data dissemination (EU funded), this paper advances in a production path to transform the point cloud into virtual stereoscopic spherical images, taking into account the different visual features that produce depth perception, and especially those prompting visual fatigue while experiencing the VR content. Finally, we present the results of the Hiedanranta’s scans transformed into stereoscopic spherical animations.
1. INTRODUCTION
During the last decade, laser scanner (LIDAR) technology has been consolidated as an essential tool for the documentation and digitalization of Cultural Heritage sites (Nothegger & Dorninger, 2009). Simultaneously, the cost of the required equipment has decreased significantly and more versatile software solutions, with advanced processing capabilities, have become available. The aforementioned factors have ensured the growth of point clouds’ popularity (LIDAR native´s data), as a key data structure in digital Heritage management.
Point clouds are solving a wide range of needs of Cultural Heritage, especially in the areas of conservation and communication, and loads of digital treasures are therefore being captured and stored. However very few reuse alternatives have been implemented for generally unstructured point cloud data, while requiring high memory capacities for both management and storage purposes.
At the same time, from a more social perspective, the effective heritage communication has become a crucial part of the site’s conservation, as well as an element for the education and cohesion of the society (Garcia-Fernandez, 2014). Particularly, immersive VR content opens a new door not only for widening the access to Heritage-related information, but for a better – interactive– understanding of complex historical sites (Jimenez et al., 2016).
How can highly accurate and dense point clouds (of the built heritage) be processed for its reuse, especially to engage a broader audience? This paper aims to answer this question by exploring a channel that minimizes the needs for expert knowledge, while enhancing the interaction with the as-built
digital data: Virtual Heritage Dissemination through the production of VR content.
2. TERRESTRIAL LASER SCANNER
During the last few years the Laser Scanner Technology has gained a privileged position in the accurate documentation of the built environment. The substantial decrease in the hardware’s price, the flexibility in terms of dimensions, weight, and scan speed, together with the increased processing capabilities of desktop computers, has turned terrestrial laser scanners (TLS) into a recurrent tool for the built environment's documentation (Garcia-Fernandez, 2016).
The use of this technology, and its typical data: the point cloud, has already transcended the boundaries of remote-sensing disciplines. Still, their eminently technical character restricts the use of TLS data to an expert use, especially for the representation, interpretation and expert analysis of cultural heritage. Multiple documentation projects based on TLS are performed every year worldwide. Large and rich volumes of data (point clouds of cultural heritage assets) are stored, at best, once they have met the specific demands. In a world where the permanence of digital data is so uncertain (Carraway, 2011), we are facing the risk to lose the chances of exploiting the added value of these documents, especially the value for a non-expert public, eager and in need to take advantage of its cultural heritage (Garcia-Fernandez, 2014).
2.1 Reuse of Point Cloud
The concept of point-cloud reuse has been properly addressed in the case of aerial LIDAR (Hsu et al., 2011), where national and international institutions have implemented online-available and free LiDAR Data Sources. However, for terrestrial laser scanner The International Archives of the Photogrammetry, Remote Sensing and Spatial Information Sciences, Volume XLII-2/W3, 2017
data (sites, monuments, and artefacts), only few initiatives have been optimally implemented through open repositories, among which stands: Large Geometric Models Archive (Georgia Institute of Technology); and The Stanford 3D Scanning Repository (Stanford University). The large size of point clouds, hindering both their storage in memory and their transmission over the network; the diversity of formats; the need for expert knowledge for their use and management, among others causes, have severely limited the point cloud’s widespread use.
Transferring point cloud data into parametric models suitable for VR content creation often includes complex processes in terms of time and expert effort, such as shape reconstruction (features recognition and parametrization), re-texturization, semantic description, among others (Pacheco, 2014; Quattrini, 2016). Recently, significant improvements in processing capacities, and the opening of modelling and rendering software to point clouds, allows us to explore the ‘straightforward’ (re-)use of point cloud in rendered synthetic stereoscopic spherical content, and its implementation in social communication platforms.
2.2 Our Case (ProDigiOUs project)
The framework of our study was related to ESF funded project ProDigiOUs (http://prodigious.tamk.fi/in-english/) that fosters the usage of laser scanning in the Architecture, Engineering and Construction sector at Tampere region, Finland. To demonstrate the potentials of TLS as a built heritage documentation tool, it was agreed with the city of Tampere to implement an experimental laser scanning of the protected Lielahti mansion at Hiedanranta district.
Driven by the ProDigiOUs project’s guidelines on data dissemination, and looking for answers in TLS’ data reuse that would meet both the technological and social requirements of easily accessible virtual heritage, we conducted a study aiming to transform the point cloud into synthetic stereoscopic spherical images, summarized in the following sections.
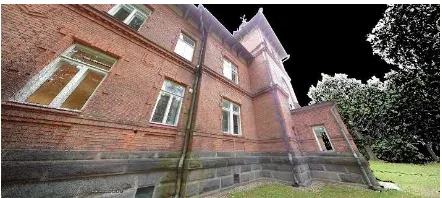
Figure. 1. Outdoor scan station and point cloud data obtained in in the Lielahti mansion campaign, 2016
The data capture campaign in Lielahti mansion supplied the data to conduct the study cases. It included over 100 scan positions indoor and outdoor (Figure 1); and working in a range of resolution between 1 point every 4-10mm at 10 meters.
3.
SYNTHETIC STEREOSCOPIC SPHERICAL
IMAGES
The creation of stereoscopic spherical content taking advantages of the reuse of point clouds, placed us before the opportunity to recycle and enrich classic stereo photography methods. As in all processes aiming to simulate the depth perception, stereo capture requires to be mutually consistent, framed in geometric and
photometric constraints, in order to optimally reconstruct a 3D-scene by our brains (Devernay & Beardsley, 2010).
The effects of visual fatigue and visual discomfort when experiencing VR stereoscopic content has been widely demonstrated by several studies (Wann & Mon-Williams, 1997; Atallah et al., 2012; among others). While some standards have been implemented for digital 3D cinema production (especially in terms of format and compatibility with broadcast television standards), there are no regulations for the use and publication of stereo VR content in public sites.
Nowadays, with the development of the digital photography and the easy access to both software and unverified information, a significant amount of VR content is produced without taking into consideration any elements that increase visual fatigue such as: disparities, convergence, interpupilar distance, etc. (and consumed by poorly engineered systems). An illustrative case are the multiple websites and free apps announcing the possibility of doing anaglyph from a single image.
Although it is not the purpose of this paper to advance in a regulation/standards for stereo-VR content, we do propose a serious reflection (both for creators and consumers), on the need to advance in responsible selection and consumption of VR content, and the development of knowledge-based content creation processes. Within this line, this third section summarizes our progress in the development of a practical guideline (in form of production path) for the creation of synthetic stereoscopic spherical images based on point clouds.
The path aims to ensure the visual comfort (in 3D-perception) while enhancing the stereopsis (static perception from fusioning two binocular images). The path definition takes into account the different visual features related with the depth perception (including the use of monoscopy depth cues), and the aforementioned elements that might cause visual fatigue.
3.1 Defining the path workflow
Once the point cloud is developed, filtered, and aligned in the brand's native software (in our case Faro Scene), we have defined a production path based mainly on Autodesk tools for stereo spherical image creation. The path was tested using point cloud data available from ProDigiOUs project, as detailed in 2.2.
The selection of Autodesk products was chosen due to two main reasons. On the one hand, this software corporation has been developing and releasing new programs and functionalities that allow users to optimally edit, transform and export point clouds. On the other hand, Autodesk has released free licences (up to three years) for the Academia in most of its software, including those managing point clouds.
Within the Autodesk family, our production path starts with Autodesk ReCap 360 Pro (Figure 2) for transforming raw point cloud data in indexed Autodesk Native format (RCS). The point clouds in RCS are structured by regions, allowing the Autodesk software to optimally manage and visualize point cloud content. For this step, in our test, no further cleaning or decimation process was conducted.
Figure 2. Indexation of point clouds in Autodesk-native file using Recap 360 Pro
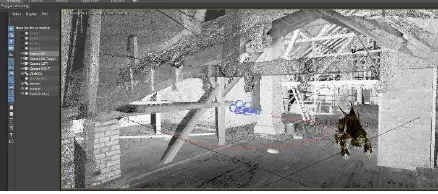
After the data is turned into Autodesk-indexed data, the point clouds have to be imported in a 3D computer graphic software. For it, we have selected Autodesk 3D Max 2017 (Figure 3). This software has been enriched with the capacity to handle point cloud objects, since the 2014 version. In the last version, of 2017, Autodesk 3D Max is able to create geometries based on the point cloud data (snap-to-point), expose its radiometric characteristics, and customize the interaction with the scene lighting. Several plugins such as Leica CloudWorx and Clouds2max have been developed to better adapt raw point clouds to Autodesk 3D Max environment.
Within Autodesk 3D Max the production path implements the appropriate camera configuration (detailed in 3.2) and conduct the rendering process through the NVIDIA Mental Ray motor (detailed in 3.3). Once the image sections are created, the production path develops a script for the specific purposes of renaming, organizing, and stitching frames. This is especially useful in the case of animations, where the management of large amounts of files is required (detailed in 3.4).
Figure 3. RCS file imported in Autodesk 3D Max (2017)
3.2 Camera Configuration
The creation of cylindrical and spherical images, generally based on the matching of several single frames, is an already solved problem. Commonly, one single camera rotates on its optical axis, with overlap enough to rectify and connect continued image features. However, the translation of this mono-capture process to the stereo-capture version is not immediate.
In the case of stereoscopic pano, two cameras separated by a base distance (interpupillary distance -IPD in the case of human vision), must capture the scene while rotating on a central point (system’s optical axis). The aforementioned base distance is directly related with the scale of the objects to be represented, in order to achieve an optimal depth sensation. As suggested by
Bourke (2010), two narrow vertical slits are extracted from each camera, that is, from each spherical image (Figure 4). This procedure allows us to refine the base distance in post-processing, by choosing different slits with the same distance in the two cameras, in respect to the center of the image frames.
Figure 4: Virtual symmetric toed-in camera configuration
Conducting this process using photographic cameras can introduce significant errors, such as difference in colour, changes in the light conditions, among others. However, in computerized solution (synthetic images), the internal parameters of the camera, the camera orientation, and the lighting conditions of the environment can be adjusted and simulated in detail.
Common to all spherical images is the relation W(Weight) x H(Height) = 2x1, where W covers the horizontal 360dg, and H the vertical 180dg. When rendering strips of the spherical image (for further stitching as detailed in 3.3), it is important to properly consider the relation between the resolution of the final spherical images (particularly its weight dimension Wf), the weight dimension of the strip (Ws), and the number of steps (n). The relation between Wf/Ws has to be an integer divisor of n.
Defining the number of steps (amount of slits in one spherical image) is a matter of balancing the processing cost and the quality of the final image. Ideally, an infinite number of captures will reproduce a continuous spherical image rotating in an eccentric axis. In our case, with cameras rotating in discrete steps, optimal solutions can be reached with steps’ rotation angle of 1/2dg to 1 dg, based on results published by Bourke (2006 & 2010).
Handling the parallax
Once the direction of rotation and the steps of capture are defined, we need to manage the scene plane that will be represented on the monitor screen. This becomes crucial when a precise simulation of the depth is aimed. This task is essentially based in the definition of the parallax condition of the represented scene. By defining the zero parallax plane (objects on the display), the other parallax condition: positive (objects represented behind the display) and negative (objects represented in front), get fixed.
Shooting with crossed optical axes, takes us to the (virtual) symmetric toed-in camera configuration (Figure 4). This configuration allows us to move the spatial range where the image is formed by moving the convergence point back and forth (Yamanoue, 2006). Under this configuration, the targeted plane at convergence has no disparity, that is, zero parallax. This is significantly advantageous in applications of VR reality representing the heterogeneous built environment, while allowing to customize the near range of work (Allison, 2007).
The main limitation of the Toed-in configuration lies on the vertical disparity, introduced by the fact of having objects closer to one eye than the other (Wei, 2003), and the further introduction The International Archives of the Photogrammetry, Remote Sensing and Spatial Information Sciences, Volume XLII-2/W3, 2017
of the keystone effect (objects are seen with a different obliquity from each camera). Even though from this disparity a bias in-depth perception is expected, there are no conclusive proofs that vertical disparity can induce visual discomfort (Speranza et al., 2002; and Allison, 2007). In our case (virtual toed-in configuration) the vertical disparity is not noticeable, since this effect is acuter in the corner of the photograms, and we propose to conduct the renderization in very narrow strips.
In order to define the zero parallax plane, it is necessary to accurately set the convergence angle (α) of the two cameras. For this, we suggest to follow the equation stated by Bourke (2010) (1).
α 2 asin (1)
where
α =the convergence angle
r =radius of the rotation circle Dz = distance to the zero parallax.3.3 Rendering
Having fully defined the camera configuration, the rendering process in our production path is conducted in Autodesk 3D Max, with the rendering application NVIDIA Mental Ray. Using the ‘WrapAround’ lens, Mental Ray allows us to get the entire 360-degree environment surrounding the camera, spherically projected onto a dome.
Blur effects in rendering
Aiming to minimize the visual discomfort and to better simulate the human depth perception, we have introduced the depth of field (DoF) blur effects, as suggested by Carnegie and Rhee (2015). The retinal image blur is one of the main monoscopic cues that helps our system to understand the object’s size and the perception of depth. Besides, this effect softens the weights of disparities in the extreme DoF range, where maximum values and the visual discomfort are reached.
In the case of synthetic images (computerized process), the blur effect can be introduced by customizing the camera parameters (similarly to what happens in the ‘physical’ photography) or directly throughout the render motor (Figure 5).
Since we don’t want to give the appearance of capturing a smaller world (easily recognized when capturing images with micro-photography), we suggest to use the human in-focus range as a reference, especially to represent the as-built heritage from terrestrial perspective. In this case, for a human being averagely having a DoF of 0.3D, at a focus distance of 3m, means that the in-focus range is from 1.6m-30m (Devernay and Beardsley, 2010).
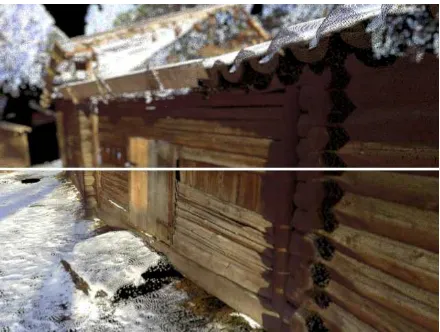
Figure. 5 Testing different amplitude of Depth of Field in Mental Ray through ‘Camera Effects Rollout’
For spherical images, blur introduction may have an unwanted effect in the near range, where cameras are set close to the floor (simulating the human being position). Panning the visualization closer to the nadir will bring a fully blurred screen representing the ground plane. This will not allow the eyes to find the optimal area to converge. One solution is to only set the blur effect to the far range, the other one is to limit the allowance of the camera tilt.
Textural Gradient in rendering
One of the main monoscopic depth cues contributing to the depth perception is the textural gradient. The amount of variation ‘from point to point in the texture is directly related to the distance from the viewer’ (Rosas et al., 2004). This cue will improve not only the depth perception but also the surface orientation in the case of surfaces slanted in depth.
Specifically, for the case of point clouds, we take advantage of the discretion of the points, in order to exploit the Textural gradient depth cue. The increases in density of the projected texture, is in our case related with the point cloud geometry itself: (i) proximity/distance from point to point in the cloud; and (ii) dimension of the point to be represented.
These parameters must be defined in close relation with the distance to the object and the resolution of the input data. In our test, with an average resolution of 1 point every 10mm at 10 meters, we decided neither to create new points, nor to increase the size point in the short range.
Automatic image seaming
Within the digital environment managed in 3D Max, we accurately know the camera's position and its orientation in the scene, in every rotation step. Besides, the virtual cameras do not contribute with errors due to optical aberration or lens misalignment. These make unnecessary the overlapping and further blending function (Huang and Hung, 1998). The rendered slits can be directly stitched.
In order to automate the stitching process, we have implemented the task in Image-J, a former neuro-science software for expert image analysis. Within Image-J, the plugin Stitch Sequence of Grid of Images, based on the stitching algorithms created by The International Archives of the Photogrammetry, Remote Sensing and Spatial Information Sciences, Volume XLII-2/W3, 2017
Stephan Preibisch (Preibisch et al., 2009), was preferred to conduct the automatic image seaming.
The selection of this plugin was done based on its capacity to manage the stitching in multiple loops, and organize them by grid along the three axis. These become critical when aligning multiple render loops, as in the case described in the following section.
3.4 Animations in a video sequence
One of the main potentials of conducting this process in a virtual environment, is that the as-built heritage scene can be enriched with ‘almost?’ any other digital information. Enhancing the digital environments and the stereoscopic spherical documents with storytelling-based strategies, can bring back inhabitants to the historical site, as well as populate it with monsters and princesses, recreating legends, myths, or old ways of life. This turns simple (cultural heritage) diffusion of data into a rich interpretative and educational product (Garcia-Fernandez & Medeiros, 2014).
Empowering the scene with animations developed in time and space, first requires the implementation of the added information (in our study case 3D models); and second, the re-configuration of the cameras in terms of the loops (frames) and path.
In order to optimally visualize an animation with moving objects, we need to develop the video sequence with a ratio higher than 15 (spherical) frame per seconds. This multiple rendering is a significant time-consuming task, requiring also a high processing capacity. The final quantity of slips (S) can be easily estimated through (2).
2 (2)
Where n = the number of steps in each loop (frame) q = number of frames per second
t= amount of second for the whole video sequence
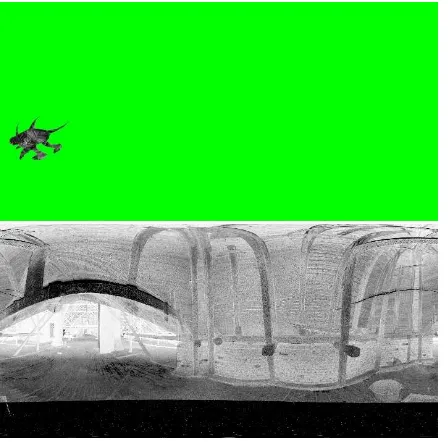
In our test, in order to keep the time manageable while using average personal computers, we decided to set one capturing position, and to conduct the process in two steps. First we rendered the 3D environment without the animation, and second we rendered the animation without the environment, setting the background in pure green to easily extract it in post processing (Figure 6).
We implemented this procedure combining a spherical image of the mansion’s attic with a 3D monster walking along the scene (free monster model downloaded from http://3drt.com/). During the tests, we have set 360 steps (α=1°), and 25 photograms per second along 20 second in left and right cameras. That means a total 360.000 slits rendered in batch during 12h. For this task we have used an eight-CPUs Intel Core i7 personal computer at 2.8GHz; 32 Gb of RAM; NVIDIA Quadro K21000M graphic card, and running on Windows 7.
Figure 6. Top, single photogram of the animation (after stitching); Bottom, left spherical image representing the
environment
Specifically, for managing this large number of frames, we have developed a script that allows to rename and organize the spherical frames, specifically for complying the input data demands in the stitching processing using Stitch Sequence of Grid of Image (Figure 7).
Figure. 7. Code for adapting multiple frames to the plugin Stitch Sequence of Grid of Image (J-Image software)
The final video creation includes the removal of green backgrounds, the overlapping of both environment and animation sequences, and the transformation of the multiple single frames into continuous video format. This task can be conducted in almost any video editing software; for the purpose of this research, we used Sony Vega Pro.
3.5 Visualization
The race for allowing VR content in large-audience platforms is already on its way. YouTube, Facebook, Hulu, Google Play, HBO, NETFLIX, Jaunt, among others have already implemented solutions for it.
Considering the free and easy access, and the large user community, we have decided to implement our study cases in YouTube. This platform currently allows top-bottom and side-by-side VR representation, suitable for anaglyph in desktop display and stereo images for head-mounted devices (HMD).
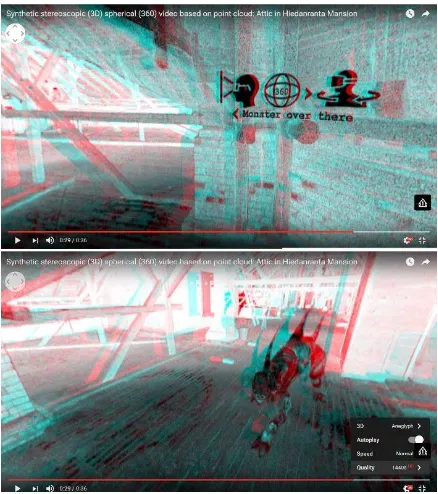
Metadata injection for the recognition of the stereo spherical images on YouTube can be solved with the crowdsourced developed app: Spatial Media (https://github.com/google/ spatial-media). A user-friendly interface version is accessible through YouTube’s official page. The two screenshots in Figure 8 shows the Lielahti’s Attic animation, uploaded on YouTube.
Figure 8. Animation based on sythethis stereoscopical spherical images, Lielahti ’s attic, Tampere Finland
4. CONCLUSIONS AND FUTURE RESEARCH
This paper has first drafted the current state of terrestrial laser scanners in Cultural Heritage and the imperative need of giving a second life to the point cloud, especially for heritage communication purposes. Second, we present a semi-automatic production path for the creation of synthetic stereoscopically spherical images, addressing the main elements causing visual fatigue in its production.
This study attempts to reach an optimal -legible- solution for the semi-automatic stereoscopic VR content creation. The production path was demonstrated and tested by the study case of Lielahti mansion, as part of the EU funded regional ProDigiOUs project.
Given the complexity of the topic, some elements got out of the scope, particular an in-depth analysis about
Accommodation-Convergence conflict in the creation of spherical stereoscopic images. Further research must analyze the aforementioned conflict, its relation to nearness of the visualization screen (especially in HDM), and the specific ranges of horizontal disparities from crossed to uncrossed disparities in toed-in camera configuration.
4.1 References
Allison, R., 2007. Analysis of the influence of vertical disparities arising in Toed-in Stereoscopic cameras, Journal of Imaging and Technology, 51:4, pp. 317-327
Atallah, P., Pelah, A., and Wilkins, A., 2012. Visual stress symptoms from stereoscopic television, IEEE/IET Electronic Library (IEL) Conference Proceedings, pp. 1-7
Bourke, P., 2006. Synthetic Stereoscopic Panoramic Images, in Lecture Notes in Computer Science (LNCS), Springer, V. 4270, pp. 147-155
Bourke, P., 2010. Capturing omni-directional stereoscopic spherical projections with a single camera, 16th International Conference on Virtual Systems and Multimedia, VSMM 2010, pp. 179-183
Carnegie, K., and Rhee, T., 2015. Reducing Visual Discomfort with HMDs Using Dynamic Depth of Field, IEEE Computer Graphics and Applications, pp. 34-41
Carraway, L., 2011. On preserving knowledge, The American midland naturalist, 166:1, pp. 1-12
Chen, J., Hsu, P., and Lin, C., 2012. Model retrieval based on point cloud encoding of airborne LIDAR, 32nd IEEE International Geoscience and Remote Sensing Symposium, IGARSS 2012; Munich; Germany; 22 July 2012 through 27 July 2012;
Devernay, F. and Beardsley, P., 2010. Stereoscopic Cinema, in Image and Geometry Processing for 3-D Cinematography, volume 5 of Geometry and Computing, Springer Berlin Heidelberg
Garcia-Fernandez, J., 2014. Digital Culture for the enhancement of Heritage value, generation of heritage product with educational scope, doctoral thesis, Published by the Editorial Service- University of Valladolid, Spain.
Garcia-Fernandez, J., 2016. An Assessment of Errors and Their Reduction in Terrestrial Laser Scanner Measurements in Marmorean Surfaces, 3D Research Journal, March 2016, 7:2, pp. 1-11
Garcia-Fernandez, J., and Medeiros, L., 2014. Chapter 3: Digital Storytelling, in MOOC Course, New Strategies for the Safeguard of Cultural Heritage, Coord. Fernandez, J., Ed. University of Valladolid.
Huang, H., and Hung, Y., 1998. Panoramic Stereo Imaging System with Automatic Disparity Warping and Seaming, Graphical models and image processing, 60:3, pp. 196–208
Hsu, P., Chen, J., and Lin, C., 2011. 3D building model retrieval for point cloud modeling, 32nd Asian Conference on Remote Sensing 2011, ACRS, V. 4, pp.2243-2248
Jimenez, B., Morabito, D., and Remondino, F., 2016. Access to complex reality-based 3D models using virtual reality solutions, Journal of cultural heritage, Ed. Elsevier, pp. 1-9
Nothegger, C., and Dorninger, P., 2009. 3D filtering of high-resolution terrestrial laser scanner point clouds for cultural heritage documentation, Photogrammetrie, Fernerkundung, Geoinformation, 2009:1, pp. 53-63
Pacheco, D., 2014. Spatializing experience: a framework for the geolocalization, visualization and exploration of historical data using VR/AR technologies, Proceedings of the 2014 Virtual Reality International Conference 2014, pp. 1 -4
Preibisch, S, Saalfeld, S., and Tomancak, P., 2009. Globally optimal stitching of tiled 3D microscopic image acquisitions, Bioinformatics, 25:11, pp. 1463 -1465
Quattrini, R et al., 2016. Virtual reconstruction of lost architectures: from the TLS survey to AR visualization, International archives of photogrammetry and remote sensing, v:41, pp. 383-390
Rosas, P., Wichmann, F., Wagemans, J., 2004. Some observations on the effects of slant and texture type on slant-from-texture, Vision Research, 44:13, p. 1511 -1535
Speranza F, Stelmach, L., Tam, W., and Glabb, R., 2002. Visual comfort and apparent depth in 3D systems: effects of camera convergence distance. In: Proc. SPIE Three-Dimensional TV, Video and Display, SPIE, vol. 4864, pp 146–156,
Yamanoue, H., 2006. The differences between toed-in camera configurations and parallel camera configurations in shooting stereoscopic images, ICME 2006,
Wei, M., 2003. Do visual cues contribute to the neural estimate of viewing distance used by the oculomotor system?, The Journal of neuroscience, 23:23, pp. 8340 -8350
Wann, J., and Mon-Williams, M., 1997. Health issues with virtual reality displays, Computer Graphics, pp.53-57
4.2 Acknowledgements
This work has been conducted in conjunction with the ‘ProDigiOUs’ regional EU project and supported by the School of Architecture, Tampere University of Technology (Finland); and the City of Tampere, Finland.