ON THE USABILITY AND USEFULNESS OF 3D (GEO)VISUALIZATIONS
-- A FOCUS ON VIRTUAL REALITY ENVIRONMENTS
A. Çöltekin*, I. Lokka, M. Zahner
Department of Geography, University of Zurich, Switzerland – (arzu.coltekin, ismini-eleni.lokka, martin.zahner)@geo.uzh.ch
Commission II, TeS: WG II/6 Geovisualization and Virtual Reality
KEY WORDS: 3D visualization, virtual reality, geovisualization, perception, cognition, human factors, user studies
ABSTRACT:
Whether and when should we show data in 3D is an on-going debate in communities conducting visualization research. A strong opposition exists in the information visualization (Infovis) community, and seemingly unnecessary/unwarranted use of 3D, e.g., in plots, bar or pie charts, is heavily criticized. The scientific visualization (Scivis) community, on the other hand, is more supportive of the use of 3D as it allows ‘seeing’ invisible phenomena, or designing and printing things that are used in e.g., surgeries, educational settings etc. Geographic visualization (Geovis) stands between the Infovis and Scivis communities. In geographic information science, most visuo-spatial analyses have been sufficiently conducted in 2D or 2.5D, including analyses related to terrain and much of the urban phenomena. On the other hand, there has always been a strong interest in 3D, with similar motivations as in Scivis community. Among many types of 3D visualizations, a popular one that is exploited both for visual analysis and visualization is the highly realistic (geo)virtual environments. Such environments may be engaging and memorable for the viewers because they offer highly immersive experiences. However, it is not yet well-established if we should opt to show the data in 3D; and if yes, a) what type of 3D we should use, b) for what task types, and c) for whom. In this paper, we identify some of the central arguments for and against the use of 3D visualizations around these three considerations in a concise interdisciplinary literature review.
1. INTRODUCTION
Creation of 3D visualizations has largely been driven by rapidly developing technology rather than cognitive and perceptual theories and/or user-centered thinking (Çöltekin & Haggren, 2000; Fuhrmann et al., 2005). As the processing power and memory capacity of the computers increased, and software grew more sophisticated; the use of 3D graphics in many domains increased -- simply because it was now feasible to create them. Thus, the use of 3D in visualization appears to be common today, even though there is very little understanding and awareness if 3D visualizations work as intended for the aimed audiences and tasks.
Many of the arguments in this vein remain theoretical, sometimes anecdotal and/or based on introspection of the scientists themselves. However, there is also some evidence from empirical studies, and based on these, it seems that the answer to whether we should use 3D or whether it is ‘any good’, is ‘it depends’ (Huk, 2006; Shepherd, 2008; Tory et al., 2006). In other words, as various forms of 3D have been growing popular (e.g., in media or in scientific publications), we also started hearing some critical evidence that cautions us to think before we go for the ‘cool’ 3D effects (Hegarty et al., 2009). Geographic information scientists have also shown interest in this conversation in recent years publishing evidence for and against the use of 3D through empirical experiments (Zanola et al., 2009).
* Corresponding author
2. CONCEPTUAL ORGANIZATION OF CURRENT
EMPIRICAL STUDIES
Conceptually, to tease apart the evidence for and against the use of 3D, we propose categorizing the results from the existing empirical studies based on three fundamental dimensions1 that are critical in user studies using visualizations as stimuli (Çöltekin, 2015; Tory, 2014):
1) Visualizations type – when you hear 3D, what comes to your mind? There are many 3D visualization types that vary from very abstract simple plots to fully immersive virtual reality environments. When we consider an empirical result, we should pay attention to what type of 3D has been tested. Furthermore, as in all visualizations, related design choices (Oh et al., 2011) such as interactivity (e.g., Amini et al., 2014), use of color (e.g., Brychtová & Çöltekin, 2016), or degree of realism e.g., photo-textures, virtual environments (e.g., Boér et al, 2013; Smallman & Cook, 2011).
2) Task type – Similarly, as in all user studies, the context in which the study was conducted is important to identify. Here it is important to distinguish between task and instruction. However, they are equally important, results from one empirical study might not apply to another one if the task (i.e., what goal was) and the instructions (i.e., what the participant was asked to do) are different. Even small details matter as one can ‘prime’ the participants based on the instructions (Martin, 2008). To do
1
We see the irony.
this systematically, first of all a new (geo/spatial) task taxonomy, expanded on previous efforts is needed (e.g., Carter, 2005; Knapp, 1995). Once there is a relevant, up-to-date task taxonomy is prepared; studies should be classified (and conducted) accordingly.
3) ‘User type’, i.e., individual and group differences, i.e., human perceptual and cognitive abilities are important (e.g., Slocum et al., 2001). Not only we should study if ‘this type of 3D is good for task type x’ (for what) but we should study if ‘this type of 3D is good for task type x and participant type y’ (for whom). Literature abounds with examples that expertise, i.e., education, experience, previous exposure (e.g., Çöltekin et al., 2010), spatial abilities (Liben & Downs, 1989; Huk, 2006), visual abilities (Fukuda et al., 2010), age (Schnürer et al., 2015), and possibly other characteristics, such as lack of sleep (Kong et al., 2011), or if the alphabet is pictorial/iconic, or if one reads and writes from left to right, or if one conventionally uses certain graphical designs, etc.) all have an influence on whether we benefit from working different kinds of graphics (including 3D), or not.
In terms of how to measure the relevance and fitness of 3D, in many user studies, we see performance (usually accuracy and speed of task execution) as the main criteria. While clearly very important in many tasks, there are possibly other important considerations too. For example, if 3D is perceived as ‘cool’ (i.e., attractive, interesting), it could be more engaging, thus could have a value in situations where grabbing attention or engaging people are important. As a larger goal, we plan to look for patterns in the user studies based on the three dimensions described above, organize the findings in the literature systematically based on the reported outcomes in empirical studies not only based on performance, but also on preference, confidence, attractiveness, and levels of presence. In this paper, we present broad categorizations of existing 3D visualization types, related tasks, and participant characteristics – and based on these we identify some of the central arguments for and against the use of 3D in visualization2.
2.1 3D Visualization types: Not all are created equal
A current example of technology-driven excitement about 3D visualizations is the (re)popularization of a specific type of 3D, i.e., the highly realistic immersive virtual reality environments (VE).3 Seemingly, visual realism is an important part of the discourse on 3D. However, it is necessary to note that not all 3D are realistic, nor all realistic visualizations are 3D. In Fig.1, we present a non-comprehensive categorization of a set of example geovisualizations based on realism and dimensionality.
On the other hand, level of realism can be studied with immersivenes, showing that not all realistic representations are immersive. Thus, focusing on the 3D visualizations alone, here we propose a rough categorization based on levels of visual realism and levels of immersiveness (Fig. 2).
2 It is important to distinguish ‘3D in
analyses from ‘3D in visualization’. There are cases where 3D is well justified for analysis, but not for visualization; and vice versa.
3
Facebook purchased Oculus Rift VR, which was followed by a large number of online reactions, e.g., see
http://recode.net/2016/03/24/two-years-later-facebooks-oculus-acquisition-has-changed-virtual-reality-forever/
Figure 1. A rough classification of an example set of popularly used geovisualization types (Boér et al., 2013).
Figure 2. A rough classification of 3D visualizations based on their levels of visual realism and immersiveness.
Highly immersive and highly realistic visualizations are a specific focus in this paper, because they are still rather effort and cost intensive to create, and because of their oscillating popularity through the history, and the current rise of this popularity. This popularity is evident as modern head-mounted displays of decent visual quality (yet considerably less expensive than before) are currently in the consumer market, and even ‘cardboard’ versions of these are available, enabling immersive stereo viewing using mobile phones (Spilka, 2015).
Such developments increase the accessibility and ubiquity of VE systems, which were once prohibitively expensive, and clumsier to use. VEs differ from other types of 3D, as they mimic reality and are typically designed to be highly immersive, have high information intensity (realism), high interactivity and often feature intelligent objects (MacEachren et al., 1999). However, by definition, VEs feature 3D visualizations in them. In that sense, VEs can be seen ‘type’ of 3D visualization, while there are many ways to visualize 3D information.
2.2 Tasks types
An attempt to categorize 3D visualization types (e.g., as in Fig. 2) could help better organize what we know about their utility The International Archives of the Photogrammetry, Remote Sensing and Spatial Information Sciences, Volume XLI-B2, 2016
and usability. Of course, categorization efforts of 3D visualization types could also be approached based on other factors, e.g., levels of interactivity, based on the task types they are designed for, or domains of use. Today, diverse professional groups use different kinds of 3D visualizations, spanning from highly realistic virtual-reality type 3D renderings to abstract 3D plots (Fig. 2), for a large number of tasks such as in education, virtual tourism or planning (Biljecki et al., 2015). We see 3D visualizations in practical applications, e.g., advertisement industries, civil engineering, architecture, urban design; in journalism, e.g., political news, weather reports; as well as in the scientific world, e.g., geography, medicine, engineering; or in fine arts (e.g., Borkin, et al., 2007; Neuenschwander et al., 2014; Wood, et al., 2005; Yeung, 2011).
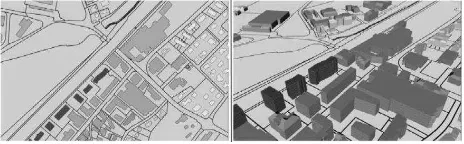
For example, in urban design (e.g., Fig. 3), one might hypothesize that the closer the visualization is to ‘reality’, the easier it may be for the urban designers as users to comprehend what is being proposed and make decisions (Hayek et al., 2011; Herbert & Chen, 2014).
Figure 3. Viewing a specific type of zoning plan (atypical) in 2D (left) or in 3D (right) could make a difference in participant
performance as well as attitudes. Note that both the dimensionality and the viewing perspective changes here, and
therefore different information are shown.
On the other hand, even though it might present certain advantages in some cases, such as revealing information that may not have been otherwise visible (Li et al., 2010), or people might prefer it for a set of tasks (Çöltekin, et al., 2015) there is strong evidence that for reading plots (Dall’Acqua et al., 2013), or detecting anomalies (Borkin et al., 2011), 3D visualizations might rather hinder their users than help them. Various reasons have been proposed for the causes of the failures with 3D visualizations. For example, the scale variation on 3D displays makes judging distances and areas harder, occlusion sometimes removes relevant information from the display, and, displaying ‘more information’ (such as in more realistic visualizations) is likely to induce information overload (Harrower & Sheesley, 2005; MacEachren, 1995; Seipel, 2013; Shepherd, 2008).
2.3 Human factors – ‘participant type’ or individual and group differences
15 years ago, Slocum et al. (2001) published their seminal paper on cognitive and usability issues, and have stated that the virtual reality environments ‘fundamentally change our traditional way of acquiring spatial knowledge’ (Slocum et al., 2001, p. 62). Years later, we see that virtual environments remain relevant, yet from a cognitive and usability perspective, information overload can be a real threat to user performance with realistic visualizations (such as VEs). VEs have high information intensity, as they mimic reality and attempt presenting the visual environment with as high fidelity as possible instead of a meaningful summary with highlighted information. While attempts to manage the level of detail with modern means such as gaze-contingent displays have been
proposed (Duchowski & Çöltekin, 2007; Çöltekin, 2009; Bektas et al., 2015), these are experimental and certain human factors issues hinder their use. For example, most VEs are based on stereoscopic visualizations and, according to Ware (2004), as much as 20% of the population is not able to see in stereo 3D. Additionally, it is well-documented that stereoscopic displays can cause discomfort such as simulator sickness or eye strain (Lambooij et al., 2009). On the other hand, a comprehensive review of empirical studies regarding stereo 3D suggested performance improvement in 60% of the cases considered, 25% of the cases it was a ‘tie’ between mono and stereo, and 15% was mixed/unclear (McIntire et al., 2014). McIntire et al. (2014) state that stereo displays clearly offer benefits in depth-related spatial tasks, however, they caution that 25–50% of the population expresses some discomfort with stereo displays and they should be designed carefully. There are also other basic perceptual problems with other kinds of 3D, e.g., we may not be able to perceive depth correctly if the light source is in the ‘wrong’ position (Bernabé Poveda & Çöltekin, 2014; Biland & Çöltekin, 2016; Imhof, 1967).
Besides the perceptual problems, individual differences are expressed in based on cognitive abilities. As mentioned earlier, possibly because they have an advantage in terms of coping with the information overload, high-spatial people might be benefitting more from working with certain types of 3D in certain contexts (Huk, 2006). Though the opposite has also been suggested, with the argument that 3D might be more ‘intuitive’, i.e. resembling the real world objects more than the 2D alternatives should be easier to recognize, thus low-spatial people might benefit more (Rautenbach, et al., 2015; Shepherd, 2008). Currently there is no established understanding of exactly in which situations these arguments might apply (to which kind of 3D, what design choices, and in relation to which task). In addition to spatial and cognitive abilities, there is also evidence that previous exposure (familiarity, education, expertise) affects performance with 3D (e.g., Green & Bavelier, 2007; Harrington, 2011; Sungur & Boduroglu, 2012). Such evidence is especially interesting because it suggests that some of the individual differences are malleable (Uttal et al., 2012), thus before we attempt designing for a specific group, or personalize the design, we might want to consider if there are possibilities to intervene trough training.
3. CONCLUDING THOUGHTS AND FUTURE WORK
In this paper, we provided a concise first review of the findings in the existing empirical studies on 3D visualizations. Our initial review of the literature revealed some specific aspects of working with 3D visualizations that are worth considering. For example, some studies suggest that ‘human recognizable’ elements in a visualization might be helpful in how well we remember them (Borkin et al., 2013), which encourages us to further study the benefits of (photo)realistic 3D visualizations such as VEs. Of course, when we talk of memory, individual and group differences (as mentioned above) are especially important, because specific populations (e.g., based on age, spatial ability, and professional experience) might have different strategies and memory capacities (Lokka & Çöltekin, 2016).
In terms of tasks, our current review broadly suggests that tasks that require global visual information processing (i.e., studying the entire scene) such as in scene gist recognition (Loschky et al., 2010), object recognition or for remembering things, realistic (3D, VR) visualizations may offer advantages, while The International Archives of the Photogrammetry, Remote Sensing and Spatial Information Sciences, Volume XLI-B2, 2016
for tasks that require local visual information processing (e.g., telling precisely if temperature is 2 or 3 degrees higher at point A than at point B) it may introduce problems. Recently Krejtz et al. (2014) have also proposed a similar ‘global/local’ distinction for measuring types of attention based on eye movements in spatial tasks using the terms ambient and focal attention, and earlier literature also distinguishes local and global visual information processing (Gasper and Clore, 2012), and specifically for spatial memory (Brunyé et al., 2009). In terms of domains, realistic 3D representations such as VEs still hold promise in simulating real or fictional environments and provide immersive experiences in which one can safely conduct experiments under controlled conditions; experience future or past, explore under the oceans or visit Mars – thus when comprehensive one and provide deeper categorizations with more evidence in terms of visualization types, design choices, task types, and user groups. Our overarching future goal is to organize the existing information and conduct further empirical studies to understand what specifically does the usefulness and usability of 3D visualizations depend on – i.e., if certain 3D visualization types work or do not work well for certain task types and possibly certain user groups, and if they do or do not, why could that be.
ACKNOWLEDGEMENTS
The project is partially funded by the Swiss National Science Foundation (SNSF project VISDOM, award number 200021_149670).
REFERENCES
Amini, F., Rufiange, S., Hossain, Z., Ventura, Q., Irani, P., & McGuffin, M. J. (2014). The impact of interactivity on comprehending 2D and 3D visualizations of movement data. IEEE Transactions on Visualization and Computer Graphics, 21, 1–1.
Bernabé Poveda, M. A., & Çöltekin, A. (2014). Prevalence of the terrain reversal effect in satellite imagery. International Journal of Digital Earth, 1–24.
Biland, J., & Çöltekin. (2016). An empirical assessment of the impact of the light direction on the relief inversion effect in shaded relief maps: NNW is better than NW. Cartography and Geographic Information Science.
Biljecki, F., Stoter, J., Ledoux, H., Zlatanova, S., & Çöltekin, A. (2015). Applications of 3D city models: State of the art review. ISPRS International Journal of Geo-Information, 4(4), 2842–2889.
Boér, A., Çöltekin, A., & Clarke, K. C. (2013). Evaluating Web-based geovisualizations online: A case study with abstraction-realism spectrum in focus. In International Cartograhic Conference, ICC 2013, Dresden, Germany. Dresden.
Borkin, M. A., Gajos, K. Z., Peters, A., Mitsouras, D., Melchionna, S., Rybicki, F. J., … Pfister, H. (2011). Evaluation of artery visualizations for heart disease diagnosis. IEEE Transactions on Visualization and Computer Graphics, 17(12), 2479–88.
Borkin, M. A., Vo, A. A., Bylinskii, Z., Isola, P., Sunkavalli, S., Oliva, A., & Pfister, H. (2013). What makes a visualization memorable? IEEE Transactions on Visualization and Computer Graphics, 19(12), 2306–15.
Borkin, M., Goodman, A., Halle, M., & Alan, D. (2007). Application of medical imaging software to 3D visualization of astronomical data. In R. A. Shaw, F. Hill, & D. J. Bell (Eds.), Astronomical Data Analysis Software and Systems XVI (Vol. 376, p. 621).
Brunyé, T. T., Mahoney, C. R., Augustyn, J. S., & Taylor, H. A. (2009). Emotional state and local versus global spatial memory. Acta Psychologica, 130(2), 138–146.
Brychtová, A., & Çöltekin, A. (2016). The effect of spatial distance on the discriminability of colors in maps. Cartography and Geographic Information Science, 1– 17.
Carter, J. R.. (2005). The many dimensions of map use. In Proceedings of the 22nd International Cartographic Conference (p. 9). Coruna, Spain.
Çöltekin, A. (2009). Space-variant image coding for stereoscopic media. In 2009 Picture Coding Symposium (pp. 1–4). IEEE.
Çöltekin, A. (2015). Mix well before use: Understanding the key ingredients of user studies. In ICC2015 Workshop on
“Envisioning the Future of Cartographic Research.”
Curitiba, Brazil.
Çöltekin, A., Fabrikant, S. I., & Lacayo, M. (2010). Exploring the efficiency of users’ visual analytics strategies based on sequence analysis of eye movement recordings. International Journal of Geographical Information Science, 24(10), 1559–1575.
Çöltekin, A., & Haggren, H. (2000). VRML as a tool for a Web-based, 3D, Photo-Realistic GIS. In Proceedings of the ISPRS2000, July 14-21 (Vol. 33, pp. 143–148). Amsterdam, The Netherlands.
Çöltekin, A., Lokka, I.-E., & Boer, A. (2015). The utilization of publicly available map types by non-experts -- A choice experiment. In Proceedings of the 27th International Cartographic Conference (ICC2015).
Dall’Acqua, L., Çöltekin, A., & Noetzli, J. (2013). A comparative user evaluation of six alternative permafrost visualizations for reading and interpreting temperature information. In GeoViz Hamburg 2013 Interactive Maps that Help Poeple Think.
Duchowski, A. T., & Çöltekin, A. (2007). Foveated gaze-contingent displays for peripheral LOD management, 3D visualization, and stereo imaging. ACM Transactions on Multimedia Computing, Communications, and Applications, 3(4), 1–18.
Fuhrmann, S., Ahonen-Rainio, P., Edsall, R. M., Fabrikant, S. I., Koua, E. L., Tobón, C., … Wilson, S. (2005). Making useful and useable geovisualization: design and The International Archives of the Photogrammetry, Remote Sensing and Spatial Information Sciences, Volume XLI-B2, 2016
evaluation issues. In Exploring Geovisualization (pp. 551–566).
Fukuda, K., Awh, E., & Vogel, E. K. (2010). Discrete capacity limits in visual working memory. Current Opinion in Neurobiology.
Gasper, K., & Clore, G. L. (2002). Attending to the big picture: Mood and global versus local processing of visual information. Psychological Science, 13(1), 34–40.
Green, C. S., & Bavelier, D. (2007). Action-video-game experience alters the spatial resolution of vision. Psychological Science, 18(1), 88–94.
Harrington, M. C. R. (2011). Empirical evidence of priming, transfer, reinforcement, and learning in the real and virtual trillium trails. IEEE Transactions on Learning Technologies, 4(2), 175–186.
Harrower, M., & Sheesley, B. (2005). Designing better map interfaces: A framework for panning and zooming. Transactions in GIS, 9(2), 77–89.
Hayek, U. (2011). Which is the appropriate 3D visualization type for participatory landscape planning workshops? A portfolio of their effectiveness. Environment and Planning B: Planning and Design, 38(5), 921–939.
Hegarty, M., Smallman, H. S., Stull, A. T., & Canham, M. S. (2009). Naïve cartography: How intuitions about display configuration can hurt performance. Cartographica: The International Journal for Geographic Information and Geovisualization, 44(3), 171–186.
Herbert, G., & Chen, X. (2014). A comparison of usefulness of 2D and 3D representations of urban planning. Cartography and Geographic Information Science, 42(1), 22–32.
Huk, T. (2006). Who benefits from learning with 3D models? the case of spatial ability. Journal of Computer Assisted Learning, 22(6), 392–404.
Imhof, E. (1967). Shading and shadows. In Cartographic Relief Representation (Vol. 2007, pp. 159–212). Redlands, California: ESRI Press.
Knapp, L. (1995). A task analysis approach to the visualization of geographic data. In T. L. Nygeres, D. M. Mark, R. Laurini, & M. J. Egenhofer (Eds.), Cognitive Aspects of Human Computer Interaction for Geographic Information Systems (pp. 355–371). Springer.
Kong, D., Soon, C. S., & Chee, M. W. L. (2011). Reduced visual processing capacity in sleep deprived persons. NeuroImage, 55(2), 629–34.
Krejtz, K., Duchowski, A. T., & Çöltekin, A. (2014). High-level gaze metrics from map viewing: Charting ambient/focal visual attention. In Proceedings of the 2nd International Workshop on Eye Tracking for Spatial Research, GIScience2014. Vienna, Austria.
Lambooij, M., Ijsselsteijn, W., Fortuin, M., & Heynderickx, I. (2009). Visual discomfort and visual fatigue of stereoscopic displays: a review. Journal of Imaging Science and Technology, 53(3), 030201.
Li, X., Çöltekin, A., & Kraak, M.-J. M. M. J. (2010). Visual
exploration of eye movement data using the space-time-cube. LNCS, Geographic Informa tion Science, 6292, 295–309.
Liben, L. S., & Downs, R. M. (1989). Understanding maps as symbols: the development of map concepts in children. Advances in Child Development and Behavior, 22, 145– 201.
Lokka, I.-E., & Çöltekin, A. (2016). Simulating navigation with virtual 3D geovisualizations – A focus on memory related factors. In ISPRS - International Archives of the Photogrammetry, Remote Sensing and Spatial Information Sciences. Prague.
Loschky, L., Ellis, K., Sears, T., Ringer, R., & Davis, J. (2010). Broadening the horizons of scene gist recognition: aerial and ground-based views. Journal of Vision, 10(7), 1238– 1238.
MacEachren, A. M. (1995). How maps work. New York: The Guilford Press.
Maceachren, A. M., Edsall, R., Haug, D., Baxter, R., Otto, G., Masters, R., … Qian, L. (1999). Virtual environments for geographic visualization: potential and challenges.
NPIVM ’99 Proceedings of the 1999 Workshop on New
Paradigms in Information Visualization and Manipulation in Conjunction with the Eighth ACM Internation Conference on Information and Knowledge Management, 35–40.
Martin, D. (2008). Doing Psychology Experiments. 2nd ed. Cengage Learning.
McIntire, J. P., Havig, P. R., & Geiselman, E. E. (2014). Stereoscopic 3D displays and human performance: A comprehensive review. Displays, 35(1), 18–26.
Mortara, M., Catalano, C. E., Bellotti, F., Fiucci, G., Houry-Panchetti, M., & Petridis, P. (2013). Learning cultural heritage by serious games. Journal of Cultural Heritage.
Neuenschwander, N., Hayek, U. W., & Grêt-Regamey, A. (2014). Integrating an urban green space typology into procedural 3D visualization for collaborative planning. Computers, Environment and Urban Systems, 48, 99– 110.
Oh, K. E., Halpern, D., Chiang, J., Tremaine, M., Bemis, K., & Silver, D. (2011). Which properties in 3D visualizations cause comprehension difficulties? Proceedings of the American Society for Information Science and Technology, 48(1), 1–4.
Rautenbach, V., Çöltekin, A., & Coetzee, S. (2015). Exploring the impact of visual complexity levels in 3D city models on the accuracy of individuals’ orientation and cognitive maps. ISPRS Annals of Photogrammetry, Remote Sensing and Spatial Information Sciences, II-3/W5, 499– 506. basic spatial assessment. Behaviour & Information The International Archives of the Photogrammetry, Remote Sensing and Spatial Information Sciences, Volume XLI-B2, 2016
Technology, 32(8), 845–858.
Shepherd, I. D. H. (2008). Travails in the third dimension: a critical evaluation of three-dimensional geographical visualization. In M. Dodge, M. McDerby, & M. Turner (Eds.), Geographic Visualization: Concepts, Tools and Applications (pp. 199–210). Chichester, UK: Wiley.
Slocum, T. A., Blok, C., Jiang, B., Koussoulakou, A., Montello, D. R., Fuhrmann, S., & Hedley, N. R. (2001). Cognitive and usability issues in geovisualization. Cartography and Geographic Information Science, 28(1), 61–75.
Smallman, H. S., & Cook, M. B. (2011). Naïve realism: Folk fallacies in the design and use of visual displays. Topics in Cognitive Science, 3(3), 579–608.
Spilka, S. (2015). Google cardboard and mattel partner on modern view-master. PFSK Report, URL http://www.psfk.com/2015/02/google-cardboard-mattel-view-master.html (last accessed 29th April 2016)
Sungur, H., & Boduroglu, A. (2012). Action video game players form more detailed representation of objects. Acta Psychologica, 139(2), 327–34.
Tory, M. (2014). User studies in visualization: A reflection on methods. In Handbook of Human Centric Visualization (pp. 411–426).
Tory, M., Kirkpatrick, A. E., Atkins, M. S., Moller, T. (2006). Visualization task performance with 2D, 3D, and combination displays. IEEE Transactions on Visualization and Computer Graphics, 12(1), 2–13.
Uttal, D. H., Meadow, N. G., Tipton, E., Hand, L. L., Alden, A. R., Warren, C., & Newcombe, N. S. (2012). The malleability of spatial skills: A meta-analysis of training studies. Psychological Bulletin.
Ware, C. (2004). Information Visualization: Perception for Design. (3rd ed.). San Francisco, CA, USA: Morgan Kaufmann.
Wood, J., Kirschenbauer, S., Döllner, J., Lopes, A., & Bodum, L. (2005). Using 3D in visualization. In J. Dykes, A. M. MacEachren, & M.-J.Kraak (Eds.), Exploring Geovisualization (pp. 295–312). Amsterdam: Elsevier.
Yeung, Y. (2011). Web-based applications of 3D visualization and virtual reality in science education. Formatex.Info, 615–623.
Zanola, S., Fabrikant, S. I., Çöltekin, A. (2009). The effect of realism on the confidence in spatial data quality in stereoscopic 3D displays. In Proceedings of the 24th International Cartography Conference (ICC 2009) (Vol. 2, pp. 1–9). Santiago, Chile.