A COMPARISON AMONG DIFFERENT OPTIMIZATION LEVELS
IN 3D MULTI-SENSOR MODELS.
A TEST CASE IN EMERGENCY CONTEXT: 2016 ITALIAN EARTHQUAKE
F. Chiabrando a, G. Sammartano a*, A. Spanò a
a Politecnico di Torino, DAD, 10129, Torino, Italy - (filiberto.chiabrando, giulia.sammartano, antonia.spano)@polito.it
Commission II
KEY WORDS: emergency mapping, 3D documentation, Cultural Heritage risk, multi-scale modelling, multi-sensor approach, UAV, SfM photogrammetry, SLAM, information extraction, data filtering, point cloud post-processing
ABSTRACT:
In sudden emergency contexts that affect urban centres and built heritage, the latest Geomatics technique solutions must enable the demands of damage documentation, risk assessment, management and data sharing as efficiently as possible, in relation to the danger condition, to the accessibility constraints of areas and to the tight deadlines needs. In recent times, Unmanned Vehicle System (UAV) equipped with cameras are more and more involved in aerial survey and reconnaissance missions, and they are behaving in a very cost-effective way in the direction of 3D documentation and preliminary damage assessment. More and more UAV equipment with low-cost sensors must become, in the future, suitable in every situation of documentation, but above all in damages and uncertainty frameworks. Rapidity in acquisition times and low-cost sensors are challenging marks, and they could be taken into consideration maybe with time spending processing. The paper will analyze and try to classify the information content in 3D aerial and terrestrial models and the importance of metric and non-metric withdrawable information that should be suitable for further uses, as the structural analysis one. The test area is an experience of Team Direct from Politecnico di Torino in centre Italy, where a strong earthquake occurred in August 2016. This study is carried out on a stand-alone damaged building in Pescara del Tronto (AP), with a multi-sensor 3D survey. The aim is to evaluate the contribution of terrestrial and aerial quick documentation by a SLAM based LiDAR and a camera equipped multirotor UAV, for a first reconnaissance inspection and modelling in terms of level of details, metric and non-metric information.
* Corresponding author
1. INTRODUCTION
In recent years, we can affirm that the increasing use of remoted piloted system (RPAS) equipped with cameras have already improve its role in competitiveness and efficiency in surveying operation on the field. The phenomenon is covering nowadays many application domains (geomatics, geotechnics, archaeology, forestry, structural analysis, etc). The current aspect is connected to the diffusion of a large number of operators (not expert people as well) and concurrently to the efficient image-matching algorithm based of SfM photogrammetry even more suitable for 3D information extraction from images and frames videos acquired by compact cameras embedded in low cost commercial drones. This technique is moving in a very profitable way in many contexts, and mostly popular in the direction of 3D documentation and monitoring Cultural Heritage sites (Chiabrando et al, 2016a; Ruiz Sabina et al. 2015; Remondino et al., 2011; Lerma et al., 20122). The use of drone is equally diffuse in these last years in urban areas involved in natural disaster for preliminary search and rescue, building damage assessment (BDA) yet (Fernandez Galarreta, J. et al, 2015; Meier, P. 2016). This is sometimes preferred than the more traditional vertical images from remote sensing data. Due to their scale, their geometric configuration and ultimately their intrinsic features, satellite imaging does not satisfy the requirements of details and information. (Lemonie et al, 2013; Rastiveis et al., 2013; Gerke, & Kerle, 2011). The first data acquisition phase, to be done as quickly as possible after a disaster, is ordinarily carried out in person with manty efforts by technicians in damaged sites and is a heavy
time-consuming operation. Rapidity in acquisition times must be effectively balanced with post processing times, as well as the time-cost ratio must be successful, in favor of low-cost sensors with their top efficiency, as the best possible compromise between timeliness and accuracy (Lemonie et al, 2013). It must maximize, ultimately, the density of data and the metric data extraction from 3D models processed ex post, without neglecting productivity in ex ante data acquisition in emergency circumstances, where the practicability of spaces connected to the high risk they could cause, can adversely affect the quality of data. Moreover, 3D models already are, and could be increasingly in the near future, an essential platform of dense information for interdisciplinary teamwork on the object of study, which will be analyzed in remote, in a second step, for many purposes. They could be, for example: emergency measures of rescue and second aid for civil protection and firefighters, or for damage detection and structural assessment, and for planning a structural strengthening project, or even historical documentation studies as well as restoration analysis and intervention.
This paper wants to base its proposal on the possibility of interpretation and classification of metric and non-metric information starting from high-scale photogrammetric models and data extraction from them. This process is planned in the direction of quick surveys and targeted operation helpful to assess the state of conservation and seismic damage in these types of building belonging to a precarious context. The selection of survey methods depends primarily on these issues, and then it is influenced by needs of information detection on those models. Metric data and its extraction constitutes the The International Archives of the Photogrammetry, Remote Sensing and Spatial Information Sciences, Volume XLII-2/W3, 2017
unavoidable base on which to base non-metric information, as visual and qualitative ones. Here we will focus the analysis on image-based techniques for quick 3D modelling, using multi point of view image acquisition by RPAS and exploiting them together with integration of terrestrial acquisition, for Cultural Heritage documentation, specifically in disaster areas, as the one of Pescara del Tronto, in center Italy. Here a strong earthquake occurred in August 2016, and where current ongoing seismic shocks still take place. The moment magnitude of this event is listed as 6.0 by INGV (Istituto Nazionale di Geofisica e Vulcanologia, http://cnt.rm.ingv.it/), that places the hypocentral depth of the event at 8 km. The 24 August event was followed by two additional earthquakes: a moment magnitude 5.9 event on 26 October, and a moment magnitude 6.5 event (the largest event) on 30 October. Here it requires urgent quick survey, damage assessment, and measures of safety and consolidation.
2. MULTI-SENSOR MODEL COMPLEXITY
A 3D survey for damage sites needs some important consideration in terms of time-costs as well as human involvement, on balancing the acquisition phase resources and the processing ones. Traditional survey techniques have restrictions in different issues.
Ground-based mapping is complex, sometimes dangerous for expert operators and data acquisition are largely limited to terrestrial point of view and façade information. On the other hand, medium range image-based mapping is typically restricted to vertical views for the roof condition, but for collapses, lower levels of damage are much harder to map, because such damage effects are largely expressed along the façades, which are not visible in such imagery (Gerke, M., Kerle, N, 2011).
Most operational post-disaster damage mapping, such as the processing of satellite data acquired through the International
Charter “Space and Major Disasters”
(https://www.disasterscharter.org), remains based on visual interpretation (Kerle, 2010; Voigt et al., 2011). Anyway, also high resolution satellite images, due to their scale, their geometric configuration and ultimately their intrinsic features, do not respond comprehensively the demand of details and information for the scale and complexity of urban context in order to a clear identification of the damage (Lemonie et al, 2013; Rastiveis et al., 2013; Gerke, & Kerle, 2011). Multi perspective oblique imagery, as it is known in literature, seems to be the profitable solution to maximize detail on buildings (Fernandez Galarreta, J. et al, 2015). For the 3D data processing, many ways can be followed: from a merely visual one for qualitative information, to an manual one, managed by operator on points clouds and 3D models, up to an automatic data extraction. Automatic image analysis techniques for building damage assessment (BDA) can be broadly grouped into pixel and object-based methods. (Fernandez Galarreta, J. et al, 2015)
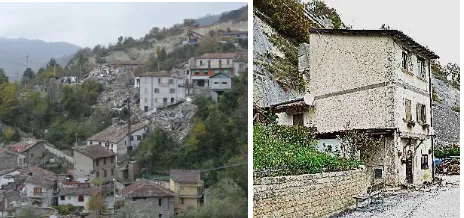
For damage assessment we have thus to chase the solution of integration and/or fusion of nadiral oblique cameras where possible, integrated by terrestrial information only if necessary. These multi-sensors models are a kind of complex informative database that must approaching to be a final-use based model: metric and non-metric informationdefine thegeometric and conservative characterization. For example, the structural analysis and damage assessment on masonries, in this case for post-earthquake contexts, establishes the setting up of damage scenarios on preliminary interpretation and evaluation of visible damages features on the objects, and then on the classification on EMS-98 scale (European Macroseismic Scale) of damage based on building types. The potential of metric and non-metric information enclosed in high-definition 3D point clouds and models by quick mapping are many and very interesting to the Extreme Events Reconnaissance Association) were involved in three reconnaissance and metric high-resolution survey missions (in next September, October, November) for rapid mapping and multi-sensors documentation of urban areas deeply repeatedly damaged by shocks. Different villages has been involved, such as Pescia, Pescara del Tronto (Figure1a), Cittareale, Accumoli, Norcia, Castelluccio, Amatrice, etc. The present paper is focused on the ancient perched village of Pescara del Tronto, in Arquata del Tronto municipality where a group of differently damaged buildings (Figure 1b) were selected. In this area 3D image-based metric survey has been performed, with combined use of terrestrial and aerial sensors.
Figure 1. Pescara del Tronto perched village, in Arquata del Tronto, AP, October 2016 (left). The object of focus: a stand-alone damaged building (right).
3.1 Data acquisition
In the specific test area of a stand-alone damaged building, an integrated metric survey has been conducted and was tested in order to evaluate both information and processing resources. It’s important to underline that, due to the sequence of earthquakes, the access at many damage sites of interest remains difficult because the sites were (and still are) located in restricted red zones, and are dangerous because many of the structures are unstable and still prone to collapse. For these problematic sites, the preferred approach to investigate their damage involved the use of photogrammetric-based acquisition using UAV, which were integrated with traditional close-range terrestrial acquisition systems, wherever feasible.
3.1.1 Reference system definition. In order to define a common reference system for the RPAS and terrestrial acquisition, GNSS and total station measurements were performed. As aerial ground control points (GCPs) several marker were placed on the area and then measured using the GNSS in RTK mode (Figure 2a). Together with the GNSS measurements, some natural points using a total station side shot approach were measured on the façades of the damaged buildings in order to use it during the photogrammetric process. The measured points were georeferenced in a common reference system (UTM-WGS 84 Fuse 33 N ETRF 2000) using the information derived from the Italian Dynamic permanent network controlled by the Italian Geographic Military Institute (IGM http://www.igmi.org/).
The whole area in Pescara del Tronto involved in metric survey was covered by almost n°40 GCP materialized on ground by target as Figure 2a. Three of these aerial target where positioned in the neighbourhood of the damaged building. Moreover, for each building that was measured and imaged by multisensor The International Archives of the Photogrammetry, Remote Sensing and Spatial Information Sciences, Volume XLII-2/W3, 2017
acquisitions, a set of natural points were detected on object. For this stand-alone damaged building n°35 points have been measured (Figure2b) on the main elements, as the roof edges, the façade, the windows and the door, the stone elements, useful for both the aerial and the close-range blocks.
Figure 2. Survey operation with the Geomax Zenit 35 GNSS (left), Leica TS06 total station survey (right)
3.1.2 Close-range acquisition. Notwithstanding the site challenges that have made us think about sensor choice and acquisition planning, the higher part of Pescara del Tronto village was accessible. Terrestrial LiDAR technique was excluded regardless, due to the emergency purposes of the mission in those sites. Therefore, first of all, a rapid terrestrial close-range accurate acquisition has been performed on several buildings seriously damaged after the first earthquake. Next to the typical terrestrial photogrammetry technique, a quick SLAM based LiDAR technique was tested.
3.1.2.1 Close-range photogrammetry. The images were acquired by a Nikon D800E reflex digital camera equipped with a 24x36mm frame. The camera has a 36 Mpx full-frame CMOS sensor with a pixel size of 4.89μm. Around the building 20 images (7360 x 4912 pixel) have been shot from almost 8 m (Figure 3).Then the cameras were post treated for balancing light and colours and masked for the bundle block adjustment.
Figure 3. A series of terrestrial images and close-range cameras estimated position
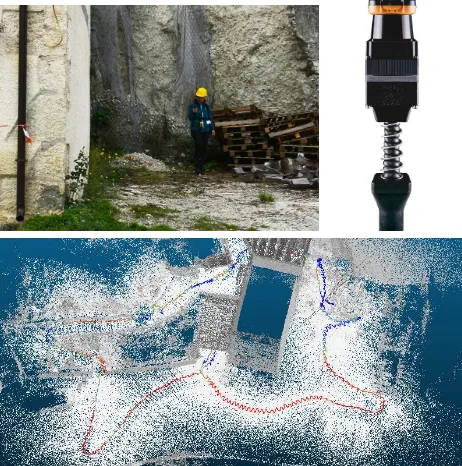
3.1.2.2 SLAM based portable LiDAR: ZEB1 by GeoSLAM. In a post-disaster scenario, and with the need to evaluate the contribution of different methods for the documentation of the damage, we did not lose the occasion to test a 3D mobile mapping system (Figure 4a). Among the available alternatives, we opted for the hand-held Zeb1 system by Geoslam. (http://geoslam.com/)
This device (Figure 4b) consists in a 2D lightweight time-of-flight scanner with 30 m maximum range (Hokuyo scanner) and an Inertial Measurement Unit (IMU), which ensure roughly the position. They are both mounted on a spring so that when the
operator moves in the environment to be mapped, the device swings freely and randomly determining the 2D scanning plane invests the environment generating a 3D point cloud. (Bosse, Zlot, Flick, 2012). The mapping system is based on the Simultaneous Localization And Mapping (SLAM) technology, which is the prominent for indoor environments since it uses the environment to update the position of the device (Riisgaard, Blas, 2005). ZEB1 uses the raw trajectory to roughly calculate the surface normals and potential constraints (features recognition) within a single sweep of the scanner. Then a cloud to cloud registration generate the 3D cloud using an iterative process, which relies on geometric objects and features within the scans. The importance of the features constrains, essential to align subsequent scans, is well visible in Figure 4c that shows how the quality of the recording is less accurate when the operator has moved away from the building. Although the system is provided for outdoor and indoor mapping, the processing presented in the next paragraphs show different accuracies and level of detail for different portions of mapped objects, as other tests do (Thomson et al. 2013). The consideration that the cloud was acquired in just 5 minutes shows the extraordinary interest of this system.
Figure 4 Zeb 1 by Geo-Slam: an acquisition moment (left), the instrument (right). (Down) Geo-Slam path, with quality of
registration attribute in scalar colour
3.1.3 The UAV platforms. The teams incorporated multiple aerial platforms and imaging sensors including COTS (commercial off the shelf) platforms and a customized professional UAV fixed-wing platform. The acquisition strategy for each system varied based on its strengths and capabilities, but provided a wide range of remote sensing data that can be used for subsequent analysis.
3.1.3.1 Fixed wind eBee. The first flight over the settlement of Pescara del Tronto was performed with an eBee™ small UAV platform, manufactured by Sensefly and commercialized in Italy by Menci Software (http://www.menci.com). (Figure 5 right) Here the UAV is equipped with a digital camera Canon Power Shot S110™, which offers a 1/1.7” Canon CMOS sensor, 12 MP images, and a focal length of 5.2 mm. The platform is extremely manageable and very useful for rapid map realization in emergency The International Archives of the Photogrammetry, Remote Sensing and Spatial Information Sciences, Volume XLII-2/W3, 2017
(Boccardo et al., 2015). The eBee system (Figure 5 left) is certified by ENAC as EBM-1539 and it is approved as inoffensive by the Italian Department of Civil Protection too.
Figure 5. eBee platform (left), take-off phase (right)
In order to cover all the damaged area of Pescara del Tronto (approximately 83 ha) three flight with the following characteristics were realized:
• Mean flight elevation 150 m
• Pixel size 5.0 cm
• Lateral overlapping 60 %
• Longitudinal overlapping 85 %
• 354 images
3.1.3.2 Phantom 4. The other flights over Pescara del Tronto were performed using a Phantom 4™ quadrotor small UAV, manufactured by DJI (Dà-Jiāng Innovations Science and Technology Co., Ltd Technologies). The Phantom 4 is equipped with a 4K video camera that has a 1/2.3” CMOS sensor, 94-degree field of view, 12.4 MP images, and a focal length of infinity. The Phantom 4 system weighs 1.38 kg, has a maximum flight time of 28 minutes, and offer the ability to hover and/or collect imagery from vertical faces. Those flights were performed manually with an experienced UAV operator. Imagery from the UAV was transmitted to the operator in real time, and he ensured significant image overlap while manoeuvring the UAV to capture the skewed imagery from objects of interest. This approach was also used successfully following the 2014 Iquique earthquake (Franke et al. 2016).
Figure 6. Phantom 4 DJI piloted drone (in red circle) during aerial acquisition
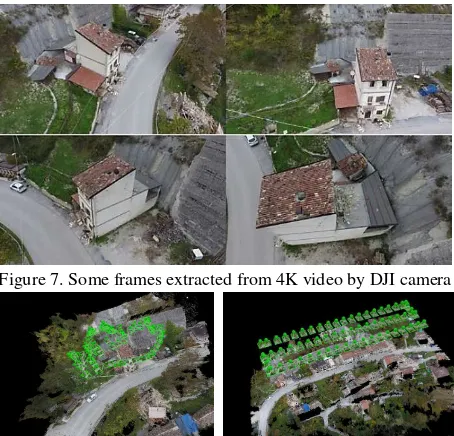
The elevation of the flight with the DJI were performed at an elevation between a maximum of 20 m up to a minimum of 10m. In detail using this UAV (Figure 6) the data were acquired following the two available approach: the 4K video recording (and then the frame extraction) and the single shooting set-up, that allow to acquiring nadiral and oblique images and videos (Figure 8). A set of 64 nadiral images were acquired by DJI camera in regular grid as Figure 8b; moreover, almost 140 frames were extracted from the 08:19 min video with 29frames/sec (1frame/3,5sec) (Figure 8a).
Figure 7. Some frames extracted from 4K video by DJI camera
Figure 8. Nadiral and oblique configuration for DJI acquisition
4. DATA PROCESSING AND ASSESMENT
Due to the extremely difficult site, topographic and GPS survey had to be adaptable and rapid. Single Total Station vertex for detail measurements on spot buildings all over the village of Pescara del Tronto were located on aerial target placed on the surrounding, and measured using the GNSS in RTK mode. So the whole data processing is directly affected by the precision of the topographic measurements. Estimated errors on CP for each processing by RMSE analysis (Table1) allow us to choose the last one, the data fusion, as the ground-truth for further analysis.
Table 1. Accuracy on RMSE (m) GCP and CP on processing: eBee flight, DJI flights, fusion of aerial data, close-range acquisition, and total data fusion. We can consider this last one as the best verified result so that it can be used as ground-truth.
For the processing of the photogrammetric oblique and nadiral blocks three commercial software were tested, with different dense image - matching algorithms: Pix4D (https://pix4d.com) by EPFL workflow is based on a Structure From Motion approach (Chiabrando et al, 2016b); Context Capture by Bentley System (https://www.bentley.com), Photoscan Pro by Agisoft (http://www.agisoft.com) (Aicardi et al., 2016). For point cloud treatment, optimization, 3D modelling and analysis 3DReshaper (http://www.3dreshaper.com/) by Tecnodigit-Hexagon and open source Cloud Compare (http://www.danielgm.net/cc) were employed.
A workstation with high performance hardware was used: CPU: Intel(R) Core i7-6800k 3.4 GHz. RAM 128 GB. NVIDIA quadro M2000. For the first processing step each data collection from different sensors were processed in separate blocks:
• Terrestrial close-range photogrammetry
In Pescara del Tronto ZEB1 tool was tested in many area with groups of buildings, with different path development. In the specific test area a 9mln points cloud was processed by automatic SLAM Cloud-to-cloud registration in GeoSLAM Pay-as-you-go cloud processing.
The crucial point of this technology is the control of the trajectory during the movement, which is estimated and corrected because of the 3D cloud acquired using a variation of traditional ICP (iterative closest point) scan-matching (Bosse, Zlot, 2009). The development of the system has taken advantage of the opportunity to help the correction by the execution of closed loop trajectories during the mapping path, which also leads to better assess the overall quality of the final 3D cloud. The marketed system guarantees an absolute accuracy of position variable between 3 and 40 cm depending on the type of environment mapped. (http://geoslam.com/)
In Pescara del Tronto, due to the critical area conformation and the contingent performance of the path, the procedure of cloud registration ended with a residual error of 3 tens of cm. Another advantageous point of the system is that the results are offered as a series of structured datasets, relative to the cloud and the trajectory, offering the ability to segment the cloud using the time function (Fig.9).
Figure 9. ZEB point cloud presented in scalar colours according to acquisition progression with time variable (0-350sec, from red to white), left; first two minutes acquisition sample (right). After a point cloud processing according to the time (time data embedded in the 3D data), segmentation, post registration, georeferencing and optimization, the point cloud was ready to be analysed with other sensors results, with the lack of radiometric information (no RGB data acquired by ZEB1).
4.2 Close-range and aerial photogrammetry
Close-range photogrammetry
LOW MEDIUM HIGH
cameras 20
Avererage GSD (cm/px) 0,198
tie points 4900 30500 20900
point cloud 1130000 4500000 70500000 mesh triangles 25000 300000 14000000 Table 2. Data processing results on close-range photogrammetry
For the close range photogrammetry, three level of quality have been verified (Tab.2); the high performance is undoubtedly the most competitive in terms of accuracy on GCPs and CPs
(Tab.1) and detail on geometry. Time of processing (almost 5 hours), however, is not easily sustainable among the others.
Aerial photogrammetry
eBee nadiral nadiral DJI DJI oblique DJI fusion
cameras 354 64 141 205
av. GSD (cm/px) 5 2,18 1,05 1,51
tie points 1505299 393194 499712 892906 point cloud 104733709 23683497 24061728 45839730 mesh triangles 25302858 1480265 1349212 4186201
Table 3. Data processing results on aerial photogrammetry The aerial acquisition covered two different detail requirements and, as a consequence, two different scales. Ebee complete cameras block was processed to produce a 3D model of the village Time of processing of almost 3 hours provided a HQ point cloud, 3D model and DSM (15Gb data) in environment scale, as we can see in Table 3, GSD is almost 5cm. DJI nadiral images and oblique frames extracted from HQ video have been oriented with GCP and then a fusion model of aerial block was calculated.
4.3 Data fusion.
The analysis of processing data clearly demonstrates the differentiated role of sensors in the contribution for geometry definition. Finally, a data fusion of aerial and terrestrial images were thus implemented, in three progressive level of high processing parameters (Tab.4). Accuracy results in Table 1.
Fusion
LOW MEDIUM HIGH
cameras 225
Avererage GSD (cm/px) 0,925
tie points 59363 285556 1106438
point cloud 3400000 4800000 13539991 mesh triangles 980000 310000 20000000
Table 4. Data processing results on final data fusion
5. EVALUATION OF DATA EXTRACTION: PURPOSES AND PROCEDURES FOR INTERPRETATION AND CLASSIFICATION OF
METRIC INFORMATION
Starting from the initial processing of each dataset, their respective outputs have been selected, organized and combined, in order to evaluate and classify level of detail and usability of the data and for which applicative context. A test area around the building have been chosen (Fig.10). A large amount of information can be extracted from images and 2D/3D production.
Figure 10. Test area (Point cloud data on Table 5)
Test area (1000m2) The International Archives of the Photogrammetry, Remote Sensing and Spatial Information Sciences, Volume XLII-2/W3, 2017
5.1 Qualitative data extraction
Operating camera configuration and sensor integration, it is possible to make the 3D model accessible to different needs and expertise information embedded in 3D data had not to be simply geometric. As we affirmed before, the great part of first building damage assessment (BDA) is still based on visual evaluation and then metric assessment of metric structural condition of buildings, finalized to accessibility constraint.
An aerial model by commercial DJI drone, as in Orthoimage, is highly competitive in terms of quality of RGB information. The standard of comparison is a well-known terrestrial close-range photogrammetry, a solution less viable in these contexts of timing and accessibility to spaces. Most of damages and creeps on all the façades are clearly visible even in the aerial model (as in example in Fig.11), better than in the fusion one.
Figure 11. Orthoimage of the East side. According to the available detail and the accessible qualitative information, the aerial model (oblique and nadiral cameras), can be comparable to the high quality terrestrial photogrammetric one (top), as well
as the fusion model one (centre).
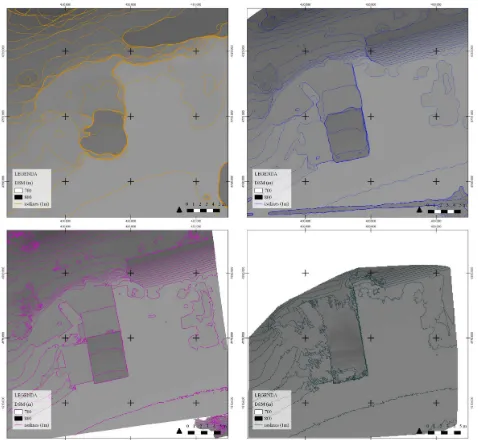
5.2 Aerial Orthoimages and DSM metric data extraction
More reflections that are interesting to be carried out are on the typical aerial representation of the site surface. For a DSM, data extraction could usually concern, for example isolines and elevation points. For the 3D documentation of the building and its surrounding areas at environmental scale, ZEB1 point cloud has provided good results, as in Figure 13. For planimetric information at architectonical scale, a HQ fusion model offers the best level of detail of the building and around (Fig.12).
Figure 12. Comparison for a zoomed excerpt: eBee, average GSD=5 cm/px (left); DJI Phantom, average GSD=2,18 cm/px
(centre); fusion model, average GSD=0.92 cm/px (right)
Figure 13. DSM comparison. Top: eBee DSM (left); DJI DSM (right). Down: fusion model DSM (left); ZEB1 DSM (right).
5.3 3D data optimization. Points cloud and mesh
According to the information extraction strategy, 3D data must be processed for filtering by noise reduction and optimized to finalize a 3D model or 3D information as in next paragraphs. The row data we obtained are:
• Terrestrial photogrammetric point cloud
• Terrestrial point cloud by SLAM based ZEB1
• Aerial point cloud from nadiral eBee cameras
• Aerial point cloud from nadiral DJI cameras
• Aerial point cloud from oblique DJI cameras
• Fusion of aerial cameras
• Fusion model from terrestrial and aerial data Initially we can approach to the modelling with a more volumetric shape and then a more analytical and specific modelling was create (Tab.2-3-4) to test level of detail among sensors in this test object. Fusion model in this instance is much performing in comprehensiveness (Fig.14).
Figure 14. Data fusion model. Top: (left) low and (right) high parameters point cloud. (down) 3D mesh
5.3.1 Characterising architectural sections. We identify some crucial points in the structure in which it could be very useful for a structural reconnaissance after damage event. The main geometrical and structural building condition could be evaluated first of all with a series of horizontal section at entrance level for the ground connection on ground floor (1) and on upper ruined floor (2). Afterwards a sequence of vertical sections could better clarify any geometrical behavior of the façade, the roof and the other main walls. In this example (3) intersects the point of weakness of the chimney axe and possible misalignments and out of plumb of the lateral masonries; in (4) the openings and possible damages of the façade.
5.3.1.1 The longitudinal section (4). A deep analysis is now carried out on a sample section, which is the most significant for the building, because of the requirement of study and measure the volume of the building in relation to the terrain and the vertical rock façade behind.
Section (4) (20cm thick point cloud)
n° pt av. density (pt/m2) st.dev. m M
ZEB 50.444 3.286 1572 9 5100
NIKON high 370.716 27.300 7200 84 37.220
EBEE 806 12 3 1,9 18
DJI
obl 95.119 1.578 658 1 2.970
nad 8.667 128 35 16 197
fusion 102.493 1.666 704 47 3.100
FUSION
low 1.400 18 4 0,6 32
med 12.111 147 31 0,9 228
high 67.400 827 141 1 1256
Table 6. Density data on vertical longitudinal section Density indexes (Tab.6) is here significantly for differentiate the contribution of each sensor for the geometrical definition. Despite the close-range one is the richer in dense points on the façade, is the most non-uniform (st dev), together with the ZEB1 one. As expected, the fusion model presents a uniform distribution of measurements of the whole building in comparison to the aerial one. We can verify than the fusion of models contribute to the geometric definition not in terms of average density, but for the standardisation of distribution.
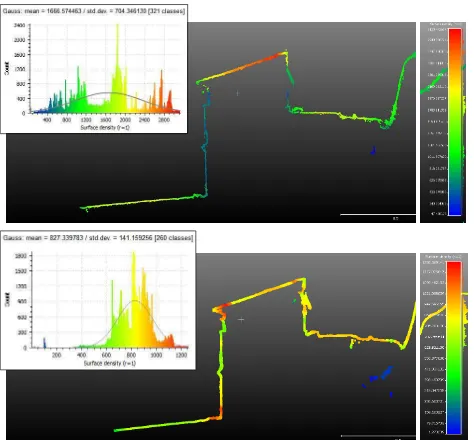
Figure 15-16. Density for aerial point cloud (top). Density for data fusion point cloud (down)
Figure 17. Density for ZEB point cloud Section (4)
We can affirm that the extensiveness data from fusion of terrestrial and aerial images can be integrated with a union of the LiDAR ZEB1 data (Fig.17) that have been georeferenced, in order to produce a complete profile of the building with hits geometry in relationship with the rear rock face.
5.3.1.2 Windows axe. In comparison with the very high scale easily accessible by terrestrial photogrammetry technique (Fig.18), we want to evaluate here the higher level of geometrical definition of aerial acquisition in comparison to a data fusion model from both terrestrial and aerial imaging (Fig.18).
Figure 18. Section (4) on terrestrial photogrammetric model
Figure 19. Section (4) on a zoomed excerpt. From left: nadiral cameras; Oblique cameras, aerial model, HQ data fusion model. The data fusion model offers of course the best solution for both levels of detail on façade elements and 3D point uniformity, for example (Fig.19). Through a sample of deviation of measures on the polyline section, we can affirm that the aerial model is anyway a good compromise if terrestrial feasibility is compromise.
6. CONCLUSION
We presented a step-by-step analysis about procedures to acquire 3D data and how to process points clouds from a multi-sensor acquisition in order to balance competitiveness of resources (human and technical) and effectiveness of metric and non-metric information.
In this case, we can reflect that an high quality model integration of models is preferable instead of a data fusion processing: extreme density on radiometric and metric information by close-range photogrammetry can be fulfil by oblique image processing for upper parts. An indoor mapping, if practicable, can complete the reconnaissance multi-sensor model. In terms of accuracy, the realized The International Archives of the Photogrammetry, Remote Sensing and Spatial Information Sciences, Volume XLII-2/W3, 2017
model by data fusion has finally the lower discrepancy on CPs and better fits with the terrestrial measurements (Figure 20). Unless very accurate information is necessary for specific focus analysis on the building, an aerial model could be suitable; the integration of aerial and terrestrial does not add a significant improvement in level of geometric definition for a first-step damage documentation and assessment, and in any case, the detail of terrestrial imaging could not be reached. Nevertheless, according to the achieved results and preliminary analysis, is possible to underline that a UAV nadiral-oblique close-range acquisition, open to improvement in the use of high resolution cameras, could obtain a very strategic level of information. It is not so much the density that rises using the aerial camera merging, but, of course, is the homogeneousness (st.dev) cloud density, that allows extracting less fractionated sections.
Figure 20. East wall surface analysis: data fusion with terrestrial ground-truth
ACKNOWLEDGEMENTS
The authors would like to thank especially Team Direct (https://www.facebook.com/Team-Direct-461829537253316) and all people involved in the data acquisition, including Andrea Lingua, Paolo Dabove, Paolo Maschio, Lorenzo Teppati Losè and Vincenzo Di Pietra from Politecnico di Torino for the operative phase on field. During the in-site campaign, the Fire Fighters SAPR group accompanied us with dedication, assisted us with people and instruments, and worked together with Team Direct in Pescara del Tronto, Accumoli, Amatrice: we are grateful for this. We acknowledges also GEER team (Geotechnical Extreme Events Reconnaissance Association). We want to mention MESA s.r.l. for ZEB1 and sincerelythank Cristina Bonfanti e Nadia Guardini. We thank above all Politecnico di Torino for promoting and financing the emergency mission in center Italy areas affected by earthquake.
REFERENCES
Aicardi, I., Chiabrando, F., Grasso, N., Lingua, A. M., Noardo, F., Spanò, A., 2016. UAV photogrammetry with oblique images: first analysis on data acquisition and processing, Int. Arch. Photogramm. Remote Sens. Spatial Inf. Sci., XLI-B1, 835-842
Boccardo P., F. Chiabrando, F. Dutto, F. G. Tonolo, A. Lingua, 2015. UAV deployment exercise for mapping purposes: Evaluation of emergency response applications. Sensors, 15 (7), 15717- 15737.
Bosse M., Zlot R., 2009, Continuous 3D scan-matching with a spinning 2D laser, in IEEE Conference on Robotics and Automation.
Bosse M., Zlot R., Flick P., 2012, Zebedee: Design of a Spring-Mounted 3D Range Sensor with Application to Mobile Mapping, IEEE Transactions on Robotics, 28 (5), 1104 – 1119, DOI:10.1109/
Chiabrando, F.; D'Andria, F.; Sammartano, G.; Spanò, A., 2016a. 3D MODELLING FROM UAV DATA IN HIERAPOLIS OF PHRIGIA
(TK). In: 8th International Congress on Archaeology, Computer Graphics, Cultural Heritage and Innovation ‘ARQUEOLÓGICA 2.0', Valencia (Spain), Sept. 5 – 7, 2016. pp. 347-349
Chiabrando, F., Di Pietra, V., Lingua, A., Maschio, P., Noardo, F., Sammartano, G., and Spanò, A., 2016b. TLS models generation assisted by UAV survey, ISPRS Archives, XLI-B5, 413-420, doi:10.5194
Fernandez Galarreta, J.; Kerle, N.; Gerke, M., 2015. UAV-based urban structural damage assessment using object-based image analysis and semantic reasoning. Nat. Hazards Earth Syst. Sci., 15, 1087–1101.
Gerke, M., Kerle, N, 2011. Automatic structural seismic damage assessment with airborne oblique Pictometry© imagery. Photogrammetric Engineering & Remote Sensing, 77(9), 885-898. Kerle, N., 2010. Satellite-based damage mapping following the 2006 Indonesia earthquake – How accurate was it?, Int. J. Appl. Earth Observ. Geoinf., 12, 466-476, doi:10.1016/j.jag.2010.07.004.
Lemoine, G., Corbane, C., Louvrier, C., Kauffmann, M., 2013. ntercomparison and validation of building damage assessments based on post-Haiti2010-earthquake imagery using multi-source reference data. Nat. HazardsEarthSyst.Sci.Discuss., 1(2),1445-1486.
Lerma, J. L., Seguí, A. E., Cabrelles, M., Haddad, N., Navarro, S., Akasheh, T., 2011. Integration of laser scanning and imagery for photorealistic 3D architectural documentation. INTECH Open Access Publisher. DOI: 10.5772/14534
Maier, P., 2016. Assessing Disaster Damage: How Close Do You Need to Be?. In: https://irevolutions.org/2016/02/09/how-close/
Rathje, E. M., Franke, K., 2016. Remote sensing for geotechnical earthquake reconnaissance. Soil Dynamics and Earthquake Engineering, 91, 304-316.
Rastiveis, H., Samadzadegan, F., and Reinartz, P.: A fuzzy decision making system for building damage map creation using high res-olution satellite imagery, Nat. Hazards Earth Syst. Sci., 13, 455–472, doi:10.5194/nhess-13-455-2013, 2013
Bosse M., Zlot R., Flick P., 2012, Zebedee: Design of a Spring-Mounted 3D Range Sensor with Application to Mobile Mapping, IEEE Transactions on Robotics, 28 (5), 1104 – 1119, DOI:10.1109. Remondino, F., Barazzetti, L., Nex, F., Scaioni, M., Sarazzi, D. (2011). UAV photogrammetry for mapping and 3D modeling–current status and future perspectives. ISPRS Archives, 38(1), C22. DOI: 10.5194/isprsarchives-XXXVIII-1-C22-25-2011
Riisgaard S., Blas M., 2005. Slam for Dummies. A Tutorial Approach to Simultaneous Localization and Mapping, In: http://ocw.mit.edu/NR/rdonlyres/Aeronautics-and-Astronautics
Ruiz Sabina, J., Gallego Valle, D., Peña Ruiz, C., Molero García, J., & Gómez Laguna, A., 2015. Aerial Photogrammetry by drone in archaeological sites with large structures. VAR, 6(13), 5-19. doi:http://dx.doi.org/10.4995/var.2015.4366
Thomson C., Apostolopoulos G., Backes D., Boehm J.,2013, Mobile laser scanning for indoor modelling, ISPRS Annals, Volume II-5/W2, doi:10.5194/isprsannals-II-5-W2-289-2013.
Voigt, S., Scheneiderhan, T., Twele, A., Gahler, M., Stein, E., and Mehl, H., 2011. Rapid damage assessment and situation mapping: learning from the 2010 Haiti earthquake, Photogram. Eng. Remote Sens., 77, 923–931.