CROSS-CALIBRATION OF THE RAPIDEYE MULTISPECTRAL IMAGER PAYLOADS
USING PSEUDO-INVARIANT TEST SITES
Michael Thiele*, Cody Anderson, Andreas Brunn
RapidEye AG, Calibration & Validation, 14776 Brandenburg an der Havel, Molkenmarkt 30, Germany, [thiele, anderson, brunn]@rapideye.net
Commission I/3
KEY WORDS: Calibration, radiometric, pseudo-invariant sites, relative calibration, cross-calibration, RapidEye
ABSTRACT:
Radiometric calibration of the RapidEye Multispectral Imager (MSI) as with all other remote sensing instruments is an essential task in the quantitative assessment of sensor image quality and the production of accurate data products for a wide range of geo-spatial applications. Spatially and temporally pseudo-invariant terrestrial targets have long been used to quantify and provide a consistent record of the radiometric performance of Earth observation systems. The RapidEye cross-calibration approach combines temporal and relative calibration to ensure temporal stability in spectral response between it s 5 identical MSI over time by using a large number of repetitive collects of many pseudo-invariant calibration sites. The approach is characterized by its known reliability which is based on the purely statistical analysis of many ground collects with ground infrastructure or measurement systems not being necessary. The results show that the in-band percent difference in the measured response among all RapidEye sensors is less than two percent. Although the results show some offsets between the different sensors, the response of the RapidEye constellation over a three-year period is very stable.
* Corresponding author
1. INTRODUCTION
This paper focuses on the Cross-Calibration of the 5 RapidEye MSI. The introduction gives an overview of the constellation, the image properties and the calibration concept. Section 2 discusses the current cross-calibration method and its significance within the long-term calibration approach. The operational approach is reviewed and the results are presented in Section 3.
1.1 Constellation
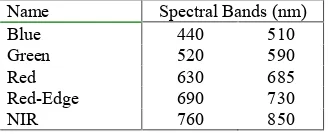
The RapidEye constellation was launched in August 2008. It consists of 5 identical Earth observation satellites each equipped with the same type of multispectral imager. The spectral range covers 5 bands in the visible and near infrared (Blue, Green, Red, Red-Edge, NIR).
Name Spectral Bands (nm)
Blue 440 510
Green 520 590
Red 630 685
Red-Edge 690 730
NIR 760 850
Table 1. RapidEye Spectral Bands
The designed mission lifetime was 7 years, however, the current state of the consumables and the system health lets expect a noticeably longer lifetime.
1.2 Image Data
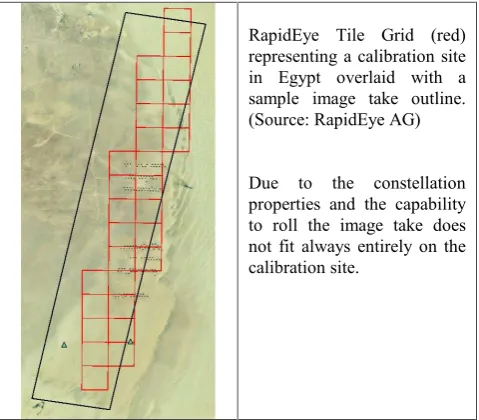
RapidEye Tile Grid (red) representing a calibration site in Egypt overlaid with a sample image take outline. (Source: RapidEye AG)
Due to the constellation properties and the capability to roll the image take does not fit always entirely on the calibration site.
Figure 1. RapidEye Calibration Site EgyptC 1.3 Calibration Concept
The RapidEye mission calibration concept is based on three major phases: pre-launch initialization of calibration factors in the laboratory, post-launch determination of operational calibration settings and on-orbit maintenance. The third phase started with the end of the commissioning phase in February 2009 and will continue until the end of the mission lifetime. The RapidEye Radiometric Calibration Components are Spatial Calibration, Temporal Calibration and Absolute Calibration. The Spatial Calibration compensates for pixel-to-pixel response variations (striping, banding). A statistical approach which uses the mean detector response for each detector (CCD) over a variable timeframe as well as a side slither approach is used to achieve equal response for each detector (Anderson, 2011). The Temporal Calibration measures the in-band response across all five MSI in the constellation and corrects for MSI to MSI variations and thus keeps the detector response stable over the constellation and over the mission life. The reason why temporal calibration is particularly important to RapidEye is, that it is arbitrary which satellite is used for an image so that all images are directly comparable to each other (Brunn 2010). The product requirement achieved with this calibration component is that the response between the same bands on the different spacecraft over the whole mission lifetime of the constellation is always within 5%. The Absolute Calibration consists of a reflectance based vicarious calibration campaigns to provide known radiance input and produce individual sensor responsitivity data (Naughton, 2011).
This paper describes the Cross-Calibration of the 5 MSI as part of the Temporal Calibration Component of the RapidEye calibration approach. spatial radiometric homogeneity and a low degree of temporal variance is chosen for use as radiometric calibration sites. Images from these sites are taken bi-monthly. It is assumed that the sensor response from these sites should be the same for all 5 cameras, and should not vary over time.
The average response from all satellites in a given band over a calibration tile is used as a baseline for the calibration tile. After the baseline has been established, the current response from each satellite is periodically compared to the baseline for the band. If it is determined that over time the response of a particular band for a particular imaging sensor is trending away from its corresponding baseline, then its response is corrected back towards the baseline using derived Gain and Offset tables. Keeping the response of all imaging sensors close to the corresponding baseline, ensures a uniform radiometric response across all 5 RapidEye imagers. (Brunn 2009&2010)
The cross-calibration baseline is defined as the mean of the tile means of the chosen calibration tiles over time, i.e. the average of all acquired tile means. A tile mean represents the mean of all imaging pixels of one image tile (25*25km subsection of an image take).
The mean and standard deviation of each RapidEye tile is stored during the pre-processing process. The tile standard deviations are used to judge the quality of each tile in comparison to previously acquired tiles. Tiles with too high of a standard deviation are not used in the calculation of the overall tile mean. If a trend is observed that is or will soon cause the difference between a certain band s response and the baseline to exceed the threshold, the tile means are used to adjust the calibration settings. A weighted least squares linear fit to all radiometric calibration tile means is used to calculate the settings. The weights are inversely proportional to the baseline radiometric calibration site standard deviation (Beckett, 2007).
G1*Ti,j G0
*MMi,j
O1*Ti,j O0
i
where Ti,j is the time since last calibration for sample j of
calibration site i
BMi,j, is the baseline mean
MMi,j is the measured sample mean
G1 and G0 describe the trend in radiometric
sensitivity with time
O1 and O0 describe the trend in radiometric
sensitivity with time
The radiometric response trend values (G and O) are then used to refine all of the on-ground per-detector gain and offset correction parameters (Beckett, 2007).
gaini' = gaini * G
Figure 2. Per-Band Calibration for a single Satellite and Band (Beckett, 2007. © MDA)
As a result, long term degradations are corrected from the images. To a certain degree though, image to image variation is still expected due to atmospheric, looking geometry, BRDF and other effects.
It is important to note that the presented approach makes a couple of assumptions (Becket, 2007):
1.) The calibration sites response are lambertian: the variance in scattered radiance does not vary by the sun- and sensor incidence angle (rolling of spacecraft).
=> The used tile means have been averaged over a 25*25km area. Any errors due to this assumption have not been quantified as yet, but are expected to be insignificant.
2.) The distribution of the image DNs is Gaussian. => This assumption was validated during operations. 3.) The error sources are independent.
=> The well known sources of dependent error (sun angle, earth-sun distance) have been compensated for. If at a later stage, sources of errors which are not independent are discovered, then these should be quantified and similarly compensated for.
The combination of the relative and temporal component of the RapidEye cross-calibration method is realized by correcting any degradation of the individual sensors back to the initially set up baseline. The repetitive imaging and monitoring of homogeneous and temporally stable calibration sites serves as basis for this approach.
2.2 Calibration Sites
The RapidEye calibration sites are scheduled for imaging on a bi-monthly basis. The initial set of calibration sites in 2008/2009 consisted of 20 sites. Over time new sites were added to the list while some sites were removed. The removed sites had become unstable or a sufficient sample size could not be guaranteed. The acquisition success is carefully monitored so that there are on average 6-8 cloud free images per site per spacecraft in 12 months.
The adding and removing of calibration tiles from the calibration process is expected to be an on-going process due to the possibility of sudden changes of calibration sites.
The selection criteria for calibration sites: Relatively homogeneous surface Relatively flat terrain
Minimal seasonal variation (vegetation) Distance to water bodies (haze)
Distance to urban / industrial areas (aerosols) Low competition with customer orders
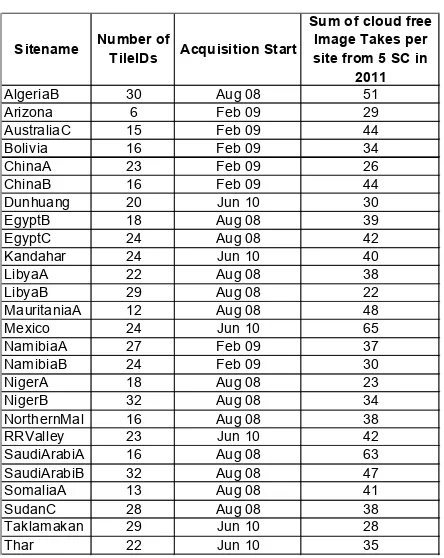
RapidEye currently images 26 calibration sites all around the world. These sites are mainly desert areas due to deserts being the most suitable sites (Cosnefroy, 1996).
Sitename Number ofTileIDs Acquisition Start
Sum of cloud free
Table 2. RapidEye Acquired Calibration Sites in 2011 The number of useful images per site is dependent mostly on the competition with customer orders and the likeliness of clouds or sandstorms.
Figure 4. RapidEye Calibration Sites (red) 2.3 Operational Approach
The basic parts of RapidEye s cross-calibration are listed below:
Calibration Sites Acquisition A set of calibration sites is imaged on an on-going basis.
Pre-selection The acquired images are visually and statistically checked on a monthly basis. Image tiles that are not qualified for the calibration (clouds, haze, sandstorms) are labelled in the metadata accordingly.
Tile Selection The tile id selection determines which parts of the calibration sites are suitable for calibration (spatial selection) and which images of these sites shall be used (removal of unsuitable images).
Baseline Setup For each calibration tile a pixel mean is calculated and stored as the baseline tile mean
Baseline Check The observed tile means are compared to their corresponding stored baseline means and update parameter are determined.
Update Gain and Offset factors are used for on-ground radiometric correction tables updates.
In order to be sure that the made assumptions (see 2.1) stay valid and that the sample size is sufficient for the desired uncertainty in cross-calibration, basis all acquired image tiles over calibration sites are visually checked on a monthly basis and bad ones (clouds, sandstorms) are marked as not suitable for calibration in the database. Every six month the calibration tiles are checked for changes in the ground features. Changes on-ground can be man-made structures or climatic impacts. The operational approach for cross-calibration is designed in a way so that it is possible to add or remove certain calibration tiles from the calibration tiles list whether they have been used in previous updates or not.
Prior to being used for baseline generation or temporal calibration, tile statistics retrieved from the database are first normalized. The tile statistics are normalized to account for the effects of the variations in Earth distance and Sun-Elevation angle during imaging.
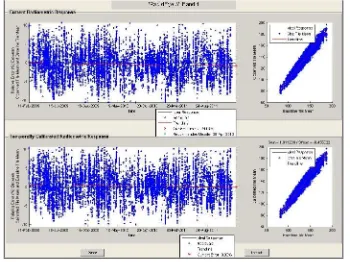
During nominal operations the relative and temporal calibration is routinely checked on a monthly basis by reviewing the so-called Radiometric Response Plots. These plots are used to identify a trend in the radiometric response. Each plot (one per Band and spacecraft) shows the relative difference ( Residuals ) between retrieved ( Observed ) tile means and their corresponding baseline means, as a percent error, versus mission time.
Figure 3. Radiometric Response Plot Example (© MDA)
A MatLab based Tool is used to generate the radiometric response plots. The tool queries the database for the needed inputs (observed means & baseline means) and, calculates and plots the residuals of all used tile means over specified time ranges. If the calibration operator identifies a clear trend the tool is used to implement updates in the image processing chain. The output of the tool is a gain and an offset value to be applied to every detector across the CCD of the most recent on-ground gain and offset table. These updates are incremental so that each update is based on the previous one.
2.4 Results
More than 20 calibration sites have been imaged since February 2009 for the RapidEye cross-calibration. As a result, there are on average 6 - 8 usable images (i.e. no clouds or other influences) per site, per spacecraft, per year available.
The relative calibration, i.e. the deviation among the spacecraft in the 5 bands, is less then 2%. So far, no significant trends in temporal calibration were detected. The current radiometric cross-calibration results are expressed as error percent of the deviation to the response baseline. 1% uncertainty is expected. The results for the five spacecrafts are shown in the following table:
Band RE1 RE2 RE3 RE4 RE5 max -min Blue -0,28 -1,11 -0,54 -0,28 -1,4 1,12 Green -0,25 -1,02 -0,11 -0,04 -1,49 1,45 Red 0,46 -1,1 -0,14 0,11 -0,91 1,56 Red-Edge 0,48 -0,28 0,07 0,65 -0,64 1,29 NIR 0,58 -0,63 0,18 0,17 -0,67 1,25
Table 3. Response Deviation from Baseline in error percent
Blue Green Red Red-Edge NIR
Figure 5. Cross-Calibration Results Diagram in Error Percent
3. CONCLUSION
REFERENCES
Anderson, C., Naughton, D., Brunn, A., Thiele, M., 2011. Radiometric correction of RapidEye imagery using the on-orbit side-slither method. Proc. SPIE 8180, Prague, Czech Repiblik. Beckett, K. 2007. RapidEye Calibration Concepts. MacDonald, Dettwiler and Associates Ltd., Canada. Internal paper, not published.
Brunn, A., 2010. The calibration procedure of the multi-spectral imaging instruments on board the RapidEye remote sensing satellites, Proc. EuroCow2010, Castelldefels, Spain.
Brunn, A., Douglass, S., Weichelt, H., Beckett, K., 2009. The RapidEye Calibration Approach and Current Results. Proc. JACIE2009, Washington, DC, USA.
Cosnefroy, H., et al., 1996. Selection and characterization of Saharan and Arabian desert sites for the calibration of optical satellite sensors. Remote Sensing Environment, 58:101-114. 1996. New York, USA.
Naughton, D., et al, 2011. Absolute radiometric calibration of the RapidEye Multispectral Imager using the reflectance-based vicarious calibration method. SPIE Journal of Applied Remote Sensing, 5. Boulder, Colorado, USA.
RapidEye AG image product specification. 2012. RapidEye AG, Brandenburg, Germany.
ACKNOWLEDGEMENTS
The authors thank especially the Space and Operations teams at RapidEye AG for their assistance in acquiring the image data in support of the calibration team.
Additional thanks goes to MacDonald Dettwiler & Associates Ltd. Canada (MDA) as the sub-contractor of RapidEye for designing and establishing the RapidEye System.