107
The Impacts of Perceived Advertising Spending and Price Promotions on Brand
Equity: A Case of An Indonesian Instant Noodle Brand
Steven Tamara
International Business Management Program, Petra Christian University Jl. Siwalankerto 121-131, Surabaya
E-mail: [email protected]
ABSTRACT
One of Indonesia’s largest producers of instant noodle has the long term vision to make its brand Indonesia’s number one instant noodles brand. Heavy advertising and intense price promotions are part of its strategy to increase the brand equity. The researcher, therefore, wishes to examine whether advertising and price promotions that the company conducts contribute to the instant noodle brand equity.
To test the impacts of perceived advertising spending and price promotions on brand equity and its dimensions (perceived quality, brand loyalty, brand awareness, brand image), a quantitative approach is employed, using 35-item, 5-point Likert scale questionnaires. All of the respondents are coming from Surabaya area, altogether 105 respondents chosen using simple random sampling method. Pearson Correlation and Multiple Regression analysis methods are used to examine the result. The result has two conclusions. First, perceived price promotions have significant positive effects on brand equity. Second, perceived advertising spending has no significant effect on brand equity.
Keywords: Perceived Advertising Spending, Perceived Price Promotions, Brand Equity, Instant Noodle.
ABSTRAK
Salah satu produsen mie instan terbesar di Indonesia memiliki visi jangka panjang untuk membuat merek mie instan miliknya menjadi merek mie instan nomor satu di Indonesia. Iklan yang gencar dan promosi harga yang intens adalah bagian dari strategi untuk meningkatkan ekuitas merek tersebut. Maka, peneliti ingin menguji apakah iklan dan promosi harga yang dilakukan perusahaan tersebut berkontribusi pada ekuitas merek mie instan tersebut.
Untuk menguji pengaruh persepsi belanja iklan dan promosi harga pada ekuitas merek dan dimensi-dimensinya (persepsi kualitas, loyalitas merk, kesadaran merek, citra merek), pendekatan kuantitatif digunakan, dengan kuesioner berisi 35 pertanyaan dengan skala Likert 5 poin. Seluruh responden berasal dari Surabaya, total sejumlah 105 responden dipilih dengan metode sampel acak sederhana. Metode korelasi Pearson dan analisa Regresi Berganda dipakai untuk memeriksa hasil pengumpulan data. Hasilnya menunjukkan beberapa kesimpulan. Pertama, persepsi promosi harga memiliki pengaruh positif yang signifikan terhadap ekuitas merek. Kedua, persepsi belanja iklan tidak memiliki efek yang signifikan terhadap ekuitas merek.
Kata Kunci: Persepsi Belanja Iklan, Persepsi Promosi Harga, Ekuitas Merk, Mie Instan.
Introduction
To achieve competitive advantage, firms typically try to differentiate themselves from the competition by building a strong brand that has high brand equity (Aaker, 1991; Bharadwaj et al., 1993; Keller, 2012). A brand can do this since it is a name, term, sign, symbol or feature which distinguishes one seller’s goods and services from the others (Bennet, 1995). A brand helps firms to communicate their values to the consumers and get connected to their minds and hearts (Keller, 1993). A brand can also create customer
satisfaction since it is able to provide both functional and emotional benefits (Hankinson and Cowking, 1996). Aaker (1996) even claimed that a brand is the main property of a company. Therefore, brands must be managed strategically by building brand equity (Wood, 2000).
108 impact on brand equity (Maxwell, 1989; Chay and Tellis, 1991; Simon and Sullivan, 1993; Boulding et al., 1994). In contrast, other researchers believe that price promotions only damage brand equity (Aaker, 1991; Yoo et al., 2000). The Habig question of whether this is still true in the 21st century, especially in the Indonesian market, is not concluded yet.
Hence, this paper aims to model the effects of perceived advertising spending and price promotions on brand equity. Four main problem statements are developed: (1) Do perceived advertising spending and price promotions simultaneously have significant effects on brand equity? (2) Do perceived advertising spending and price promotions individually have significant effects on brand equity? (3) Do perceived advertising spending and price promotions simultaneously have significant effects on each dimension of brand equity? (4) Do perceived advertising spending and price promotions individually have significant effects on each dimension of brand equity? The industry chosen for this research is the Food and Beverage (F&B) industry in Indonesia, specifically the instant noodles market with a focused analysis on one of the local instant noodle brands. Brand Equity as a Multidimensional Concept
Yoo et al. (2000) defined brand equity as “the difference in consumer choice between the focal branded product and an unbranded product given the same level of product features” (p. 196). Intention to buy and preference for the focal brand over the no-name counterpart are the main indicators of that difference in consumer choice (Yoo et al., 2000).
Many researchers have generally agreed that brand equity is a multidimensional concept. Shocker and Weitz (1988) firstly introduced brand loyalty and brand associations, while Keller (1993) suggested brand knowledge which consists of brand awareness and brand image. Aaker (1991, 1996) proposed the most number of brand equity dimensions—five dimensions were mentioned: brand loyalty, brand awareness, perceived quality, brand associations, and other proprietary brand assets. Yoo et al. (2000) claimed perceived quality, brand loyalty, and brand awareness with strong brand associations as the dimensions of brand equity.
This study follows the most recent proposal by Villarejo and Sánchez (2005), which acknowledged brand image instead of brand associations, with similar meaning. That leaves brand equity with four main dimensions— perceived quality, brand loyalty, brand awareness, and brand image. Previous researchers (Leuthesser, 1988; Farquhar, 1989; Yoo et al., 2000) pointed out that brand equity could be created, maintained and intensified by strengthening one of its dimensions. Having brand equity represent the total effect of investment in the brand, any marketing effort should have a potential effect on brand equity (Villarejo and Sánchez, 2005).
Perceived quality is a global consumer judgment of the superiority of the product or service integrating consumer expectations and perceptions. According to Zeithaml (1988), high perceived quality reflects the long
experience that consumers have had with the brand which make them recognize the differentiation and superiority of the brand. High perceived quality would drive consumers to pick the brand over other competing brands, as suggested by Zeitahml (1988). As a consumer perception, perceived quality is personal and subjective because judgments about what is important to customers are involved (Anderson and Sullivan, 1993; Chen, 2001; Olsen, 2002). However, perceived quality is usually determined by characteristics of the product nature (Aaker, 1991). Hence, perceived quality is indicated by (1) consumer overall judgment of the product quality; and (2) consumer evaluation of the specific intrinsic characteristics attached to the product (Aaker, 1991).
The most general definition of brand loyalty is found in Oliver (1999), as “a deeply held commitment to re-buy or re-patronize a preferred product or service consistently in the future, thereby causing repetitive same brand or same brand set purchasing, despite situational influences and marketing efforts, having the potential to cause switching behavior” (p. 392). Brand loyalty is usually understood within two perspectives: attitudinal loyalty and behavioral loyalty (Dick and Basu, 1994). Nonetheless, Olsen (2002) suggested that the common assessment of loyalty is related with behavioral measures rather than attitudinal measures. Likewise, Ha et al. (2011) defined brand loyalty as “a behavioral response expressed by a composite measure with respect to a preferred product or service in the future” (p. 676). This difference in behavior is commonly indicated by routine purchase frequency of the brand and resistance to switch to another brand (Yoo et al., 2000).
Villarejo and Sánchez (2005) defined brand awareness as the potential capacity that a consumer has of recognizing and recalling the name of the brand as an offer of a certain category of product. As an element of brand equity, brand awareness affects consumer decisions at the affective and the behavior level (Villarejo and Sánchez, 2005). Affectively, a feeling of pleasure and familiarity is generated if the consumers know the brand which increases its probability of purchase among other brands (Aaker, 1991). Keller (2012) suggested that the indicators of brand awareness are brand recognition and brand recall. Brand recognition refers to the “consumer’s ability to confirm prior exposure to the brand when given a brand as a cue” (Keller, 2012, p. 67). While brand recall is defined as “consumer’s ability to retrieve the brand from memory when given the product category, the needs fulfilled by the category, or a purchase or usage situation as cue” (Keller, 2012, p. 67).
109 consumer, as it is the basis of: (1) differentiation of product; (2) brand name extension; (3) providing a reason to buy, and (4) creating positive feelings about the brand, simultaneously (Aaker, 1992). Villarejo and Sánchez (2005) suggested that brand image could be identified by evaluating tangible and intangible attributes associated with the brand already planted in consumers’ mind.
Perceived Advertising Spending
Advertising is any paid form of non-personal presentation and promotion of ideas, goods and services (Kotler and Keller, 2012). Perceived advertising spending is consumer perception of advertising frequency and expenditure as agreed by Ha et al. (2011) and Hameed (2013). The perceived instead of actual advertising spending is used since it is not feasible to control actual advertising spending and perceived advertising spending plays a more direct role in the consumer psychology than actual marketing efforts (Yoo et al., 2000).
Many researchers have discovered that advertising spending can generate brand equity (Maxwell, 1989; Chay and Tellis, 1991; Simon and Sullivan, 1993; Boulding et al., 1994). Cobb-Walgren et al. (1995) presented that the impact of advertising spending on brand equity as a whole is made up of the individual impacts on each individual dimension of brand equity.
Aaker and Jacobson (1994) and Yoo et al. (2000) found that the more advertising spending for the brand the more consumers have high perceived quality and loyalty for the brand. This is because consumers perceive the level of confidence that marketing managers have in the advertised product through their perception of the product’s advertising spending (Kirmani and Wright, 1989). Intense advertising spending sends a message that the company is investing in the brand or product and shapes the perception of high quality in consumer’s mind (Aaker and Jacobson, 1994).
The investment in advertising spending also creates brand loyalty, both directly and indirectly (Ha et al., 2011 and Hameed, 2013). Earlier researches, for example Agrawal (1996) and Yoo et al. (2000) has proven that advertising spending is a predecessor of brand loyalty.
Shimp (1997) suggested that advertising spending and brand loyalty are positively correlated because advertising strengthens brand-related beliefs and attitudes toward the brand. The perception of advertising spending could lead to brand loyalty since it first increases the probability of the brand being included in the brand alternatives considered by the consumers, resulting in the simplified decision-making process and a consumer habit, which finally leads to brand loyalty behavior (Hauser and Wernerfelt, 1990).
Before brand loyalty is even created, Hauser and Wernerfelt (1990) agreed that advertising first induces brand awareness in consumer’s mind. The level of advertising spending is positively related with advertising recall and indicates brand awareness (Deighton, 1984; Hoyer and Brown, 1990). Moorthy and Zhao (2000) suggest that the primary effect of advertising spending is to increase brand name recognition and create awareness among customers.
Keller (2012) believed that effective marketing communication enables not only the formations of brand awareness it also shapes a positive brand image. The image linked to the brand is a combination of mental pictures the consumer perceives after recognizing them in the advertising messages (Keller et al., 1998). Brand image creation is complex and needs a long exposure to brand information (Aaker, 1991; Alba and Hutchinson, 1987; Yoo et al., 2000). Advertising strength, coming from high advertising spending, helps to develop and shape the image. Perceived Price Promotions
Price promotions are a set of various and short-term price reductions offered to consumers in order to increase their intention to buy a product and speed up the purchase (Gupta, 1988; Boddewyn and Leardi, 1989; Blattberg et al., 1995; Yoo et al., 2000). It usually consists of special sales, coupons, cents-off deals, rebates, and refunds (Yoo et al., 2000; Rahmani et al., 2012).
Previous researches have proposed two main dimensions of price promotions: frequency and depth (Jedidi et al., 1999). Promotion frequency relates with the average number of times a product is promoted over a specific time period whereas promotion depth refers to the percentage of price reduction from its original price (Allender and Richards, 2012). In this study, the researcher will use perceived price promotions rather than the actual measure of price promotions for the same reason as the perceived advertising spending. Here, the researcher tries to accommodate both dimensions of price promotions and defines perceived price promotions as consumer perception of the relative frequency and depth of price deals presented for a brand.
Researchers have generally agreed that price promotions can damage brand equity. Sales promotions are easily imitated and counteracted (Aaker, 1991) and its benefits lie only in the short-term period as sales rise due to momentary brand switching (Gupta, 1988; Villarejo and Sánchez, 2005). However, in the long run, sales promotions may create a low-quality brand image attributed to the consumer confusion arising from the gap between expected and observed prices leading to an image of unstable quality (Winer, 1986; Yoo et al., 2000). This means price promotions have negative effect on perceived quality. The short-term characteristic of price promotions also causes a negative impact on brand image due to its failure to build a long-term brand image that lasts in the mind of consumers (Shimp, 1997).
110 the transaction utility that the price promotions provide (Yoo et al., 2000). This brand-switching behavior is only temporary since it is based on an external cause (i.e., the price promotions) instead of an internal cause, for instance, the product characteristics (Dodson et al., 1978). Once the external cause disappears, so does the behavior.
In conclusion, literature has pointed out that price promotions affect both perceived quality and brand image whereas the effects on brand loyalty and brand awareness are insignificant (Yoo et al., 2000). Despite impacting only two dimensions, perceived price promotions are still considered to have significant effects on brand equity as a whole since the establishment of brand equity is based on these individual dimensions.
Relationship Between Concecpts
As discussed previously, previous researchers believe that perceived price promotions do not significantly affect all four dimensions of brand equity. While they are significant on perceived quality and brand image, the effects of perceived price promotions on brand loyalty and brand awareness are believed to be insignificant. This, however, has never been tested in the Fast Moving Consumer Goods (FMCG) industry specifically focusing on an instant noodle brand in Indonesia as the case study. Therefore, through this study, the researcher wishes to test the preceding findings on this very same topic, conducted in circumstances different from the previous researches. The individual impacts of perceived price promotions on each brand equity dimension, including brand loyalty and brand awareness, are also examined.
This research adapts the model from Selvakumar and Vikkraman (2011) who examined the effects of perceived advertising spending and price promotions on brand equity. The model implies that (1) perceived advertising spending and price promotions simultaneously impact brand equity; (2) perceived advertising spending and price promotions individually impact brand equity; (3) perceived advertising spending and price promotions simultaneously impact the dimensions of brand equity; and (4) perceived advertising spending and price promotions individually impact the dimensions of brand equity.
RESEARCH METHOD
This study applies causal research methodology which seeks to test the relationships between two or more variables. It is based on the concept of causality where one variable is believed to cause or produce another variable. In this research, the researcher wishes to test the pre-existing hypotheses stating that perceived advertising spending and price promotions are the causes of brand equity. Hence, overall brand equity and its four dimensions come as the dependent variables in this research that is affected by the other two independent variables—perceived advertising spending and price promotions.
The researcher collects primary data using printed and online questionnaire survey. The questionnaire is distributed to 105 respondents in Surabaya who are 18-year-old and
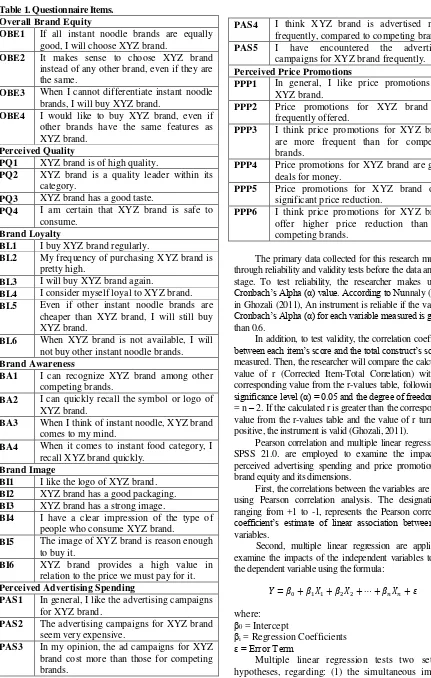
above, chosen based on simple random sampling method. It is designed to measure consumer perception regarding the three main concepts (perceived advertising spending, perceived price promotions, and brand equity). Hence, 35 items of 5-point Likert-type scales are prepared as indicators that represent seven variables (perceived advertising spending, perceived price promotions, overall brand equity, perceived quality, brand loyalty, brand awareness, and brand image). All questionnaire items are put in table 1.
To measure overall brand equity, the researcher refers to questionnaire items by Yoo et al. (2000) and Villarejo and Sánchez (2005).
The researcher examines consumers’ overall opinion of the instant noodle quality and more specifically, the intrinsic attributes of it, i.e. taste and food safety in order to measure perceived quality. The measurement scale is developed with reference to Dodds et al. (1991), Lassar et al. (1995) and Yoo et al. (2000).
The measurement scale of brand loyalty is developed by evaluating consumers’ repetitive purchase of the brand and their consistency in buying it despite many situations that may cause them to switch to other brands. Valuable researches are the bases for these indicators, such as Beatty and Kahle (1988) and Yoo et al. (2000).
Brand awareness is measured by evaluating whether consumers can recognize the brand among other brands and whether the brand comes to mind quickly with exposure to certain cues. Questionnaire items are developed with reference to Yoo et al. (2000) and Villarejo and Sánchez (2005).
Tangible and intangible attributes associated with the brand are examined to represent brand image. In developing the questionnaire items, the researcher refers to earlier researches by Lassar et al. (1995) and Yoo et al. (2000).
Referring to Kirmani and Wright (1989), Yoo et al. (2000), and Villarejo and Sánchez (2005), perceived advertising spending is measured by asking consumers directly whether they think the advertising campaign for the brand is expensive and frequently seen. Other items also measure the respondents’ general evaluation of the advertising (e.g., whether they like the advertising campaign), which implies their evaluation of the overall advertising spending.
111 Table 1. Questionnaire Items.
Overall Brand Equity
OBE1 If all instant noodle brands are equally good, I will choose XYZ brand.
OBE2 It makes sense to choose XYZ brand instead of any other brand, even if they are the same.
OBE3 When I cannot differentiate instant noodle brands, I will buy XYZ brand.
OBE4 I would like to buy XYZ brand, even if other brands have the same features as XYZ brand.
Perceived Quality
PQ1 XYZ brand is of high quality.
PQ2 XYZ brand is a quality leader within its category.
PQ3 XYZ brand has a good taste.
PQ4 I am certain that XYZ brand is safe to consume.
Brand Loyalty
BL1 I buy XYZ brand regularly.
BL2 My frequency of purchasing XYZ brand is pretty high.
BL3 I will buy XYZ brand again.
BL4 I consider myself loyal to XYZ brand. BL5 Even if other instant noodle brands are
cheaper than XYZ brand, I will still buy XYZ brand.
BL6 When XYZ brand is not available, I will not buy other instant noodle brands. Brand Awareness
BA1 I can recognize XYZ brand among other competing brands.
BA2 I can quickly recall the symbol or logo of XYZ brand.
BA3 When I think of instant noodle, XYZ brand comes to my mind.
BA4 When it comes to instant food category, I recall XYZ brand quickly.
Brand Image
BI1 I like the logo of XYZ brand. BI2 XYZ brand has a good packaging. BI3 XYZ brand has a strong image.
BI4 I have a clear impression of the type of people who consume XYZ brand.
BI5 The image of XYZ brand is reason enough to buy it.
BI6 XYZ brand provides a high value in relation to the price we must pay for it. Perceived Advertising Spending
PAS1 In general, I like the advertising campaigns for XYZ brand.
PAS2 The advertising campaigns for XYZ brand seem very expensive.
PAS3 In my opinion, the ad campaigns for XYZ brand cost more than those for competing brands.
PAS4 I think XYZ brand is advertised more frequently, compared to competing brands. PAS5 I have encountered the advertising
campaigns for XYZ brand frequently. Perceived Price Promotions
PPP1 In general, I like price promotions for XYZ brand.
PPP2 Price promotions for XYZ brand are frequently offered.
PPP3 I think price promotions for XYZ brand are more frequent than for competing brands.
PPP4 Price promotions for XYZ brand are good deals for money.
PPP5 Price promotions for XYZ brand offer significant price reduction.
PPP6 I think price promotions for XYZ brand offer higher price reduction than for competing brands.
The primary data collected for this research must go through reliability and validity tests before the data analysis stage. To test reliability, the researcher makes use of Cronbach’s Alpha (α) value. According to Nunnaly (1967) in Ghozali (2011), An instrument is reliable if the value of Cronbach’s Alpha (α) for each variable measured is greater than 0.6.
In addition, to test validity, the correlation coefficient between each item’s score and the total construct’s score is measured. Then, the researcher will compare the calculated value of r (Corrected Item-Total Correlation) with the corresponding value from the r-values table, following the significance level (α) = 0.05 and the degree of freedom (df) = n – 2. If the calculated r is greater than the corresponding value from the r-values table and the value of r turns out positive, the instrument is valid (Ghozali, 2011).
Pearson correlation and multiple linear regression in SPSS 21.0. are employed to examine the impacts of perceived advertising spending and price promotions on brand equity and its dimensions.
First, the correlations between the variables are tested using Pearson correlation analysis. The designation r, ranging from +1 to -1, represents the Pearson correlation coefficient’s estimate of linear association between two variables.
Second, multiple linear regression are applied to examine the impacts of the independent variables toward the dependent variable using the formula:
= � + � + � + ⋯ + �� �+ �
where: β0 = Intercept
βi = Regression Coefficients ε = Error Term
112 variable; and (2) the individual impacts of the independent variables on the dependent variable.
The appropriate statistical test is F-test, based on F-distribution with level of significance (α) = 0.05. In F-test, the decision rule states that if the test statistic is greater than the critical value, H0 can be rejected. Vice versa, if the test statistic is less than the critical value, then the researcher fails to reject H0 (Cooper and Schindler, 2011). Also, if p-value is smaller than 0.05, the null hypothesis is rejected. Otherwise, the null hypothesis fails to be rejected (Lind et al., 2010).
Next, in testing the individual impacts of the independent variables on the dependent variable. The appropriate statistical test here is t-test based on t -distribution with level of significance (α) similar to the F-test, 5% (α = 0.05). The decision rule states that the null hypothesis (H0) can be rejected if the test statistic is greater than the upper critical value or smaller than the lower critical value. Conversely, if the test statistic lies between the upper and the lower critical value, then the researcher fails to reject H0 questionnaire items which shows favorable result as most of the variables have Cronbach’s Alpha higher than 0.6. Only perceived advertising spending shows Cronbach’s Alpha of 0.565, which is lower than 0.6. Given this finding, the researcher manages to see the value of “Cronbach’s Alpha if Item Deleted”, next to each questionnaire item. The values shown in this column are the possible values of Cronbach’s Alpha if one of the questionnaire item is removed from analysis. Since the value of Cronbach’s Alpha for perceived advertising spending may increase to 0.618 if item PAS2 is removed, the researcher decides to do so. That leaves four items under the perceived advertising spending variable, namely PAS1, PAS3, PAS4, and PAS5. Table 2. Result of Reliability Test.
Variable Cronbach’s
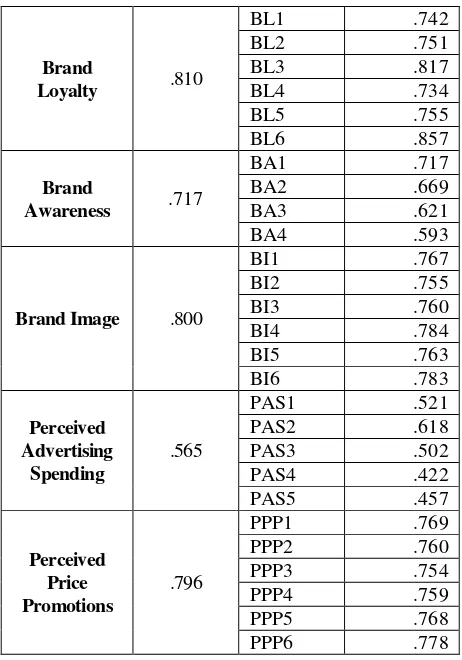
The result of validity test for all questionnaire items is shown in table 3. The judgment of the item’s validity is obtained by comparing the computed corrected item-total correlation coefficient (r) with the corresponding value from the r-values table, 0.1918, following the significance level (α) = 5% and the degree of freedom (df) = 105 – 2 = 103. It is shown that all items in the questionnaire are valid since all the calculated values of r are positive and higher than 0.1918.
Table 3. Result of Validity Test.
Variable Item Corrected
113 Brand
Awareness
BA1 .392
BA2 .491
BA3 .563
BA4 .600
Brand Image
BI1 .563
BI2 .615
BI3 .597
BI4 .505
BI5 .580
BI6 .487
Perceived Advertising Spending
PAS1 .276
PAS3 .306
PAS4 .524
PAS5 .521
Perceived Price Promotions
PPP1 .534
PPP2 .570
PPP3 .596
PPP4 .584
PPP5 .537
PPP6 .491
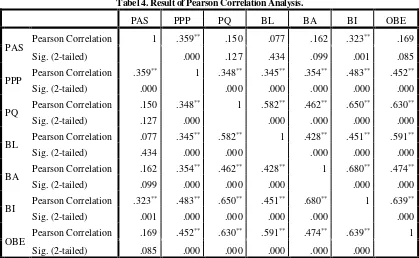
The result of the Pearson correlation analysis between all the variables is depicted in table 4.
The Pearson correlation test shows some intriguing result. All the correlation coefficients are showing positive values. This means there are positive linear associations among the variables.
However, not all correlations are significant, as reflected by the p-value that is higher than 0.01 on the “Sig. (2-tailed)” designated row. Among the significant correlations, the strongest is the relationship between brand awareness (BA) and brand image (BI) with r = 0.680.
As shown in table 5, when standing together as independent variables, perceived advertising spending and price promotions simultaneously have significant impacts toward brand equity and all its four dimensions, shown by the p-values (column F-Sig) that are less than 0.05 suggesting that all regression models are significant. However, when tested individually with t-test, perceived advertising spending does not have any significant impact toward brand equity or any of its dimensions since all the p -values (column t-Sig) for perceived advertising spending are greater than 0.05.
Conversely, perceived price promotions always show up as an important predictor of brand equity and all its dimensions, displayed by its significant yet positive regression coefficients in all five regression equations. This suggests that in the case of this instant noodle brand, perceived price promotions actually hold a crucial role in defining brand equity, while perceived advertising spending has nothing to do with it.
The result of the data analysis has showed some surprising findings. Compared to the previous literature, the researcher finds at least three major differences. First, the insignificance of perceived advertising spending on brand equity and its dimensions. Selvakumar and Vikkraman (2011) discovered that perceived advertising spending has significant positive effects upon perceived quality, brand
loyalty, brand awareness, and brand associations. Similarly, Villarejo and Sánchez (2005) pointed out the significant effects of advertising on perceived quality, brand awareness and brand image. Yoo et al. (2000) also found that higher advertising spending could develop not only higher brand equity but also perceived quality, brand loyalty, brand awareness, and brand associations.
However, it is important to note that none of these researches were conducted in Fast-Moving Consumer Goods (FMCG) industry, especially the instant food category. Instead, they were conducted across service, electronics, and other luxury goods industries. Since purchasing the goods or services in these industries are usually costly, it makes much sense that consumers rely heavily on the advertisements as the basis that shapes their perception of the brand equity. On the other hand, instant noodle products are relatively cheap and thanks to the crowding convenient stores, they are conveniently available at all times, too. This has led the consumers to rely more on their direct consumption experience of the product to shape their brand equity perception.
As suggested by Gupta (2009) and Pradeepa and Kavitha (2013), price, taste, and overall quality are among the top factors that drive consumer behavior in purchasing food products. Hence, the researcher believes that intrinsic factors of the product itself are the most reliable predictors of brand equity and all its dimensions. Consumers’ perception of the product quality, their brand loyalty decision, and the images associated with the brand are formed by the judgment consumers make regarding these intrinsic factors after consuming the instant noodle products. To the researcher’s surprise, consumers’ awareness of the brand is not significantly shaped by perceived advertising spending. Pradeepa and Kavitha (2013) found out that most consumers shape their awareness of instant food products either through direct encounter at stores or Word-of-Mouth (WOM), leaving only a minority that obtain information about instant food products from advertisements.
114
Tabel 4. Result of Pearson Correlation Analysis.
PAS PPP PQ BL BA BI OBE
PAS Pearson Correlation 1 .359
** .150 .077 .162 .323** .169
Sig. (2-tailed) .000 .127 .434 .099 .001 .085
PPP Pearson Correlation .359
** 1 .348** .345** .354** .483** .452**
Sig. (2-tailed) .000 .000 .000 .000 .000 .000
PQ Pearson Correlation .150 .348
** 1 .582** .462** .650** .630**
Sig. (2-tailed) .127 .000 .000 .000 .000 .000
BL Pearson Correlation .077 .345
** .582** 1 .428** .451** .591**
Sig. (2-tailed) .434 .000 .000 .000 .000 .000
BA Pearson Correlation .162 .354
** .462** .428** 1 .680** .474**
Sig. (2-tailed) .099 .000 .000 .000 .000 .000
BI Pearson Correlation .323
** .483** .650** .451** .680** 1 .639**
Sig. (2-tailed) .001 .000 .000 .000 .000 .000
OBE Pearson Correlation .169 .452
** .630** .591** .474** .639** 1
Sig. (2-tailed) .085 .000 .000 .000 .000 .000
**. Correlation is significant at the 0.01 level (2-tailed).
Table 5. Multiple Linear Regression Results.
No. Equation F-Sig t-Sig
1. OBE = 1.449 + 0.009PAS + 0.543PPP +ε .000 PAS = .939 PPP = .000 2. PQ = 2.101 + 0.031PAS + 0.355PPP +ε .001 PAS = .776 PPP = .001 3. BL = 1.586 - 0.068PAS + 0.448PPP +ε .001 PAS = .591 PPP = .000 4. BA = 1.836 + 0.051PAS + 0.419PPP +ε .001 PAS = .689 PPP = .001 5. BI = 1.309 + 0.177PAS + 0.421PPP +ε .000 PAS = .063 PPP = .000 Dodson et al. (1978) and Yoo et al. (2000)
believed that price promotions only cause a temporary brand-switching behavior because consumers’ purchases are based on the benefits of the temporary price promotions, hence no brand loyalty can ever be achieved. The researcher observes that most consumers are mixed up with the term ‘price promotions’ and ‘price’. Most of them view price promotions and current price of the brand as the same thing. Consumers are not to blame in this case. The producer of the instant noodle brand generally sticks to this kind of pricing strategy. Every new product launch is always marketed with certain price promotion programs (e.g., special introductory price, buy 2 get 1, etc.). However, the special price period has no limit and that price finally becomes the permanent price.
Third, this research also finds a rather unique finding since the impacts of perceived price promotions toward brand equity and its dimensions are not negative, but
all positive. This finding can be seen as completely the opposite of the previous theories found in the body of literature. However, it is interesting to recall that Selvakumar and Vikkraman (2011) actually discovered positive impacts of perceived price promotions on brand awareness and brand image, whereas Villarejo and Sánchez (2005) found that higher perceived price promotions lead to higher perceived quality.
Moreover, these positive signs of the PPP variable in the regression equations indicate that perceived price promotions do not erode brand equity. Instead, they enhance brand equity. This finding should not be a surprise since the object of this research is a daily need product, purchased on a daily basis. Hence, price does matter and price promotions can effectively increase the brand value in consumers’ mind.
115 damage them by implanting some ‘cheap’ brand-related associations. However, this is not the case since this research is conducted over the population of Surabaya people who are price sensitive. This was supported by a report by Euromonitor International in 2007, which stated that generally consumers in Indonesia are highly price sensitive. Also, we are talking about Fast Moving Consumer Goods (FMCG), where price promotions and price competition are common trend. It is not a necessity that a cheaper product will be perceived of lower quality or image.
CONCLUSION
The statements of research problem consist of four questions regarding the simultaneous and the individual effects of perceived advertising spending and price promotions toward brand equity. It can be concluded that perceived price promotions have significant positive effects on brand equity along with all its dimensions (perceived quality, brand loyalty, brand awareness, brand image). Instead of damaging it, price promotions enhance brand equity. Perceived advertising spending, on the other hand, turns out to have no significant effect toward the development of the brand equity of the observed instant noodle brand.
There are some limitations of this research. First, this research only focuses on one Indonesian instant noodle brand as the research object. Therefore, more brands need to be included in the future research so the researcher will be able to contrast the different effects of perceived advertising spending and price promotion on brand equity of different brands and generalize the findings on the instant noodle product category in Indonesia.
Second, the research object is from one product category within one industry. Adding product categories as the research objects can help the readers to comprehend the ways in which the effects of perceived advertising spending and price promotion on brand equity of these product categories differ, as suggested by Selvakumar and Vikkraman (2011). Third, this research is conducted only within Surabaya with consumers that live in Surabaya as the sample. The sample for further research can be taken from consumers not only in Surabaya, but also other big cities in Indonesia in order to give a more complete picture of Indonesian consumer behavior, which will increase the value and the relevance of the research.
Fourth, this research only focuses on perceived advertising spending and price promotion as the independent variables and put aside other marketing communication tools. Other marketing efforts, like in-store displays, Word-of-Mouth (WOM), social media, and distribution strength need to be studied as well, if the research is focused on listing and contrasting as many factors that shape brand equity. Last but not least, the researcher suggests that further research on the same topic can make use of actual measures of advertising spending and price promotion (using monetary values) to examine their impacts on brand equity.
REFERENCES
Aaker, D.A. (1991). Managing Brand Equity. New York: Free Press.
Aaker, D.A. (1996). Measuring Brand Equity Across Products and Markets. California Management Review, 38, 102-120.
Aaker, D.A. & Jacobson, R. (1994). The financial information content of perceived quality. Journal of Marketing Research, 31, 191–201.
Agrawal, D. (1996). Effect of brand loyalty on advertising and trade promotions: a game theoretic analysis with empirical evidence. Marketing Science, 15(1), 86-108.
Alba, J.W. & Hutchinson, J.W. (1987). Dimensions of Consumer Expertise. Journal of Consumer Research, 13, 411- 454.
Allender, W.J. & Richards, T.J. (2012). Brand Loyalty and Price Promotion Strategies: An Empirical Analysis. Journal of Retailing, 88(3), 323-342.
Anderson, E.W. & Sullivan, M.W. (1993). The antecedents and consequences of customer satisfaction for firms. Marketing Science,2(2), 125-143.
Beatty, S.E. & Kahle, L.R. (1988). Alternative Hierarchies of the Attitude-Behavior Relationship: The Impact of Brand Commitment and Habit. Journal of Academic Marketing Science, 16, 1-10.
Bennett, P.D. (1995). Dictionary of Marketing Terms. Chicago: American Marketing Association. Bharadwaj, S.G., Varadarajan, P.R., & Fahy, J. (1993).
Sustainable Competitive Advantage in Service Industries: A Conceptual Model and Research Propositions. Journal of Marketing, 57, 83-99. Blattberg, R.C., Briesch, R., & Fox, E.J. (1995). How
Promotions Work. Marketing Science, 14(3), 122-132.
Boddewyn, J.J. & Leardi, M. (1989). Sales Promotions: Practice, Regulation and Self Regulation Around The World. International Journal of Advertising, 8(4), 363.
Boulding, W., Lee, E., & Staelin, R. (1994). Mastering the Mix: Do Advertising, Promotion, and Salesforce Activities Lead to Differentiation? Journal of Marketing Research, 31, 159-172.
Chay, R. & Tellis, G. (1991). Role of Communication and Service in Building and Maintaining Brand Equity. In Eliot Maltz (Ed.), Managing Brand Equity, 91-110 (pp. 26-27). Cambridge, MA: Marketing Science Institute.
Chen, C. (2001). Using free association to examine the relationship between the characteristics brand associations and brand loyalty. Journal of Product & Brand Management, 10(7), 439-451.
Cobb-Walgren, C.J., Ruble, C.A., & Donthu, N. (1995). Brand equity, brand preferences, and purchase intent. Journal of Advertising, 24(3), 25-40. Cooper, D.R. & Schindler, P.S. (2011). Business Research
Methods. New York: McGraw-Hill/Irwin.
116 Dick, A.S. & Basu, K. (1994). Customer loyalty: toward on
integrated conceptual framework. Journal of the Academy of Marketing Science, 22(2), 99-113. Dodds, W.B., Monroe, K.B., & Grewal, D. (1991). Effects
of Price, Brand, and Store Information on Buyers’ Product Evaluation. Journal of Marketing Research, 28, 307-319.
Dodson, J.A., Tybout, A.M., & Sternthal, B. (1978). Impact of Deals and Deal Retraction on Brand Switching. Journal of Marketing Research, 15, 72-81.
Farquhar, P.H. (1989). Managing brand equity. Marketing Research Vol. 1, 24-33.
Ghozali, I. (2011). Aplikasi Analisis Multivariate dengan Program SPSS. Semarang: BP Universitas Diponegoro.
Gupta, S. (1988). Impact of Sales Promotions on When, What, and How Much to Buy. Journal of Marketing Research, 25, 342-355.
Gupta, K.B. (2009). Consumer Behaviour for Food Products in India. Paper presented at 19th Annual World Symposium held by International Food and Agribusiness Management Association, Budapest, Hungary.
Ha, H.Y., John, J., Janda, S., & Muthaly, S. (2011). The effect of advertising spending on brand loyalty in services. European Journal of Marketing, 45(4), 673-691.
Hameed, F. (2013). The Effect of Advertising Spending on Brand Loyalty Mediated by Store Image, Perceived Quality and Customer Satisfaction: A Case of Hypermarkets. Asian Journal of Business Management, 5, 181-192.
Hankinson, G. & Cowking, P. (1996). The Reality of Global Brands: Cases and Strategies for Successful Management of International Brands. Maidenhead: McGraw-Hill.
Hauser, J.R. & Wernerfelt, B. (1990). An evaluation cost model of consideration sets. Journal of Consumer Research, 16, 393–408.
Hoyer, W. D. & Brown, S.P. (1990). Effects of brand awareness on choice for a common, repeat-purchase product. Journal of Consumer Research, 17, 141– 148.
Jedidi, K., Mela, C., & Gupta, S. (1999). Managing Advertising and Promotion for Long-Run Profitability. Marketing Science, 18(1), 1-22. Keller, K.L. (1993). Conceptualizing, Measuring, and
Managing Customer-Based Brand Equity. Journal of Marketing,57, 1-22.
Keller, K. L., Heckler, S. E. & Houston, M. J. (1998). The effects of brand name suggestiveness on advertising recall, Journal of Marketing, 62, 48–57.
Keller, K.L. (2012). Strategic Brand Management: Building, Measuring, and Managing Brand Equity. Upper Saddle River, NJ: Prentice Hall.
Kirmani, A. & Wright, P. (1989). Money talks: Perceived advertising expense and expected product quality. Journal of Consumer Research, 16, 344–353. Lassar, W., Mittal, B., & Sharma, A. (1995). Measuring
Customer-Based Brand Equity. Journal of Consumer Marketing, 12(4), 11-19.
Leuthesser, L. (1988). Defining, measuring and managing brand equity. A Conference Summary. Cambridge, MA: Marketing Science Institute.
Lind, D.A., Marchal, W.G., & Wathen, S.A. (2010). Statistical Techniques in Business and Economics (14th ed.). New York: McGraw-Hill/Irwin. Maxwell, H. (1989). Serious Betting on Strong Brands.
Journal of Advertising Research, 29, 11-13. Moorthy, S. & Zhao, H. (2000). Advertising spending and
perceived quality. Marketing Letters, 11(3), 221-33. Oliver, R.L. (1999), Whence consumer loyalty? Journal of
Marketing, 63(4), 33-44.
Olsen, S.O. (2002). Comparative evaluation and the relationship between quality, satisfaction, and repurchase loyalty. Journal of the Academy of Marketing Science, 30(3), 240-249.
Pradeepa, V. & Kavitha, G. (2013). A Study on Consumer Behaviour towards Ready-to-Eat Food Products in Coimbatore City. Journal of Commerce and Management Thought, 4(3), 599-611.
Rahmani, Z., Mojaveri, H.S., & Allahbakhsh, A. (2012). Journal of Business Studies Quarterly, 4(1), 64-73. Schneider, C. (1990). Communication. Nouvelle Fonction
Strat́gique de L'enterprise. Paŕs: J. Delmas et Cie. Selvakumar, J.J. & Vikkraman, P. (2011). Impact of
Advertising and Price Promotions on Brand Equity in Service Sector. Journal of Contemporary Research in Management, 51-65.
Shimp, T.A. (1997). Advertising, Promotion, and Supplemental Aspects of Integrated Marketing Communications (4th ed). Orlando, FL: Dryden. Shocker, A.D. & Weitz, B. (1988). A Perspective on Brand
Equity Principles and Issues. In Lance Leuthesser (Ed.), Defining, Measuring, and Managing Brand Equity, 88-104 (pp. 2-4). Cambridge, MA: Marketing Science Institute.
Simon, C.J. & Sullivan, M.W. (1993). The Measurement and Determinants of Brand Equity: A Financial Approach. Marketing Science,12, 28-52.
Villarejo, A.F. & Sánchez, M.J. (2005). The impact of marketing communication and price promotion on brand equity. Henry Stewart Publications 1350-231x Brand Management, 12(6), 431-444.
Winer, R.S. (1986). A Reference Price Model of Brand Choice for Frequently Purchased Products. Journal of Consumer Research,13, 250-256.
Wood, L. (2000). Brands and brand equity: definition and management. Management Decision, 38(9), 662-669.
Yoo, B., Donthu, N., & Lee, S. (2000). An Examination of Selected Marketing Mix Elements and Brand Equity. Journal of the Academy of Marketing Science,28(2), 195-211.