29
The Impact of Perceived Price towards Perceived Value Through the
Mediation of Perceived Quality: A Case of Brand X Smartphone in
Indonesian Middle-Class Customers
Ikaningrum Shintaputri, Amelinda Jane Wuisan
International Business Management Program, Petra Christian University Jl. Siwalankerto 121-131, Surabaya
E-mail: [email protected], [email protected]
ABSTRACT
To grab the opportunity in the smartphone industry, companies can increase customer’s perceived value by increasing its product’s benefits (quality) or reducing its product’s costs (price). Scholars argue that reducing perceived price could increase perceived value but also reduce perceived quality. This is because perceived quality may mediate the relationship between perceived price and perceived value. Therefore, this research’s objective is to understand the mediation effect in perceived price and perceived value relationship in smartphone industry.
This research has collected the data from 70 respondents in Indonesia. The data has passed validity & reliability test and processed using multiple regression analysis with Sobel test. The result of this research finds an insignificant relationship between perceive price and perceived value and a significant relationship between perceived price and perceived quality. Thus, there is no mediation of perceived quality in the relationship between perceived price and perceived value. Furthermore, this research finds a significant relationship between perceived quality and perceived value.
Keywords: Perceived price, perceived quality, perceived value, smartphone industry
ABSTRAK
Untuk menangkap potensi di industri smartphone, para perusahaan dapat meningkatkan persepsi nilai pelanggan dengan meningkatkan manfaat produk (kualitas) atau menurunkan biaya produk (harga). Para ahli berpendapat bahwa menurunkan persepsi harga dapat meningkatkan persepsi nilai, tapi menurunkan persepsi kualitas. Hal ini disebabkan oleh persepsi kualitas yang mungkin memediasi hubungan persepsi harga dan persepsi nilai. Maka dari itu, penelitian ini bertujuan untuk mempelajari apakah ada efek mediasi persepsi kualitas pada hubungan antara persepsi harga dan persepsi nilai di industri smartphone.
Penelitian ini telah mengumpulkan data dari 70 responden di Indonesia. Seluruh data telah lulus tes validitas & realibilitas dan diolah menggunakan analisa regresi linier majemuk dengan tes Sobel. Hasil penelitian ini menemukan adanya hubungan yang tidak signifikan antara persepsi harga dan persepsi nilai serta hubungan yang signifikan antara persepsi harga dan persepsi kualitas. Maka dari itu, dapat dikatakan bahwa tidak ada mediasi persepsi kualitas pada hubungan persepsi harga dan persepsi nilai. Selain itu, penelitian ini menemukan adanya hubungan yang signifikan antara persepsi kualitas dan persepsi nilai.
Kata Kunci: Persepsi harga, persepsi kualitas, persepsi nilai, industri smartphone.
INTRODUCTION
Today’s highly competitive business environment is characterized by market’s unpredictability, heightened competitive pressure, and diminishing product differentiation (Leahy, 2008). In Indonesia, the smartphone industry is also well
30 increase from 55 million in 2015 to 92 million in 2019, and they will come from the middle-class income in urban areas (Indonesia Investment, 2016). According to Boston Consulting Group (2013), the number of middle-class consumers in Indonesia will also grow to roughly 141 million people by 2020. The middle-class consumers have a specific behavior. They are very value conscious and enjoy hunting for bargains (Boston Consulting Group, 2013). Thus, price and value are important in the mind of the middle-class customers.
Companies can increase customer’s perceived value by enhancing the benefits for the customer or reduce the sacrifices made by them (Ravald & Grönroos, 1996). The perceived benefits are related to the available product attribute’s quality at the time of use while the perceived sacrifice is related to the prices that customers need to make in order to obtain the product (Ravald & Grönroos, 1996).
However, according to Scitovszky (1944),the role of lower price to perceived value is paradoxical. When a product is offered at a low price, it will become less attractive because it is assumed to be having a lower quality. People use price as an indicator of quality because they cannot know the product’s quality immediately such as the lasting year of the machine (Monroe, 1973). At the same time, the offer will become more attractive as it is offered at a cheaper price/cost.
Monroe and Khrishnan (1985) suggest that perceived quality influence the relationship between price and perceived value (in Beneke, Flynn, Greig, & Mukaiwa, 2013). Empirical studies show that perceived price could have a positive influence on the perceived value if mediated with perceived quality (Beneke, Flynn, Greig, & Mukaiwa, 2013; Buditama & Aksari, 2017). Thus, this suggests a mediation linkage between perceived price and perceived value (Dodds & Monroe, 1985; Dodds, Monroe, & Grewal, 1991; Zeithaml, 1988).
The use of price as quality inferences actually varies across different product categories. Riesz (1979) finds that different with non-durable goods, the durable goods show a positive correlation between price and quality. Positive linkages are founded more in durables good, in which smartphone is included in it as it lasts over the years with several times uses (Kotler, 2012).
Because of the dilemmatic pricing strategy in order to create customer’s perceived value, whether higher price will increase customer’s perceived quality or decrease customer’s perceived value, managers in the smartphone industry must be careful in managing customer’s perceived price.
To solve the problem, we need to know whether the customers are more influenced by perceived price or perceived quality in evaluating the perceived value
of the smartphone. As the biggest market share in smartphone industry (Indonesia Investment, 2016), Brand X successfully manage to deliver the right strategy in capturing the perceived value. Therefore, this research will investigate how Brand X customers perceived the value of Brand X smartphone. Then, Brand X and other companies can know what influenced the perceived value, which will help them to focus on that area.
LITERATURE REVIEW
Perceived Price
Perceived price can be defined as customer’s subjective perception of what is given up or sacrificed to acquire the product (Zeithaml, 1988). According to Zeithaml (1988), customers do not always remember or know the actual price of a product, but rather they subjectively encode the prices as “expensive” or “cheap”. Thus, it suggests that customer’s perception of price may be different from the objective price.
Classic economic definition of price paid to obtain a product is often limited to the monetary units only (Korda & Snoj, 2007; Agarwal & Teas, 2001; Oh, 1999). However, this concept of price is too simplistic because customer’s overall assessment of what is sacrificed can be influenced by many other factors (Korda & Snoj, 2007). Thus, investigating the other factors causing the customer to sacrifice something in acquiring the product is important.
Scholars argue that the sacrifice made by customers is not only the nominal monetary price, but also include all other non-monetary costs made during product acquisition and its use (Zeithaml, 1988; Snoj, Pisnik, & Mumel, 2004). The non-monetary sacrifices include search time cost, physical effort or energy, and learning cost (Zeithaml, 1988; Rivière, 2014). When customers cannot find the product on the shelf, travel to get the product, make and effort to assemble durable products, and spend a time to prepare packaged good, sacrifices have been made. Non-monetary sacrifices are very important as they increase the subjective evaluation in the perception of price (Zeithaml, 1988). Non-monetary sacrifices may play a more important role than the monetary sacrifice (Wang, Lo, Chi, & Yang, 2004). Thus, this research will also include the non-monetary aspect of sacrifice in investigating perceived price.
Perceived Quality
31 Moreover, quality can be measured in terms of avoidable and unavoidable cost (Morgan & Murgatroyd, 1994). Avoidable costs are the costs that can be avoided, such as products defects, scrap, and returned goods. Investment in quality improvement can eliminate avoidable costs and they are called as the unavoidable costs. Unavoidable costs are the costs that must be expensed in order to lower the avoidable costs, such as inspection cost, maintenance cost, and sampling cost. The smaller the avoidable cost and the bigger the unavoidable cost, the better the product’s quality is. In conclusion, the earlier definition of product’s quality is based on the company’s perspective.
However, this definition of quality continues to adapt to the current situation. The notion that quality means the conformance of standards, high avoidable cost, and low unavoidable cost is not enough anymore. Instead, companies must alter their focus from the firm-driven objective quality measurement to the market-driven definition of quality (Main, 1994). According to Gilmore (1974, p.16), quality is now defined as “the degree to which a specific product satisfies the wants of a specific consumer" (in Garvin, 1984). Similarly, Garvin (1987) argues that firms and businesses should focus on the quality based on customer’s perspective. Companies must learn to understand and evaluate how customers perceive quality. The reason for maintaining customer’s perceived quality more than the quality itself is because sometimes customers evaluate the product’s attributes subjectively rather than objectively evaluate the complete information of the products (Lambert, 1980; Cox, 1967). Nowadays, customers do not only depend on the firm-driven objective measurement of quality. Kuehn & Day (1962, p. 101) argue, "in the final analysis of the marketplace, the quality of a product depends on how well it fits patterns of consumer preferences." Furthermore, scholars suggest that perceived quality is more important than the objective quality itself in purchasing decision (Takeuchi & Quelch, 1983; Somma, 2014). Thus, in this research, the quality of the product will be investigated from customer’s perspective.
Perceived quality can be defined as “consumer’s judgment about a product’s overall excellence or superiority” (Zeithaml, 1988, p. 3). Perceived quality is clearly subjective and different from the objective quality. It is a more abstract concept compared to the specific attribute of the product. Therefore, this study focuses on examining customer’s perception of quality, which is defined as a customer’s subjective degree of excellence.
Cue Utilization theory suggests that a product consists of a set of cues that serve as indicators of quality to customers (Olson & Jacoby, 1972; Jacoby,
Olson, & Haddock, 1971). The attributes that signal quality are categorized into extrinsic and intrinsic attributes. Extrinsic attributes are related to the attributes that are outside of the product and can be generalized across brands, products, and categories such as price and brand name (Zeithaml, 1988). According to Zeithaml (1988), when customers want to purchase a product and the intrinsic cues cannot be readily evaluated, they will rely on the extrinsic cues such as price and brand name for the substitute. In this research, the researchers included the role of extrinsic cues in determining the perceived quality such as price in the independent variable. The brand name as an extrinsic cue has also been determined, which is Brand X.
Intrinsic attributes are the physical components of the product that cannot be changed without changing the product’s nature. The attributes are product specific according to the product’s category. Since smartphone is categorized as a durable good, the dimensions of quality will be using durable goods quality dimensions. Brucks, Zeithaml, & Naylor (2000) and Garvin (1987) propose the quality dimensions of durable goods. This research will adapt the construct from Brucks, Zeithaml, & Naylor (2000) rather than Garvin (1987) because of four reasons. First, compared to the construct proposed by Garvin (1987), the construct by Brucks, Zeithaml, & Naylor (2000) includes the ease of use dimension because the complexity of durable products has increased in recent years. Second, Brucks, Zeithaml, & Naylor (2000) does not include the conformance dimension in Garvin (1987) because it is a manager-oriented measure of objective quality and does not measure customer’s perceived value. Third, the reliability dimension in Garvin (1987) is included in performance dimension of Brucks, Zeithaml, & Naylor (2000) because performance cannot be evaluated independently from reliability. Finally, Brucks, Zeithaml, & Naylor (2000) include the symbolic meaning of product’s ownership by the prestige dimension, while the dimension of perceived image and aesthetics in Garvin (1987) does not include the symbolic meaning of product’s ownership. In conclusion, the measure by Brucks, Zeithaml, & Naylor (2000) is more comprehensive and appropriate for this research.
32 (Brucks, Zeithaml, & Naylor, 2000). Credence properties are the properties that are even impossible to be evaluated even after usage (Brucks, Zeithaml, & Naylor, 2000). According to Brucks, Zeithaml, & Naylor (2000), people will rely more on the marketing signal (price and brand) when the quality dimensions are harder to be evaluated. It is different with the dimensions in the search properties. People can directly justify whether the product is easy to use and the versatility of the product even before buying the product. Since the purpose of this research is to investigate the role of perceived price in determining customer’s perceived quality, this research will not use the ease of use and versatility dimension. Thus, the dimensions used to investigate the perceived quality are durability, serviceability, performance, and prestige.
Perceived Value
Zeithaml (1988, p. 14) defines perceived value as “consumer’s overall assessment of the utility of a product based on perceptions of what is received and what is given”. Zeithaml (1988) explains that perceived value is personal and individualistic. Although what is given (e.g. volume, quality, convenience) and received (e.g. money spent, time, effort) varies among customers, the most common definition of value is generally the trade-off between quality and price (Cravens, Holland, Lamb Jr., & Moncrief III, 1988; Dodds, Monroe, & Grewal, 1991; Monroe & Chapman, 1987). Scholars agree that perceived value is the trade-off between ”give” and “get” components (Ravald & Grönroos, 1996; Dodds & Monroe, 1985). Furthermore, scholars suggest that perceived value is the difference between perceived benefits and perceived sacrifice (Mazumdar, 1993; Cheng, Cripps, & Chen, 2006). Perceived value is the net benefit received in exchange of the cost sacrificed in obtaining the desired benefits (Chen & Dubinsky, 2003; Tam J. L., 2004). Thus, in this research, the give element consists of the benefits provided by the seller in exchange for customer’s monetary and non-monetary cost.
Literatures poorly differentiate perceived value with perceived price and perceived quality and they seem to be overlapping with each other (Sánchez-Fernández & Iniesta-Bonillo, 2007; Day & Crask, 2000; Zeithaml, 1988; Dodds, Monroe, & Grewal, 1991). However, these concepts are actually distinct with each other.
Perceived price is distinct with perceived value. Perceived value is the net difference between perceived benefit and perceived sacrifice (Chen & Dubinsky , 2003; Tam J. L., 2004). In order to obtain a product or the benefit of the product, one must give something or sacrifice something as an exchange of the benefit.
Perceived price is only one of the factors in determining the perceived value (Zeithaml, 1988; Beneke, Flynn, Greig, & Mukaiwa, 2013). Perceived price is the sacrifice that one must give in order to get the benefit. Thus, perceived price is clearly different with perceived value.
Researchers agree that quality and value are also distinct concepts (Bolton & Drew, 1991; Day & Crask, 2000; Dodds & Monroe, 1985). Researchers suggest that perceived quality is an antecedent that positively affects perceived value (Lapierre, Filiatrault, & Chebat, 1999; Cronin, Brady, & Hult, 2000). Bolton & Drew (1991) argue “value seems to be a ‘richer’, more comprehensive measure of customers’ overall evaluation of a service than service quality” (p.383). Band (1991) clearly explains the distinction between quality and value; “quality… is the means, but value for the customer is the end” (in Day & Crask, 2000). Thus, perceived quality is distinct with perceived value.
Relationship Between Perceived Price and Perceived Value
The relationship between perceived price and perceived value can be explained by Transaction Utility theory (Thaler, 1983). According to Transaction Utility theory, customer’s value is determined by the total utility of a purchase. The total utility of a purchase is composed of transaction utility and acquisition utility. Since both transaction and acquisition utilities are influenced by the price of the product, the perceived price of a product will also influence the perceived value of the product (Thaler, 1983).
The transaction utility emphasizes on the perceived price of the customers related to a product (Kim, Xu, & Gupta, 2012). It is the difference between the objective selling price and customer’s reference price (Thaler, 1983). Reference price is customer’s speculated price that is formed by the information of the brand’s prices, competitor’s price, and suggested retail price (Monroe, 1973; Diamond & Campbell, 1989). Reference price becomes the basis of price in customer’s memory in judging the actual price. When the selling price is smaller than customer’s reference price, customers perceive the value of the purchase as a positive one and consider it as a bargain. When the selling price is higher than the reference price, the value of the purchase is negative and considered as a ripped off (Thaler, 1983).
33 product or reservation price (Kim, Xu, & Gupta, 2012; Thaler, 1983). When the reservation price is bigger than the objective price, customer’s acquisition value is positive (Thaler, 1983).
Some empirical studies find negative relationship between perceived price and perceived value (Kim, Xu, & Gupta, 2012; Cheng, Cripps, & Chen, 2006; Oh, 1999; Chang & Wildt, 1994). However, inconsistent finding has been found. Wijaya, Semeul, & Japarianto (2013) find that perceived price does not significantly influence perceived value.
Relationship Between Perceived Price and Perceived Value Mediated by Perceived Quality
The Means-End theory by Gutman (1982) provides the theoretical framework that links customer’s values with their behavior. The Means-End theory suggests that customers try to achieve their personal values (end) by their behaviours (means) (Baker, Thompson, & Engelken, 2004). The theory suggests that customer’s decision-making process are influenced by three level of abstractions: (i) product attributes; (ii) perceived consequences of consumption; and (iii) customer’s personal values (Gutman, 1982; Sánchez-Fernández & Iniesta-Bonillo, 2007). Product attributes represent the observable product’s characteristics and physical features of the product. Customers evaluate the attributes subjectively and judge the product attributes such as the quality of the product (Baker, Thompson, & Engelken, 2004). Next, customers perceive the consequences of consuming the attributes that they evaluate in the beginning. Customers perceive the trade-off between the cost and benefits of consuming the attributes, which refer to customer’s perceived value (Zeithaml, 1988). In conclusion, individuals are said to be goal-directed and they use product or service attributes as a means to achieve their desired end states.
Zeithaml (1988) uses the Means-End theory to explain the relationship between perceived price, perceived quality, and perceived value. The Means-End theory offers the conceptual model that people evaluate products based on their perceptions of price, quality, and value (Zeithaml, 1988; Sánchez-Fernández & Iniesta-Bonillo, 2007).
Zeithaml (1988) explains that the variables are established according to their level of abstraction in which the lower-level attribute will determine the higher-level of the attribute. In this case, perceived price is a lower level of attribute because it is the give component of the model. Zeithaml (1988) indicates perceived quality as a higher-level attribute because it is a more complex concept, determined by perceived price, intrinsic attributes, and extrinsic attributes of the product. However, perceived value is an even higher-level concept than perceived quality because first,
value is more individualistic and personal than quality. Second, a value is the trade-off between get and give components that may include the trade-off between perceived price and perceived quality. Thus, Zeithaml (1988) suggests that perceived price will determine perceived quality, as well as perceived price and perceived quality will determine perceived value.
Now the researchers will explain the relationship between perceived price and perceived quality. As suggested previously, Cue Utilization theory suggests the relationship between the two variables. According to Cue Utilization theory, a product consists of a set of cues that serve as a basis to make impressions on the product itself (Olson & Jacoby, 1972). The relationship between perceived price and perceived quality can be explained through customer’s behaviour in using extrinsic cues such as price to judge quality (Zeithaml, 1988; Scitovszky, 1945; Dodds & Monroe, 1985; Dodds, Monroe, & Grewal, 1991; Erickson & Johansson, 1985). The word “cheap” usually described an inferior quality while the word “expensive” is equalized to superior quality (Scitovszky, 1945). Moreover, the notion that perceived price may influence perceived quality, may also be based on the theoretical rationale that higher quality can only be produced at a higher cost, which means a good product quality should have a higher price (Riesz, 1979; Teas & Agarwal , 2000). Thus, it is suggested that perceived price might positively influence perceived quality.
Empirical studies have found that perceived price positively influence perceived quality in various products and industries (e.g. food, property, PCs, TVs) (Chang & Wildt, 1994; Hansen, 2015; Verma & Gupta, 2004). However, several studies have also found an insignificant relationship between perceived price and perceived quality (Chen & Dubinsky, 2003; Oh, 1999). Thus the relationship between perceived price and perceived quality is still inconclusive.
34 as MP3 Player (Cheng, Cripps, & Chen, 2006; Chen & Dubinsky, 2003; Tam J. L., 2004; Wijaya, Semuel, & Japarianto, 2013). Thus, it is suggested that perceived quality may have a positive relationship with perceived value.
The suggested influence of perceived price to perceived quality and perceived quality to perceived value highlights the possible mediating role of perceived quality (Beneke, Flynn, Greig, & Mukaiwa, 2013). The mediating role of perceived quality is important because it suggests that even though customers have a favorable evaluation towards perceived quality, they may not have a favorable attitude towards perceived value as well because of perceived price. Empirical studies have shown that perceived price positively influence perceived value through perceived quality (Beneke, Flynn, Greig, & Mukaiwa, 2013; Buditama & Aksari, 2017; Dodds & Monroe, 1985).
H1: There is a relationship between perceived price and perceived value in Indonesian Brand X smartphone middle class customers
H2: There is a relationship between perceived price and perceived quality in Indonesian Brand X smartphone middle class customers
H3: There is a relationship between perceived quality and perceived value in Indonesian Brand X smartphone middle class customers
H4: Perceived quality mediates the relationship between perceived price and perceived value in Indonesian Brand X smartphone middle class customers
RESEARCH METHOD
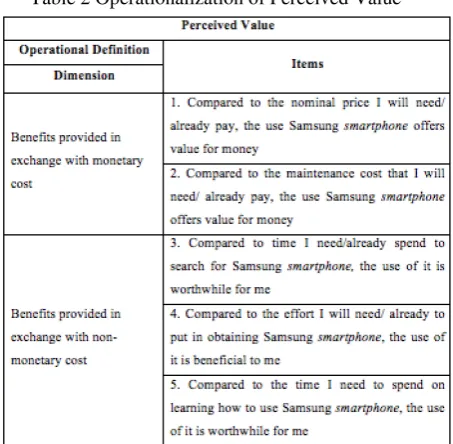
There are three variables in this research: perceived price, perceived quality, and perceived value. First, the independent variable is perceived price. Perceived price is customer’s subjective perception of what is given up or sacrificed to acquire the product (Zeithaml, 1988). The measure of perceived price in this study is adapted and modified from Korda & Snoj (2007).
Table 1 Operationalization of Perceived Price Source: Korda & Snoj (2007); Zeithaml (1988)
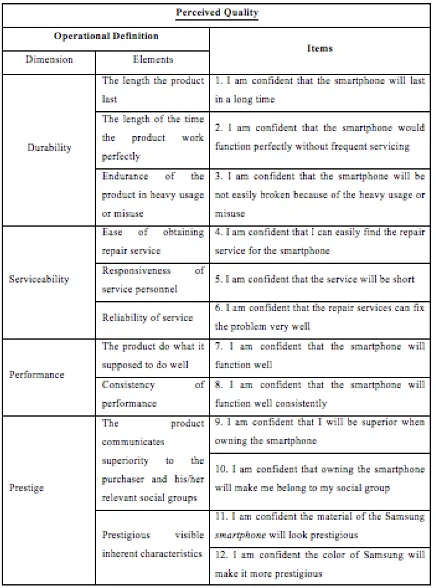
Second, the mediating variable is perceived quality. Perception of quality is consumer’s judgment about “a product’s overall excellence or superiority” (Zeithaml, 1988, p. 3). The measure of perceived quality in this study is adapted from Brucks, Zeithaml, & Naylor (2000). It can be measured through four
dimensions: durability, serviceability, performance, and prestige.
Table 2 Operationalization of Perceived Quality
Source: Brucks, Zeithaml, & Naylor (2000)
35 Table 2 Operationalization of Perceived Value
Source: Kim, Chan, & Gupta (2007)
In line with the purpose of this study, survey is going to be used in order to collect information on customer’s perceived price, perceived quality, and perceived value. Fink (2003) suggests that a business research that wants to collects data from people to know about their behavior and knowledge, may use survey as the research strategy (in Sekaran & Bougie, 2016). In survey, one of the methods to collect the data is by using questionnaire. This research will use questionnaire as the data collection method because it enables the investigation and suggestion of causal relationship between variables (Saunders, Lewis, & Thornhill, 2009). Furthermore, it also allows the collection of a large amount of quantitative data within a short period of time economically (Sekaran & Bougie, 2016). The target population of this research is Brand X customers with age 17-46 years old who are classified in the middle class income in Indonesia.
In order to ensure the accuracy and enhance the quality of this research, the researcher will do validity and reliability test (Sekaran & Bougie, 2016). Validity test will use Pearson Correlation as the decision criteria. The data must have P-value lower than 0.05 to consider as valid or statistically significant (Ghozali, 2013). Reliability test will use Cronbach alpha as the decision criteria. According to Malhotra (2009), 0.6 has satisfied the indication of reliability.
As this study suggests the mediating role of perceived quality in the relationship between perceived price and perceived value. Thus, a mediation analysis will be done in this research. There are three steps in the mediation analysis, in which three regression analyses will be conducted and coefficients
significance will be examined in each step (Ghozali, 2013). First, the researchers will conduct a simple regression analysis with perceived price predicting perceived value. Second, a simple regression analysis with perceived price predicting perceived quality will be conducted. Third, a multiple regression analysis with perceived price and perceived quality predicting perceived value will be conducted. For the mediating variable to be called as an intervening variable, there are three conditions that must be met; (i) independent variable significantly affects dependent variable; (ii) independent variable significantly affects mediating variable; (iii) independent variable and mediating variable significantly affect dependent variable (Ghozali, 2013). Thus, the first, second, and third regression must be significant.
After the three conditions are met, the total and indirect (mediated) effect of independent towards dependent variable will be calculated. The formula to calculate the total effect of independent variable toward dependent variable is as follow (Ghozali, 2013):
d = (a x b) + c’
The formula to calculate the indirect effect is as follow (Ghozali, 2013) :
a x b Where,
d= total effect of IV to DV
a = Unstandardized Coefficient of IV by MV b = Unstandardized Coefficient of MV by DV c’ = Unstandardized Coefficient of IV by DV with MV
RESULTS AND DISCUSSION
The total respondents collected are 126.
However, there are 43 respondents do not pass screening test and 13 respondents are outliers. The respondents majorly come from Surabaya (49%) and Jabodetabek (23%). This research also gets the respondents from Bandung (11%), Medan (7%), and Semarang (6%). Other respondents (4%) are coming from Jogjakarta, Jambi, and Makassar with each city represented by one respondent. Therefore, this research captured various respondents from different cities in Indonesia.36 million rupiah. All of the respondents in this research already have experience in using Brand X smartphone, so we can assume that they have an understanding about the perceived price, perceived quality, and perceived value of Brand X smartphone.
The result of the validity test for perceived price, perceived value, and perceived quality measurement items shows P-values below 0.05 for each item, meaning all of the items are valid to measure perceived price, perceived value, and perceived quality respectively. Moreover, the result of the reliability test for perceived price, perceived value, and perceived quality measurement items shows Cronbach’s Alpha coefficients above 0.6, meaning all of the items are reliable to measure perceived price, perceived value, and perceived quality.
Table 3 Result of Validity & Realiability
There are three regression analyses in this research. The first regression analysis is a single regression between perceived price and perceived value. The second regression is a single regression between perceived price and perceived quality. The third regression is a multiple regression with perceived price and perceived quality predicting perceived value. This series of regression analyses are the steps to know the mediation effect of perceived quality in the relationship between perceived price and perceived quality. Mediation effect can be suggested if all of the three regression analyses have a significant result (Ghozali, 2013). The classical assumption tests in this research are normality, heteroscedasticity, and multicollinearity tests.
Table 4 Result of Classical Assumption Tests
The first classical assumption is normality test.
The normality test wants to fail to reject the null hypothesis (H0) that means the residual data is normally distributed.
The value of Z table for the significance level of 0.05 is +/- 1.96 (Ghozali, 2013). If Zskewness < 1.96 or > -1.96 and Zkurtosis < 1.96 or > -1.96, the null hypothesis will be fail to be rejected. The formula for calculating Zskewness is as follow:
Zskewness = ���� �
√��
The formula for calculating Zkurtosis is as follow: Zkurtosis = � �
√��� Where, � = number of sample
All of three regressions have Zskewnes < 1.96 or > -1.96 and Zkurtosis < 1.96 or > -1.96, so the H0 is fail to be rejected. It means that all of the data residual in the first regression is normally distributed.
Second test is heteroscedasticity.. The heteroscedasticity test in this research is using Glejser test . The heteroscedasticity test wants to fail to reject the null hypothesis (H0) that means there is no heteroscedasticity. The decision rule for the heteroscedasticity test is that the significance value must be > 0.05. If significance value > 0.05, the null hypothesis will be fail to be rejected. Based on the result of regression 1,2, and 3, the significance value is above 0.05. Thus, H0 fails to be rejected. It means that there is no heteroscedasticity in the variance residual of the all of three regressions.
The third test is multicollinearity test which is only for the third regression because it is multiple regression. The decision rule for the multicollinearity is that the tolerance value must be > 0.1, and VIF value must be < 10. If tolerance value > 0.1, and VIF < 10, the null hypothesis fails to be rejected.
Based on the result, the tolerance value is > 0.1 and the VIF is < 10. Thus, there is no multicollinearity in the variance residual of the third regression.
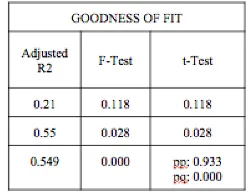
The goodness of fit of the model will be explained through the value of adjusted R2, F-test, and t-test.
Table 5 Result of Goodness of Fit Tests
The first test is adjusted R2. For the first regression with perceived price predicting perceived Perceived
Price Perceived Value Perceived Quality
P-Value = 0.00 P-Value = 0.00 P-Value = 0.00
Cronbach’s
37 value, the value of adjusted R2 is 0.21. It means that 2.1% variation in perceived value can be explained by perceived price. This number is closer to 0 than 1, thus perceived price is not predicting perceived value well. For the second regression with perceived price predicting perceived quality, the value of adjusted R2 is 0.055. It means that 5.5% variation in perceived quality can be explained by perceived price. This number is closer to 0 than 1, thus perceived price is not predicting perceived quality well.
For the third regression with perceived price and perceived quality predicting perceived value, the value of R2 is 0.549. It means that 54.9% variation in perceived value can be explained by perceived price and perceived quality. This number is closer to 1 than 0, thus perceived quality is predicting perceived value well.
The second test is F-test. F-test wants to reject the null hypothesis (H0) that says independent variable does not significantly affect dependent variable and accept the alternate hypothesis (H1) that says independent variable significantly affect dependent variable. If the significance value < 0.05, the null hypothesis should be rejected (Ghozali, 2013).
For the first regression analyses with perceived price predicting perceived value. It can be seen that the significance value is 0.118, greater than 0.05. Thus, the null hypothesis is accepted and it means that perceived price is insignificant to predict perceived value. For the second regression analysis, the significance value is 0.028, smaller than 0.05. Thus, the null hypothesis is rejected and it means that perceived price is significant to predict perceived quality. For the third regression analyses, the significance is 0.000, smaller than 0.05. Thus, the null hypothesis is rejected and it means that perceived price and perceived quality is significant to predict perceived value.
The third test is t-test. t-test wants to reject the null hypothesis (H0) that says independent variable does not significantly affect dependent variable and accept the alternate hypothesis (H2) that says independent variable significantly affect dependent variable. If the significance value < 0.05, the null hypothesis should be rejected (Ghozali, 2013).
For the first regression analysis with perceived price predicting perceived value. The significance value is 0.118, greater than 0.05. Thus, the null hypothesis is accepted and it means that perceived price is insignificant to predict perceived value. For second regression analysis, the significance value is 0.028, lower than 0.05. Thus, the null hypothesis is rejected and it means that perceived price is significant to predict perceived quality. For the third regression analysis, the significance value of perceived price is 0.933, greater than 0.05. Thus, the null hypothesis is accepted and it means that perceived price is
insignificant to predict perceived value. However, the significance value of perceived quality is 0.000, lower than 0.05. Thus, the null hypothesis is rejected and it means that perceived quality is significant to predict perceived value.
According to Ghozali (2013), there is a mediation effect of mediating variable in the relationship between independent and dependent variable if three conditions are met; (1) there is a significant relationship between independent variable and dependent variable; (2) there is a significant relationship between independent variable and mediating variable; (3) there is a significant relationship with independent variable and mediating variable predicting dependent variable. However, in this research, there is insignificant relationship between independent variable and dependent variable. Which means the first condition is not fulfilled. Therefore, the researchers do not continue to Sobel test that can actually be used to find out the indirect effect of mediating variable and its significance in mediating the relationship between independent variable and dependent variable.
Based on the F-test and t-test results in the first regression analysis, it has been found that perceived price is not significant to perceived value (see Table 4.15 and Table 4.18). It means perceived price does not have relationship with the perceived value of middle-class Brand X smartphone customers in Indonesia. Thus, H1 is rejected.
H0: There is no relationship between perceived price and perceived value in Indonesian Brand X smartphone middle class customers
H1: There is a relationship between perceived price and perceived value in Indonesian Brand X smartphone middle class customers
38 Now, potential explanation for this result is offered. In smartphone industry, people may not perceived value based on the perceived price. In the metropolitan lifestyle, smartphone is very crucial in supporting the business, social life, and even daily needs (Nielsen, 2015). People have become dependent on the technology offered by the smartphone. According interview with Ruslan Kogan, people become less concern with the price because people see smartphone as investment rather than expense (Tucker, 2015). People think with a great feature device, they will be able to stay informed and connected, which help their jobs and personal lives (Tucker, 2015). Therefore, there is a possibility that people prioritize the quality of smartphone than the price in determining the value of smartphone.
Based on the F-test and t-test results in the second regression analysis, it has been found that perceived price is significant and positively affects perceived quality (see Table 4.16 and Table 4.19). Thus, H2 is accepted.
H0: There is no relationship between perceived price and perceived quality in Indonesian Brand X smartphone middle class customers
H2: There is a relationship between perceived price and perceived quality in Indonesian Brand X smartphone middle class customers
This finding is in line with Cue Utilization theory, which suggests that customers use a set of cues such as perceived product’s price to judge the product’s quality itself. (Zeithaml, 1988; Scitovszky, 1945; Dodds & Monroe, 1985; Dodds, Monroe, & Grewal, 1991; Erickson & Johansson, 1985; Olson & Jacoby, 1972). This finding is consistent with the study from Chang & Wildt (1994) that finds a significant relationship between perceived price and perceived quality in complex products such as apartments and PCs; study from Verma & Gupta (2004) in colour TV, t-shirt, and toothpaste; study from Hansen (2015) in food products.
As have been explained before in chapter 2, this result is as expected. The possible reasons are because people make judgement on the product’s quality based on a set of cues such as price. People usually believe that the higher the price, the superior the quality is (Verma & Gupta, 2004). People also believe that higher product’s quality can only be produced at higher cost, hence higher product’s quality will have a higher price (Riesz, 1979; Teas & Agarwal , 2000).
According to Nielsen (2011), Indonesian customers are value conscious, meaning that they are willing to pay more for better quality. This customer’s characteristic is also the same with China’s smartphone consumers who are willing to pay more for better
product Nielsen (2016). In China’s smartphone industry, the market share of lower priced smartphones declined and the medium and high-end smartphone has increased (Nielsen, 2016). This may imply the trend in smartphone industry that customers use price to have a better product’s quality.
However, the adjusted R2 is only 0.055. Only 5.5% of perceived quality is explained by perceived price. Potential explanation for the small value of adjusted R2 is offered. According to Zeithaml (1985), if other cues to quality are present, price will become a less important indicator to predict quality. For example, when brand name already provides evidence for the company’s reputation and advertisements communicate the company’s belief about the brand, customers will use the brand’s name and advertisements as references to the product’s quality (Zeithaml, 1988). When there is enough information, customers will not assess the product’s quality based on the comparative price (Lambert, 1980). In this research, the respondents may already have sufficient information about Brand X smartphone’s quality as they already have the experience in using the smartphone. They may already have looked on Brand X advertisements closely beforehand and created the perceived product quality in their mind. Therefore, price might not be used that much as an indicator to quality.
Based on the F-test and t-test results in the third regression analysis, it has been found that perceived quality is found to be significant and have a positive influence on perceived value (see Table 4.17 and Table 4.20). Thus, H3 is accepted.
H0: There is no relationship between perceived quality and perceived value in Indonesian Brand X smartphone middle class customers
39 Therefore, perceived quality is important to the perceived value of Indonesian customer’s in evaluating Brand X smartphone perceived value.
In order for perceived quality to be called as a mediator between the relationship of perceived price and perceived value, the relationship between perceived price and perceived value as well as the relationship between perceived price and perceived quality must be significant (Ghozali, 2013). However, this research finds that perceived price could not predict perceived value. Thus, in this research H4 is rejected as H1 is rejected.
H0: Perceived quality does not mediate the relationship between perceived price and perceived value in Indonesian Brand X smartphone middle class customers
H4: Perceived quality mediates the relationship between perceived price and perceived value in Indonesian Brand X smartphone middle class customers
This finding is contradicting with Zeithaml (1988) suggestion that use the Means-End theory by Gutman (1982). Zeithaml (1988) suggests that customers evaluate the value of a product based on the lower level of abstraction than value such as perceived price and perceived quality. The finding is also contradicting to the empirical study from Beneke, Flynn, Greig, & Mukaiwa (2013) who finds a partial mediation effect of perceived quality in the relationship between perceived price and perceived value in private label household cleaning products. It is also contradicting with the study from Buditama & Aksari (2017) that finds a partial mediation effect of perceived quality in the relationship between perceived price and perceived value in the boarding houses around Jimbaran, Bali area.
Now potential explanation to why perceived price have a insignificant relationship to perceived value while perceived quality have a significant relationship to perceived value is presented. According to Ravald & Grönroos (1996), increasing customer’s perceived value can be done by providing more benefits or reducing customer’s perceived sacrifice. The findings of this research suggest that the middle-class customers of Brand X smartphone in Indonesia prefer to use perceived quality more rather than perceived price, in judging the product’s perceived value. It suggests that this type of customer consider the product’s quality to be more important than the perceived price in evaluating the product’s quality.
Furthermore, the potential explantion to why the significant relationship between perceived price and perceived quality may lead to the significant mediation effect of perceived quality in Beneke, Flynn,
Greig, & Mukaiwa (2013) and Buditama & Aksari (2017). The difference between Beneke, Flynn, Greig, & Mukaiwa (2013) and Buditama & Aksari (2017) studies with this research is that the products investigated are different. The product’s investigated in Buditama & Aksari (2017) do not have a clear reputable brand name if compared to Brand X’s global well-known brand. Moreover, the advertisement may not be as extensive as Brand X’s advertisement that may use TV commercials and billboards. According to Zeithaml (1988), in the case where customers do not know about the product’s brand and advertisements, customers may use the product’s perceived price as an indicator to quality instead.
CONCLUSION
These findings will add the empirical research regarding perceived price, perceived quality, and perceived value. In this section, the researchers will summarize the three main findings of the research. First, perceived price does not have a significant relationship with perceived value. The result does not support the Transaction Utility Theory. The potential reason for this result may be because of the nature of Indonesian customers towards smartphone. The dependability respondents with smartphone may have caused them to ignore the price of the product in evaluating the value of the smartphone. Second, there is a significant relationship between perceived price and perceived quality. The finding is consistent with the Cue Utilization Theory, which suggest that perceived price influence perceived quality. It is also supporting the argument that superior quality only can be produced with a high cost (Riesz, 1979; Teas & Agarwal , 2000). Third, perceived quality has a significant relationship with perceived value. This finding has confirmed that perceived quality provides a higher value for customers, especially Indonesian middle-income class customers in smartphone industry. Fourth, because there is no relationship between perceived price and perceived value, a mediation effect of perceived quality between the relationship of perceived price and perceived value cannot be suggested.
Regardless the researchers’ rigorous effort in designing and conducting the research, this study still has some limitations. There are two limitations in this research.
First, this research finds a low adjusted R2 in the relationship between perceived price and perceived quality. It means the perceived price does not fully explain perceived quality. Thus, it opens the possibility that there may be other factors that explain perceived quality besides perceived price in Indonesian middle class customers of smartphone industry.
40 generalized as it uses simple random sampling and regresssion. However, different type of target market may have different perceived values towards the same product (Saxen, 2002). For example, older customers with age above 50 years may evaluate that the main value of a cell phone is for communication in emergencies only, while younger customers with age up to 25 years may evaluate that the main value of a phone is to stay in touch with their friends (Saxen, 2002). Thus, it opens the possibility that different group of age has different perceived value.
After understanding the limitations of this research and the result of this study, this section will give two suggestions for further research, so that a better academic research can be produced in a different perspective.
First, the researchers suggest that future research can look for other possible factors that may determine customer’s perceived quality by conducting a factor analysis. By conducting factor analysis, the future research may know the factors that explain much about customer’s perceived quality especially in the smartphone industry.
Second, researchers may conduct a research that compares the perceived value of different target market characteristics. For example, researchers may compare the perceived value of customers in different range of age (younger age vs older age). This will allow smartphone companies to manage the communication of their product’s value differently towards different group of age. It will increase the efficiency and effectiveness of their marketing efforts.
REFERENCES
Agarwal, S., & Teas, R. K. (2001). Perceived Value: Mediating Role of Perceived Risk. Journal of Marketing Theory and Practice, 9 (4), 1-14. Baker, S., Thompson, K. E., & Engelken, J. (2004).
Mapping the values driving organic food choice Germany vs the UK. European Journal of Marketing, 38 (8), 995-1012.
Beneke, J., Flynn, R., Greig, T., & Mukaiwa, M. (2013). The influence of perceived product quality, relative price and risk on customer value and willingness to buy: a study of private label merchandise. Journal of Product & Brand Management, 22 (3), 218-228.
Bolton, R. N., & Drew, J. H. (1991). A Multistage Model of Customers' Assessments of Service Quality and Value. Journal of Consumer Research, 17, 375-384.
Bornemann, T., & Homburg, C. (2011). Psychological Distance and the Dual Role of Price. Journal of Consumer Research, 38.
Boston Consulting Group. (2013). Indonesia’s Rising
Middle-Class and Affluent Consumers. Boston Consulting Group. Boston Consulting Group. Brucks, M., Zeithaml, V. A., & Naylor, G. (2000).
Price and Brand Name As Indicators of Quality Dimensions for Consumer Durables. Journal of Academy Marketing Science, 28 (3).
Buditama, W. S., & Aksari, N. A. (2017). Peran Perceived Quality Memediasi Perceived Price terhadap Perceived Value Pengguna jasa Layanan Rumah Kos Jimbaran. E-Jurnal Manajemen Unud, 6 (2), 1055-1082.
Chang, T.-Z., & Wildt, A. R. (1994). Price, Product Information, and Purchase Intention: An Empirical Study. Journal of the Academy of Marketing Science, 22 (1), 16-27.
Chen, Z., & Dubinsky , A. J. (2003). A Conceptual Model of Perceived Customer Value in E-Commerce: A Preliminary Investigation. Psychology & Marketing , 20 (4), 323-347. Cheng, M.-S., Cripps , H., & Chen , C. H. (2006). The
Relationships between Perceived Quality, Perceived Value, and Purchase Intentions–A Study in Internet Marketing.
Chi, H., Yeh, R. H., & Tsai, C. Y. (2011). The Influences of Perceived Value on Consumer Purchase Intention: The Moderating Effect of Advertising Endorser. ournal of International Management Studies, 6 (1), 1-6.
Cox, D. F. (1967). Risk Taking & Information Handling in Consumer Behaviour. Boston, Division of Research, Graduate School of Business Administration, Harvard University. Cravens, D. W., Holland, C. W., Lamb Jr., C. W., &
Moncrief III, W. C. (1988). Marketing's role in product and service quality. Industrial Marketing Management, 17 (4), 285-304. Cronin, J., Brady, M. K., & Hult, G. T. (2000).
Assessing the Effects of Quality, Value, and Customer Satisfaction on Consumer Behavioral Intentions in Service Environments. Journal of Retailing, 76 (2), 193-218.
Day, E., & Crask, M. R. (2000). Value Assessment: The Antecendent of Cuatoemr Satisfaction. Journal of Consumer Satisfaction, Dissatisfaction & Complaining Behavior, 13. Diamond, W. D., & Campbell, L. (1989). The Framing
of Sales Promotions: Effects on Reference Price Change. Association for Consumer Research , 241-247.
Dodds, W. B., & Monroe, B. K. (1985). The Effect of Brand and Price Information on Subjective Product Evaluations. Association for Consumer Research, 12, 85-90.
195-41 199.
Garvin, D. A. (1984, October). What Does "Product Quality" Really Mean? MIT Sloan Management Review .
Garvin, D. A. (1987, November). Competing on the Eight Dimensions of Quality. Market Research. Ghozali, I. (2013). Aplikasi Analisis Multivariat dengan Program IBM SPSS 21. Semarang: Universitas Diponegoro.
Gutman, J. (1982). A Means-End Chain Model Based on Consumer Categorization Processes. Journal of Marketing, 46 (2), 60-72.
Hansen, T. (2015). Understanding consumer perception of food quality: the cases of shrimps and cheese. British Food Journal, 107 (7), 500-525.
Indonesia Investment. (2016, April 30). Indonesia is the 3rd-Largest Smartphone Market in the Asia Pacific. Retrieved February 21, 2017, from Indonesia is the 3rd-Largest Smartphone Market in the Asia Pacific:
http://www.indonesia- investments.com/news/todays- headlines/indonesia-is-the-3rd-largest- smartphone-market-in-the-asia-pacific/item6777?
Indonesia Investment. (2016, September 2). Which Brands Dominate the Smartphone Market in Indonesia? Retrieved June 11, 2017, from Indonesia Investment: https://www.indonesia-
investments.com/news/todays- headlines/which-brands-dominate-the-smartphone-market-in-indonesia/item7152? Jacoby, J., Olson, J. C., & Haddock, R. A. (1971).
Price, Brand Name, and Product Composition Characteristics as Determinants of Perceived Quality. Journal of Applied Psychology, 55 (6), 570-579.
Kim, H.-W., Chan, H. C., & Gupta, S. (2007). Value-based Adoption of Mobile Internet: An empirical investigation. Decision Support Systems, 43, 111-126.
Kim, H.-W., Xu, Y., & Gupta, S. (2012). Which is more important in Internet shopping, perceived price or trust? Electronic Commerce Research and Applications, 11, 241-252.
Korda, A. P., & Snoj, B. (2007). Direct and indirect effects of perceived price on perceived value of mobile phones. ANN. TELECOMMUN, 62 (9-10), 967-989.
Kotler, P. (2012). Marketing Management. Pearson Education Limited.
Kuehn, A. A., & Day, R. L. (1962). Strategy of Product Quality. 40 (6), 100-110.
Lambert, D. R. (1980, January ). Price As A Quality Signal: The Tip of the Iceberg. Economic
Enquiry .
Lapierre, J. ́., Filiatrault, P., & Chebat, J.-C. (1999, February). Value Strategy Rather Than Quality Strategy: A Case of Business-to-Business Professional Services. Journal of Business Research , 235-246.
Leahy, R. (2008). Brand Loyalty in Fast Moving Consumer Good Markets: The Role of Bonds . International Journal of Business and Management, 3 (12), 7-19.
Main, J. (1994). Quality Wars. New York: Free Press. Malhotra, N. K. (2009). Review of marketing research (Vol. 5). New Jersey: Emerald Group Publishing Limited.
Mazumdar, T. (1993). A value-based orientation to new product planning . Journal of Consumer Marketing, 10 (1), 28-41.
Monroe, K. B. (1973). Buyers' Subjective Perceptions of Price . Journal of Marketing Research , 10 (1), 70-80.
Monroe, K. B., & Chapman, J. D. (1987). Framing Effects on Buyers' Subjective Product Evaluations. Advances in Consumer Research, 14, 193-197.
Morgan, C., & Murgatroyd, S. (1994). Total Quality Management in the Public Sector. Buckingham: Open University Press.
Nielsen. (2011, July 4). Winning the Hearts of Indonesian Customer. Retrieved June 7, 2017,
from Nielsen:
http://www.nielsen.com/us/en/insights/news/2 011/winning-the-hearts-of-indonesian-consumers.html
Nielsen. (2015). Smartphone User Persona Report 2015. vsers. nielsen.
Nielsen. (2016, 11 3). Nielsen: Consumption Upgrading - A Battle Yet to Win for Chinese Manufacturers. Retrieved 6 7, 2017, from Nielsen:
http://www.nielsen.com/cn/en/insights/news/2 016/nielsen-consumption-upgrading-a-battle-yet-to-win-for-chinese-manufacturers.html Oh, H. (1999). Service quality, customer satisfaction,
and customer value: A holistic perspective. International Journal of Hospitality Management, 18, 67-82.
Olson, J. C., & Jacoby, J. (1972). Cue Utilization in the Quality Perception Process. Proceedings of the Third Annual Conference of the Association for Consumer Research , 167-179.
Ravald, A., & Grönroos, C. (1996). The value concept and relationship marketing. European Journal of Marketing, 30 (2), 19-30.
42 Rivière, A. (2014). Towards a model of the perceived
value of innovation: The key role of perceived benefits ahead of the adoption process . Recherche et Applications en Marketing , 1-23. Sánchez-Fernández, R., & Iniesta-Bonillo, M. Á. (2007). The concept of perceived value: a systematic review of the research. Marketing Theory, 7 (4), 427-451.
Saunders, M., Lewis, P., & Thornhill, A. (2009). Research methods for business students. Harlow: Pearson Education Limited.
Saxen, R. (2002). Marketing Management. New Delhi, India: McGraw-Hill Education.
Scitovszky, T. (1944). Some Consequences of the Habit of Judging Quality by Price. The Review of Economic Studies, 12 (2), 100-105.
Sekaran, U., & Bougie, R. (2016). Research Methods for Business (Vol. 7). West Sussex: John Wiley & Sons Ltd.
Setyawan, B. (2010, July). Pengaruh perceived quality, perceived sacrifice, perceived value, satisfaction pada behavioral intentions (survei pada mahasiswa Universitas Sebelas Maret Surakarta).
Snoj, B., Pisnik, A., & Mumel, D. (2004). The relationships among perceived quality, perceived risk and perceived product value. Journal of Product & Brand Management, 13 (3), 156-167.
Somma, M. D. (2014, March). Brand Perceptions: Perceived Quality Rules The Day. Retrieved April 1, 2017, from Branding Strategy Insider: https://www.brandingstrategyinsider.com/2014 /03/brand-perceptions-perceived-quality-rules-the-day.html#.WN-LEhKGPBI
Statista. (2016). Vendors' market share of smartphone shipments in Indonesia from 2014 to 2016. Retrieved February 21, 2017, from Statista: https://www.statista.com/statistics/516302/ind onesia-smartphone-shipments-vendor-market-share/
Sweeney, J. C., Soutar, G. N., & Johnson, L. W. (1999). The role of perceived risk in the quality-value relationship: A study in a retail environment. Journal of Retailing, 75 (1), 77-105.
Takeuchi, H., & Quelch, J. (1983, July). Quality Is More Than Making a Good Product. Retrieved April 1, 2017, from Harvard Business Review: https://hbr.org/1983/07/quality-is-more-than-making-a-good-product
Tam, a. L. (2004). Customer Satisfaction, Service Quality and Perceived Value: An Integrative Model . Journal of Marketing Management , 20 (7-8), 897-917.
Teas, R. K., & Agarwal , S. (2000). The Effects of
Extrinsic Product Cues on Consumers' Perceptions of Quality, Sacrifice, and Value. Journal of the Academy of Marketing Science, 28 (2), 278-290.
Thaler, R. H. (1983). Transaction Utility Theory. Advances in Consumer Research, 10, 229-232. Tucker, H. (2015). Why do our phones keep getting so expensive? Retrieved 05 19, 2017, from www.news.com.au:
http://www.news.com.au/technology/gadgets/ mobile-phones/why-do-our-phones-keep-
getting-so-expensive/news-story/45e62a2ac2fbdcbfe8cff71857f221c7 Ventoura–Neokosmidi, Z. (2005). Advertising, Market
Share, And Profitability In The Greek Consumer Industry. Journal Of Business & Economics Research, 3 (9), 69-75.
Verma, D. P., & Gupta, S. S. (2004). Does Higher Price Signal Better Quality? VIKALPA, 29 (2), 67-77.
Waldman, M. (1996). Durable Goods Pricing When Quality Matters. The Journal of Business, 69, 489-510.
Wang, Y., Lo, H. P., Chi, R., & Yang, Y. (2004). An integrated framework for customer value and customer-relationship- management performance: a customer-based perspective from China. Managing Service Quality , 14 (2/3), 169-182.
Wernerfelt, B. (1986). THE RELATION BETWEEN MARKET SHARE AND PROFITABILITY. The Journal of Business Strategy , 67-74. Wijaya, A., Semuel, H., & Japarianto, E. (2013).
Analisa Pengaruh Perceived Quality Terhadap Perceived Value Konsumen Pengguna Internet Mobile XL di Surabaya. Jurnal Manajemen Pemasaran Petra, 1 (1), 1-12.
Woodruff, R. B., & Flint, D. J. (2014). Marketing's Service Dominant Logic and Customer Value. In R. F. Lusch, & S. L. Vargo, The Service-dominant Logic of Marketing: Dialog, Debate, and Directions (pp. 183-193). Routledge. Yannacopoulos, D. (2014). Evaluating Websites and
Web Services: Interdisciplinary Perspectives on User Satisfaction: Interdisciplinary Perspectives on User Satisfaction. IGI Global. Zeithaml, V. A. (1988). Consumer Perceptions of