341
The Impact of Marketing Mix Elements toward Brand Equity through Brand
Awareness and Brand Image as Mediators in Bakery Industry in Indonesia
Ivena Renata Chandra
International Business Management Program, Petra Christian University Jl. Siwalankerto 121-131, Surabaya
E-mail: [email protected]
ABSTRACT
As the factor accompanying the rise of GDP of people in Indonesia, consumption habit in having meal is as well shifting from traditional staple to wheat based product such as bakery products. Knowing from this phenomenon, it is known that bakery industry in Indonesia is on the business’s concern recently.
The effort in having good brand equity in the consumer’s eyes surely will bring long term profit for the companies that are playing in this industry. In order to have a good brand equity, marketing mix elements which are price, intensity of marketing activities, store image, and price deals are believed can be the effective strategy in the business competition. Moreover, the existence of brand awareness and brand image as mediators are also playing a big role in achieving good brand equity.
This market research is conducted by spreading 158 questionnaires to bakery consumers in Surabaya. This data is analyzed using regression with mediating analysis. The result is showing that intensity of marketing activities is not significantly impacting brand equity through brand awareness. Additionally, only price and store image give significant affect toward brand equity through brand image whereas intensity of marketing activities and price deals are not.
Keywords: Bakery Industry, Marketing Mix, Brand Awareness, Brand Image, Brand Equity
ABSTRAK
Seiring dengan naiknya jumlah PDB masyarakat Indonesia, kebiasaan konsumsi juga bergeser dari makanan-makanan tradisional ke produk yang berbahan tepung seperti produk bakery. Fenomena ini membuat industri bakery di Indonesia menjadi sorotan baru-baru ini.
Memiliki ekuitas merek yang baik di mata konsumen tentu akan membuat penjualan jangka panjang meningkat untuk perusahaan-perusahaan yang bermain di bidang ini. Dalam pencapaian ekuitas merek yang bagus, marketing mix yang terdiri dari harga, intensitas dari aktifitas pemasaran, citra toko, dan promosi harga dipercaya dapat menjadi strategi yang efektif. Selain itu, kesadaran merek dan citra merek juga memiliki peran mediasi yang besar dalam mencapai ekuitas merek yang baik.
Riset ini dilakukan dengan penyebaran kuesioner berjumlah 158 ke konsumen bakery di Surabaya. Data yang diperoleh selanjutnya dianalisa lebih lanjut menggunakan regresi dengan analisa mediasi. Sebagai hasil, ditemukan bahwa intensitas dari aktifitas pemasaran tidak memberikan efek signifikan terhadap ekuitas merek dengan kesadaran merek sebagai variabel mediasi. Hasil lainnya menjunjukan bahwa hanya harga dan citra merek yang mempengaruhi ekuitas merek secara signifikan dengan perantara citra merek, sedangkan dengan perantara citra merek, intensitas dari aktifitas pemasaran dan promosi harga tidak memberikan hasil yang signifikan terhadap ekuitas merek.
Kata Kunci: Industri Bakery, Marketing Mix, Kesadaran Merek, Citra Merek, Ekuitas Merek
INTRODUCTION
Competition is a phrase that is frequently heard in these days’ economy development. Many companies strive to be the best in terms of efficiency and effectiveness in their products and services, marketing tools, strategy, production process, and the other aspects. Additionally, open international market that is happening now is also affecting how business people acts. Businesses only have
two options in this emerging situation which are to be faster, better, and cheaper at the same time or to suffer and go out of business.
342
specific brand (in Pitta and Katsanis, 1995). Therefore Donthu, Lee, & Yoo (2000) argued that brand equity offers competitive advantage for the business owners for it creates competitive barriers. That situation gives a higher possibility for a company to survive or even win the competition. Marketing mix is considered as the strongest affect to create brand equity (Chattopadhyay, Shivani, & Krishnan, 2010). The marketing mix, including price, intensity of market activities, store image, and price deals will play a big role to the brand equity through some mediators such as brand awareness and brand image.As the case study, this research is going to take a deeper look at bakery industry in Indonesia. A recent phenomenon that has just happened in Indonesia, about 150 million of middle income people, which equals to more than a half of the country’s population, is growing up to middle class income. As a consequence, there is a certainty of life-style changing in the society that is placed. When coming to the changing of lifestyle, the most visible aspect that changes is on how people consume. Yulisman (2014) recently reviewed that there is a shifting in people’s consumption behavior from eating traditional staple to wheat-based product such as bakery and noodle. The fact is strengthened by the growth rise of bakery industry in Indonesia that is constantly experiencing a double digit every year with the number of 12%, 12%, and 15% growth in 2012, 2013, and 2014 respectively. With that highlight, it is known that bakery industry in Indonesia is on the business’s concern recently. Since this paper is analyzing an industry, thus there are three top bakery brands in Indonesia that are taken to be analyzed which are BreadTalk, Holland Bakery, and Sari Roti. Hence, this research is discussing the impact of marketing mix elements such as price, intensity of marketing activities, and price deals toward brand equity through brand awareness and brand image as mediators in bakery industry in Indonesia.
LITERATURE REVIEW
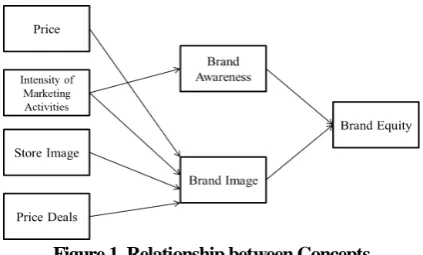
This research is going to have seven main variables which consist of four independent variables, two mediating variables, and one dependent variable which the model is adopted from Rajh (2005). The independent variables which also represent the marketing mix elements are price, intensity of marketing activities, store image, and price deals. The mediators are brand awareness and brand image whereas the dependent variable is brand equity itself.
Price
According to Kotler and Amstrong (2001), price is the measurement of value charged by the company to the customer in exchange with the value of goods and services received (in Nezami, 2013). Thus, it can be said that price is an indicator of product’s quality (Yoo, Donthu, & Lee, 2000). When it talks about quality, it means that the higher the price, a product will be less vulnerable, and in terms of bakery industry, it tastes, feels, smells, and looks better.
Intensity of Marketing Activities
According to Rajh (2005), intensity of marketing activities can be disparted into advertising intensity, distribution intensity, and sponsorships intensity. However since sponsorship is not relevant with the industry that is being analyzed in this paper, thus sponsorship will be deleted. According to Yoo, Donthu, & Lee (2000), advertisement refers to the frequency and cost of spread through various tools and mediums (in Nezami, 2013). While distribution can be called as intensive if there are a lot of products available in the market in which it also reduces customer’s spending time in looking for that specific brand and will gradually provide convenience in purchasing that specific brand (Chattopadhyay, Shivani, & Krishnan, 2010). However, intensive distribution which is perceived positively by customers only valid for certain types of product which is convenience goods and not shopping or specialty goods (Yoo, Donthu, & Lee, 2000). Thus, because bakery products are convenience goods, the more intense the distribution, the more positive the brand equity will be.
Store Image
Store image embraces some traits such as physical environment, service level, and merchandise quality (Baker, Grewal Parasuraman, 1994; Zimer and Golden, 1988 in Chattopadhyay, Shivani, & Krishnan, 2010). According to Grewal, Krishnan, and Borin (1998), physical environment refers to store environment, service level refers to customer service, and merchandise quality refers to product quality (in Chattopadhyay, Shivani, & Krishnan, 2010). However, this research is only observing physical environment and merchandise quality. In this paper, store environment leads to the ambiance that is felt by customer in visiting one bakery store whereas product quality leads to the quality of any products sold in the store.
Price Deals
Price deals happen when a product is offered to the customers in a promotional price which means it is cheaper than it used to be. Price deals or price promotions that include short-term price reduction like special sales, coupons, rebates, or refund are believed to decrease brand image which leads to the degradation of brand equity in a long term despite of its short term gain (Yoo, Donthu, & Lee, 2000).
Brand Awareness
Brand awareness is stated by Keller (1993) as how consumers can effortlessly memorize one specific brand when he/she is going to buy a product (in Durrani, Godil, Baig, & Sajid, 2015). Both Aaker (1991) and Kotler and Keller (2006) stated that brand awareness is customer’s ability to recall, recognize, and identify a brand under different conditions (in Dib and Alhaddad, 2014).
Brand Image
343
Baig, & Sajid, 2015) which can give negative or positive identity that could improve or demolish the overall performance of a brand. Roy and Banerjee (2007) stated that basically, brand image is described as the consumer’s thoughts and feelings toward a brand (in Hsiang-Ming Lee, Ching-Chi Lee, & Wu, 2011).Brand Equity
According to Kotler and Keller (2007), brand equity is used as a tool to add value to the company’s products or services (in Subekti, 2010). Therefore, Kabadayi, Aygun, and Cipli (2007) said that brand equity is a valuable source to gain competitive advantage among the competitors. Kotler and Keller (2007) believe that there are four basic concepts in determining brand equity according to Young and Rubicam (Y&R) advertising agency based on Brand Asset Valuator (BAV) which are:
Differentiation
It is defined as the uniqueness of the brand and what makes it stand apart from another competitors. Relevance
It measures the connection between the brand and the customers and how meaningful the brand is to the customer’s life. Relevance talks about the importance of the brand to the consumers.
Esteem
Esteem is customer’s perception about the growing or declining of a brand’s popularity in which it would (or not) make the customer hold the brand in high regard. Knowledge
This measures the intimacy of the customer with the brand in which it makes them aware of the brand by understanding its identity.
Relationship between Concepts
This research is adopted from a theory that has been developed by Rajh (2005) titled The Effect of Marketing Mix Elements on Brand Equity and is talking about marketing mix elements effects to brand equity through mediator such as brand awareness and brand image.
Figure 1. Relationship between Concepts
Figure 1 above shows the model used in this paper. From the model, there are six (6) hypotheses that are tested in this research which are:
H1: Intensity of marketing activities has significant impact towards brand equity in bakery industry in Indonesia
H2: Intensity of marketing activities has significant impact towards brand awareness
H3: Intensity of marketing activities has significant impact towards brand equity in bakery industry in Indonesia mediated by brand image
H4: Price, intensity of marketing activities, store image, and price deals individually have significant impact towards brand equity in bakery industry in Indonesia H5: Price, intensity of marketing activities, store image,
and price deals individually have significant impact towards brand image in bakery industry in Indonesia H6: Price, intensity of marketing activities, store image,
and price deals individually have significant impact towards brand equity mediated by brand image in bakery industry in Indonesia
What people think about price is related to what they think about the products’ quality (Yoo, Donthu, & Lee, 2000). Many researches argued that the higher the price, the more people think that a brand has higher quality.Thus, the more expensive the product of a brand, people will have better feelings and thoughts of a certain brand which will leads to brand image and eventually it increases brand equity. It is argued that the intensity of marketing activities positively affecting brand awareness and brand image. Keller (2003) added that advertising gives strong, favorable, and unique brand associations and creating positive judgment to the people (in Kabadayi, Aygun, & Cipli, 2007). The more intense the advertising and distribution, the more customer will see and hear about the product which makes the brand becomes highly recognized that it will increase brand awareness of customer toward a brand and increase brand equity simultaneously. When the brand is recognized and included in the consideration set of customer, it will simplify the customer’s choice (Yoo, Donthu, & Lee, 2000) and will create positive brand image which in the end will increase the brand equity itself. Similarly to the store image, when it gets better, in this case is physical environment and merchandise quality, customer will have better thoughts and feelings toward a brand in which it increases brand image that will simultaneously increase brand equity. Price deals are believed can encourage people to buy a product in a short time. However, according to Rajh (2005), despite of its short term gain, price deals give negative impact towards brand image since people will perceive it as company’s act to widen the profit margin by lowering the quality of a product (Yoo, Donthu, & Lee, 2000). When customer has bad thoughts about a brand, it will decrease the brand image and will eventually reduce the brand equity itself.
344
RESEARCH METHODSince this paper is going to discuss about the effect of marketing mix elements toward brand equity through brand awareness and brand image, thus the independent variables will be the marketing mix elements which are price, intensity of marketing activities, store image, and price deals, the mediating variables will be brand awareness and brand image, and the dependent variable in this research will be brand equity.
As stated above, this paper is measuring bakery industry in Indonesia. Thus, in having the sample, the writer chooses to have probability sampling with the approach of simple random sampling. This approach is used because every population elements are having equal chance of selection. In this research, the population are the consumers of either three selected brands which are Sari Roti, Holland Bakery, or Bread Talk in Surabaya, Indonesia that have ever seen the advertisement of the brands and the target respondents are the people in West, East, North, South, and Center of Surabaya. The writer chooses Surabaya as the sample because it is one of the biggest bakery consumers in Indonesia (www.google.com/trends). This research is getting its sample by questionnaire distribution through online website in which the total observations are 158 samples.
There are several tests that are conducted in this research by IBM SPSS Statistics 22 which are first reliability and validity test. Validity refers to the extent that the test is really measuring what first is designed to be measured, thus if an indicator is valid, it measures the data correctly (Field, 2009) where reliability is talking about whether the instrument can be applied under different condition or not (Field, 2009). The second test is classical assumption tests which consist of multicollinearity test, autocorrelation test, heteroscedasticity test, and normality test. Multicollinearity test is to know whether there is correlation between each independent variable or not. This test will be conducted using correlation matrix, Tolerance, and VIF. Autocorrelation test is using Lagrange Multiplier (LM) test, heteroscedasticity test is using Glejser, and normality test is using skewness and kurtosis ratio. Below is the formula of skewness and kurtosis ratio developed by Garson (2012):
Skewness Ratio = Statistic / Std. Error Kurtosis Ratio = Statistic / Std. Error
After all the data have passed the tests above, the last test is regression with mediation analysis which consist of t-test and sobel test. In the testing, there are some models that are tested in this research and those are based on each mediating variable:
First mediator, brand awareness:
1. The impact of intensity of marketing activities toward brand equity (simple linear regression) 2. The impact of intensity of marketing activities
toward brand awareness (simple linear regression)
3. The impact of intensity of marketing activities and brand awareness toward brand equity (multiple linear regression)
Second mediator, brand image:
4. The impact of price, intensity of marketing activities, store image, and price deals toward brand equity(multiple linear regression)
5. The impact of price, intensity of marketing activities, store image, and price deals toward brand image (multiple linear regression)
6. The impact of price, intensity of marketing activities, store image, price deals, and brand image toward brand equity (multiple linear regression) Sobel test is conducted manually with the formula of:
√
Where,
S = Standard of error
a = Coefficient of the relationship between independent to mediator variable
b = Coefficient of the relationship between mediator to independent variable
RESULTS AND DISCUSSION
For the descriptive statistics of the respondents, it is found out that 65% of the respondents are female and 35% are male, whereas 51% of them are student, 45% are worker, and the rest are not working. For the residence distribution of the respondent, 44% are coming from East Surabaya, 33% South Surabaya, 16% West Surabaya, 4% North Surabaya, and 3% Center Surabaya. Respondents’ average expenditure per month is dominated from 1 million to 2 million rupiah which accounts for 34% of the total respondent, following are above 4 million Rupiah, 2 million to 3 million Rupiah, below 1 million Rupiah, , and 3 million to 4 million Rupiah which account for 23%, 19%, 15%, and 9% respectively. 37% of the respondent consume bakery product at 1 – 3 times per month, while 32% of them at 4 – 6 times per moth. Those who consume bakery product 7 – 9 times per month account for 13%, 10 – 12 times per month is 10%, and above 13 times per month is 8%. As explained above that there are 3 different brands that are analyzed in this study, 42% of the respondents consume BreadTalk most, 37% consume Sari Roti most, and 21% consume Holland Bakery most.
The data gathered have been tested for its reliability and validity in which all the Cronbach’s Alpha of each variable exceed 0.70 which means they are all reliable. The degree of freedom (df) of this research equals to n – 2, where n is the number of samples which is 158 with the confidence level of 95% and it resulted 0.1562 in r-table. Thus, since all of the Corrected Item-Total Correlation in Item-Total Statistic tables are higher than the value gotten from r-table which is 0.1562 it means the data are all valid.
345
test. The first one is multicollinearity test in which it is a test to analyze whether there is correlation among the independent variable or not (Ghozali, 2013). The existence of multicollinearity can be detected when the value of correlation matrix is higher than 0.90, when VIF value is higher than 10, and when tolerance value is lower than 0.10 (Ghozali, 2013). After the data gathered have been tested, it resulted that there is no multicollinearity inside the models. The second one is autocorrelation test. This test is done by regressing two lag residuals of the data and when the significant value gotten is below 0.05, then there is a tendency of autocorrelation (Ghozali, 2013). The result of this test shows that there is no autocorrelation exist in the models. The third test that is conducted is heteroscedasticity test which is Glejser test. Glejser test is a test to analyze the data whether there is heteroscedasticity or not which is by regressing the absolute of dependent variable with the independent variable. When the significant value of the independent variable is below 0.05, which is significant, then there is heteroscedasticity. Therefore a good research should have significant value of absolute above 0.05, and this research, fortunately, showing that all the significant values are above 0.05 which means there is no heteroscedasticity inside the variance’s residuals. The last test of Classical Assumption tests is normality test. As explained earlier, this paper sees the statistical analysis of normality test from the ratio of kurtosis and skewness value of the residual. It can be known that the distribution of the residual is normal when the results of the calculation fall between -2 and 2 (Garson, 2012). After the testing, it is known that the skewness and kurtosis ratio, in all of the models tested, indicate the ratios between -2 and 2 which concluded that the residuals of the data are normally distributed.After the data have passed all of the tests, regression analysis with mediation variable is conducted to know whether there is significant mediator inside the model or not. In t test, this section will find out which independent variable is significant towards the dependent variable, which independent variable is significant towards the mediation variable, and which mediation variable is significant towards the dependent variables. In t test, the independent variable can be said as significant impact toward the dependent variable when t-value in the table is above 2 and significant value is below 0.05 (Ghozali, 2013). Sobel analysis will be done after the t test is done because sobel analysis is only analyzing the model with mediator. Sobel analysis will only be conducted when all of the conditions below, which are gotten from the result of t test, are fulfilled: the first one is the impact of independent variable towards dependent variable is significant (X Y), the second one is the impact of independent variable towards mediator variable is significant (X M), and last but not least is the impact of mediator variable towards dependent variable is significant (M Y). In order to see whether the mediation is significant, calculated Z-value in sobel test needs to be bigger than Z-value with significant level of 5% which is 1.96.
Below is the table of the result of t-test in analyzing each model. is 2.894 which is higher than 2 and the significant value is 0.004 which is below 0.050. Therefore it can be concluded that intensity of marketing activities has significant effect toward brand awareness.
As it can be seen in Table 2 above, t value of intensity of marketing activities is -1.152 which is lower than 2 and the significant value is 0.251 which is higher than 0.05. Therefore because both value does not fulfilling the criteria, it can be said that the independent variable does not have significant impact toward the dependent variable. Thus it can be said that intensity of marketing activities does not affecting brand awareness.
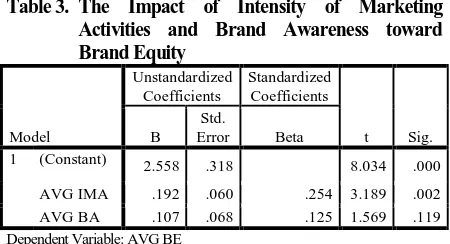
Table 3. The Impact of Intensity of Marketing Activities and Brand Awareness toward Brand Equity
346
insignificant relationship from brand awareness towards brand equity. price towards brand equity is 3.810 in t value and 0.000 in significant value. T value for intensity of marketing activities towards brand equity is 1.867 and the significant value is 0.064. T value for store image to brand equity is 4.245 and the significant value is 0.000. T value for price deals to brand equity is 2.447 and significant value is 0.016. Therefore it can be concluded that price, store image, and price deals affecting brand equity individually, but intensity of marketing activities does not affecting brand equity.Table 5. The Impact of Price Intensity of Marketing towards brand image is insignificant with t value of 1.864 and significant value of 0.064, the impact of store image towards brand image is significant with t value of 4.944 and significant value of 0.000, and the impact of price deals is insignificant variable price and store image have significant impact toward brand image with t value of 0.131 and significant value of 0.896. Thus as a conclusion, price and store image are significantly affecting brand image, however intensity of marketing activities and price deals do not have significant impact toward brand image.
Table 6. The Impact of Price Intensity of Marketing Activities, Store Image, Price Deals, and Brand Image toward Brand Equity of price is 0.708 and its significant value is 0.480, while t value of intensity of marketing activities is 1.149 and its significant value is 0,252. Both variables shows that the t values are below 2 and significant values above 0.05. Thus, it can be concluded that variable price and intensity of marketing activities are not significantly impacting brand equity, whereas the other independent variable which is store image, price deals, and brand image are affecting brand equity significantly since the t value and significant value of those variable are above 2 and below 0.05 respectively.
After conducting t test, it is known which model is fulfilling the three criteria stated above. There are only two models that are fulfilling all of the three criterias which are the second and the fourth model. The second model is the impact of price towards brand equity through brand image. It is known from the result above that there are significant relationships from price towards brand equity, from price towards brand image, and from brand image towards brand equity. Since all of the criterias stated above are fulfilled, then sobel test can be conducted in this model. The fourth model is the impact of store image towards brand equity through brand image. As seen above, there are significant relationships from store image to brand equity, from store image to brand image, and from brand image to brand equity. Thus because all of the criterias are fulfilled, sobel test can be done. Whereas for the other models, which are first, third, fifth, and sixth model, sobel test cannot be conducted since those model do not fulfilling the three criterias.
347
√
√ √
As seen from the result above, Z value is 3.974 which is higher than the standard value of 1.96, Thus as a conclusion, brand image can be a significant mediator in this test.
Seeing from Table 4.46, it is known that when brand image is put inside as the independent variable, store image is still significantly impacting brand equity. Hence there is partial mediation in the model. Gotten from Table 4.45, it can be seen that the coefficient value of store image as the independent and brand image as the dependent is 0.314 and the standard of error is 0.063. In Table 4.46 it is also known that the coefficient value of brand image as the independent variable and brand equity as the dependent variable is 0.500 and its standard of error is 0.083. Thus the calculation of sobel will be:
√
√ √
Since the result of Z value is 3.811 which is higher than the standard value of 1.96, thus it can be concluded that brand image can be a significant mediator from store image towards brand equity.
The first relationship that is discussed is the impact of intensity of marketing activities towards brand equity through brand awareness. Based on t test that has been done previously, it is known from Table 1 that intensity of marketing activities has significant affect towards brand equity with significant value of 0.004 and t value of 2.894. Table 3 also shows that the impact of intensity of marketing activities towards brand equity is significant shown by the value of t which is 3.189 and the value of significant which is 0.119. On the other hand, intensity of marketing activities does not have impact towards brand awareness according to the result obtained. It can be seen in Table 2 that t value is -1.152 and significant value is 0.251 in which both values are violating the standards which lower than 2 and higher than 0.05 respectively. From Table 3 it is also known that the mediating variable which is brand awareness actually does not have significant impact towards brand equity. As explained as well in sobel test that since the results in t test is not fulfilling all of the three criteria, thus as a conclusion, there is no mediation in the model.
Nevertheless, this result is contradictory with the antecedent’s results which argued that there is significant relationship between intensity of marketing activities towards brand equity through brand awareness by Rajh (2005) Donthu, Lee, & Yoo (2000) and Villarejo-Ramos, Rondan-Cataluna, & Sanchez-Franco (2008). If it is observed from the three selected brands that are being analyzed in this research which are BreadTalk, Holland Bakery, and Sari Roti, those brands are actually rare in
giving advertisement for the customer; therefore from the questionnaire, many respondents were choosing lower mark for advertisement intensity (refer to Appendix B). Thus, in conclusion, the effort of intensity of marketing activities done by bakery company is not affecting on brand awareness since the customer is not aware of those activities.
For the second relationship which is the impact of price towards brand equity through brand image, it can be seen in Table 4 that the result of t test indicates a significant impact from price towards brand equity with significant value of 0.000. Table 5 shows the relationship of price towards brand image. It is resulting that price has significant impact towards brand image with significant value of 0.000. However in Table 6 it shows insignificant value of t test with the value of t is 0.708 and significant value of 0.480 from price towards brand equity when mediator variable brand image is added inside the model. Table 6 also shows the relationship between brand image and brand equity. The outcome is showing that there is significant relationship of brand image towards brand equity with significant value of 0.000. These results however are supported by the result of mediation test of sobel with calculated Z value of 3.974. Therefore it can be said that brand image can be a significant mediator in this model. Because price is significant towards brand equity, price is significant towards brand image, and brand image is significant towards brand equity. From Table 6 also can be known that there is insignificant relationship of price towards brand equity when there is brand image inputted as the independent variable. Thus it can be concluded that there is full mediation inside the model which means that in order for price to be able to impacting brand equity significantly, it has to go through brand image first.
The result of this model is supporting previous researches’ outcome from Donthu, Lee, & Yoo (2000) and Kabadayi, Aygun, & Cipli (2007) that were saying that price has significant impact towards brand equity and from Rajh (2005) that was saying that there price has significant impact towards brand equity mediated by brand image. Thus it can be concluded that the higher the price of bakery products set by the Company the higher the brand image which will make brand equity of the Company become higher as well.
348
above. Thus because there is no significant impact from intensity of marketing activities towards brand image, it can be said that brand image cannot be a significant mediator in the model.This result, however, is contradictory with the other previous results that have been obtained by the antecedents researchers like Donthu, Lee, & Yoo (2000) and Kabadayi, Aygun, & Cipli (2007) that said that intensity of marketing activities such as advertisement and distribution intensity gives positive significant effect towards brand equity, Villarejo-Ramos, Rondan-Cataluna, & Sanchez-Franco (2008) that were saying that advertising intensity gives positive image towards brand image, and Rajh (2005) who was saying that intensity of marketing activities gives significant positive effect towards brand equity mediated by brand image. This can be explained because bakery companies in Indonesia are rare in giving any advertisement, thus the data obtained gives a low score for variable of intensity of marketing activities.
The fourth relationship inside the model is the impact of store image towards brand equity through brand image. T test that have been conducted to test whether there is significant impact from store image towards brand equity can be seen in Table 4 and Table 6 which is saying that with significant value of 0.000 and 0.009 respectively, store image is affecting brand equity significantly. Store image also has significant impact towards brand image shown in Table 5 with significant value of 0.000. In Table 6, brand image also significantly affecting brand equity with significant value of 0.000. Beside the results of t test are fulfilling the three criteria stated earlier., these outcomes are also strengthened by the result shown sobel test which resulting Z value of 3.811 which is higher than the standard value of 1.96. Because there are significant impact from store image to brand equity, store image to brand image, and brand image to brand equity, and significant impact of store image towards brand equity when brand image is inputted as the independent variable (in Table 6), thus it can be concluded that there is partial mediation inside the model which means store image can affecting brand equity through brand image, however store image itself can significantly impacting brand equity alone.
This result is also supporting previous outcomes from the other researchers such as from Villarejo-Ramos, Rondan-Cataluna, & Sanchez-Franco (2008) that were saying that store image has positive impact towards brand image, from Donthu, Lee, & Yoo (2000) that were saying that store image has significant impact towards brand equity, and from Subekti (2010) that was saying that brand image gives significant impact towards brand equity. Therefore it can be concluded that when Company tries to increase its store image, its brand image will be increased as well which will boost its brand equity.
The fifth relationship inside the model is the impact of price deals towards brand equity through brand image. Price deals, as seen in Table 4 and Table 6 give significant positive effect towards brand equity with t value of 2.447 and 2.652 and significant value of 0.016 and 0.009 respectively. Even though shown in Table 6 that brand
image also gives positive impact towards brand equity, price deals however do not give significant impact towards brand image which is shown in Table 5 with significant value of 0.896. As known from the explanation in sobel test above that this model is not fulfilling the criteria stated above, thus mediation analysis is not being done here. Because of there is no significant impact from price deals toward brand image, thus it can be concluded that brand image cannot be the mediator in this model.
Nevertheless, different with the other antecedent researchers that were saying that price deals give negative or no impact to brand equity such as Rajh (2005), Donthu, Lee, & Yoo (2000), and Kabadayi, Aygun, &Cipli (2007), this study found that price deals give positive significant impact towards brand equity. This might be caused by the difference in attitude of people that are filling the questionnaires. As explained in Chapter 2 that these days, bakery product is shifting into necessity product in which more people in Indonesia consume bakery product as their main course, therefore when there is price reduction in necessity product, people do not regard it as a negative value.
CONCLUSION
Looking from the discussion before it is known that in the proposed model of the impact of intensity of marketing activities towards brand equity through brand awareness, there is no mediation since there is a significant impact from intensity of marketing activities towards brand equity, but there is no significant impact from intensity of marketing activities towards brand awareness and no significant impact from brand awareness towards brand equity. On the other hand, as tested in the previous discussion using t test, there are several outcomes that can be withdrawn from the second mediation which is brand image such as price, store image, and price deals have significant impacts toward brand equity, price and store image have significant impacts toward brand image, and last but not least brand image has significant impact towards brand equity. Therefore some conclusions can be withdrawn which are there is full mediation in the model of the impact of price towards brand equity through brand image and partial mediation in the model of the impact of store image towards brand equity through brand image. Whereas on the other hand, there is no significant mediation model inside the model of the impact of intensity of marketing activities towards brand equity through brand image and the impact of price deals toward brand equity through brand image.
349
limitation would be the limited number of independent variable and mediation variable since this research is only analyzing limited independent variables which are price, intensity of marketing activities, store image, and price deals, and having very limited mediation variables to be tested which are brand awareness and brand image. Surely those variables are not explaining brand equity as a whole since if it seen from the adjusted R2 of the data, the variables are not explaining brand equity 100%. Thus as the suggestion, further research would be better to involve more independent and mediation variables. Some variables from them that might be added in the model to advancing this model are brand accessibility and family factor as independent variable from Taleghani & Almasi (2011), and brand loyalty and perceived quality as the mediators from Donthu, Lee, & Yoo (2000).REFERENCES
Aaker, D. (1996). Building Strong Brands. New York: The Free Press.
Brooks, G. P., & Barcikowski, R. S. (2012). The PEAR Method for Sample Sizes in Multiple Linear Regression. Multiple Linear Regression Viewpoints, 1-16.
Chattopadhyay, T., Shivani, S., & Krishnan, M. (2010). Marketing Mix Elements Influencing Brand Equity and Brand Choice. Vikalpa, 67-84.
Cooper, D. R., & Schindler, P. S. (2014). Business Research Methods. New York: McGraw-Hill. Dib, H., & Alhaddad, A. (2014). The Hierarchical
Relationship Between Brand Equity Dimensions. European Scientific Journal, 183-194.
Donthu, N., Lee, S., & Yoo, B. (2000). An Examination of Selected Marketing Mix Elements and Brand Equity. Academy of Marketing Science, 195-211.
Durrani, B. A., Godil, D. I., Baig, M. U., & Sajid, S. (2015). Impact of Brand Image on Buying BehaviourAmong Teenagers. European Scientific Journal, 155-165.
Ernst & Young. (n.d.). Retrieved March 06, 2015, from EY Building a better working world: http://www.ey.com/GL/en/Issues/Driving- growth/Hot-growth-markets-in-the-spotlight--Indonesia-Whats-the-story-
Field, A. (2009). Discovering Statistics Using SPSS.
London: SAGE.
Garson, G. (2012). Testing Statistical Assumptions.
Asheboro: Statistical Associates Publishing. Ghozali, I. (2013). Aplikasi Analisis Multivariate
Dengan Program SPSS 21. Semarang: Badan Penerbit Universitas Diponegoro.
Ing, L. (2013, February 4). The Jakarta Post. Retrieved February 25, 2014, from http://www.thejakartapost.com
Investopedia. (n.d.). Retrieved March 28, 2015, from Investopedia:
http://www.investopedia.com/terms/p/predictiv e-analytics.asp
Kabadayi, E. T., Aygun, I., & Cipli, C. (2007). The Effects of Marketing Mix Strategies on Brand Equity: Mobile Phone Sector. Journal of Global Strategic Management, 74-81.
Lee, G. C., & Y.L., C. F. (2011). Customer Based Brand Equity: A Literature Review. Journal of Arts Science & Commerce, 33-42.
Lee, H. M., Lee, C. C., & Wu, C. C. (2011). Brand Image Strategy Affects Brand Equity after M&A. European Journal Marketing, 1091-1111.
Nezami, P. (2013). The Reviewing the Impact of Marketing Mix on Brand Equity (Case Study: ETKA Stores). Journal of Novel Applied Science, 517-521.
Putri, M. B. (2010, April 14). Analisis Anteseden Brand Equity Merek Teh Gardoe. Surakarta, Indonesia: Fakultas Ekonomi Universitas Sebelas Maret Surakarta.
Rajh, E. (2005). The Effects of Marketing Mix Elements on Brand Equity. Economic Trends and Economic Policy, 30-59.
Render, B., Stair, R. M., & Hanna, M. E. (2012).
Quantitative Analysis for Management.
Harlow: Pearson Education Limited.
Sasikala, D. (2013). Brand Asset Valuator - Measuring Brand Value. International Journal of Social Science & Interdisciplinary Research, 133-138.
Shocker, A., Srivastava, R., & Ruekert, R. (1994). Challenges and Opportunities facing Brand Management: An Introduction to the Special Issue. Marketing Research, 149-158.
Srivastava, R., & Shocker, A. (1991). Brand Equity: A Perspective on Its Meaning and Measurement. Marketing Science Institute Working Paper Series, 91-124.
Subekti, A. Y. (2010, April 20). Analisis Pengaruh Citra Merek dan Kesadaran Merek Terhadap Ekuitas Merek Susu Cair dalam Kemasan "Indomilk". Semarang, East Java, Indonesia: Universitas Diponegoro.
Sumarwan, U. (2013, November). Ekuitas Merek Bakery. Bakery Magazine. Indonesia.
Superbrands. (2013). Retrieved March 13, 2015, from Superbrands Indonesia's Choice 2013: http://superbrands.co.id/2013/food.html Taleghani, M., & Almasi, M. (2011). Evaluate the
Factors Affecting Brand Equity from the Perspective of Customer Using Aaker's Model.
Kuwait Chapter of Arabian Journal of Business Management Review, 64-76.
350
Touminen, P. (1999). Managing Brand Equity.65-100.
Villarejo-Ramos, A. F., Rondan-Cataluna, F. J., & Sanchez-Franco, M. J. (2008). Direct and Indirect Effects of Marketing Effort on Brand Awareness and Brand Image. Retrieved from http://www.escp-eap.net
Worldometers. (n.d.). Retrieved May 23, 2015, from
http://www.worldometers.info/world-population/indonesia-population/
Yoo, B., & Donthu, N. (2001). Developing and Validating a Multidimensional Consumer-Based Brand Equity Scale. Journal of Business Research, 1-14.
Yoo, B., & Donthu, N. (2001). Developing and Validating a Multinational Consumer-Based Brand Equity Scale. Business Research, 1-14. Yoo, B., Donthu, N., & Lee, S. (2000). An
Examination of Selected Marketing Mix Elements and Brand Equity. Academy of Marketing Science, 195-211.
Young & Rubicam. (n.d.). Retrieved from Y&R: http://www.yr.com/BAV
Yulisman, L. (2014, October 24). The Jakarta Post. Retrieved February 20, 2015, from http://www.thejakartapost.com
Zikmund, W. G., Babin, B. J., Carr, J. C., & Griffin, M. (2013). Business Research Methods.