29
Analyzing the Impact of Brand Equity towards Purchase Intention in Automotive
Industry: A Case Study of ABC in Surabaya
Cynthia Ratna Santoso, Tabita Ella Cahyadi
International Business Management Program, Petra Christian University Jl. Siwalankerto 121-131, Surabaya
E-mail: [email protected], [email protected]
ABSTRACT
The rapid growth in Indonesia’s automotive industry makes it becomes a lucrative market for automaker companies. Of all Japanese car brands in Indonesia, ABC and XYZ are considered the biggest rivals. Hence, strong brand equity should be built, not only for distinguishing themselves from competitors, but also for stimulating consumers’ purchase intention. Consequently, this research aims to analyze the impact of brand equity towards purchase intention in automobile industry. This research uses Aaker’s brand equity theory, covering brand awareness, brand association, perceived quality, and brand loyalty.In this research, the writers use simple random sampling in which the population is Surabaya people who own or used to own both ABC and XYZ cars. 125 samples collected from the research are analyzed using Multiple Linear Regression Analysis and comparative analysis. The result shows that brand equity simultaneously has a significant influence towards purchase intention while only brand association and brand loyalty individually have a significant influence towards purchase intention. According to comparative analysis, ABC has a better brand association than XYZ, but it has lower brand loyalty than XYZ.
Keywords: brand equity, purchase intention, automobile, Surabaya
ABSTRAK
Pesatnya pertumbuhan industri otomobil di Indonesia menjadikan Indonesia sebagai pasar yang menguntungkan untuk perusahaan mobil. Di antara banyaknya merek mobil di Indonesia, merek mobil asal Jepang ABC dan XYZ merupakan dua merek mobil terbesar yang bersaing ketat. Oleh karena itu, ekuitas merek yang kuat sebaiknya dibangun, tak hanya untuk membedakan satu sama lain namun juga untuk mempengaruhi minat beli masyarakat. Alhasil, penulis ingin menganalisa dampak ekuitas merek terhadap mina t beli di industri otomobil. Penelitian ini menggunakan ekuitas merek menurut teori Aaker, mencakup kesadaran merek, asosiasi merek, persepsi kualitas, dan loyalitas merek. Di penelitian ini, penulis menggunakan simple random sampling dimana populasinya adalah orang Surabaya yang memiliki atau pernah memiliki mobil ABC dan XYZ. 125 sampel yang didapatkan dalam penelitian dianalisa menggunakan analisa regresi berganda serta analisa perbandingan. Hasil penelitian ini menunjukkan bahwa secara keseluruhan ekuitas merek berpengaruh terhadap minat beli tetapi hanya asosiasi merek dan loyalitas merek yang secara individual berpengaruh terhadap minat beli. Selain itu, ABC mempunyai asosiasi merek lebih baik daripada XYZ, namun memiliki loyalitas merek yang kurang daripada XYZ.
Kata Kunci:ekuitas merek, minat beli, otomobil, Surabaya
INTRODUCTION
Indonesia has a very prospective market in the automative industry, making it as the second largest automotive market in ASEAN (Gaikindo, 2014).Based
30 As there are more than 30 brands in the automotive industry in Indonesia, consumers have a higher degree of freedom and wider variety of choices for brands, which suit them the most. Hence, companies should build a strong brand in order to distinguish themselves in the tight competition. Campbell (2002) stated that brand equity is the added values, which have been gained by the effort of creating a strong brand. Meaning, one way a company can be distinguished is by having strong brand equity. Looking at the importance of brand equity to help companies acknowledge their position in the consumers’ perceptions and win the tight competition in the industry, the writers would like to observe and analyze the importance of brand equity to purchase intention in the automotive industry, using a case study of ABC in Surabaya. Moreover, the writers will also compare the most influence element(s) of brand equity towards purchase intention in the automotive industry between the company and its closest competitor, XYZ.
LITERATURE REVIEW
Brand Equity
Although there are various definitions with different views of brand equity, all researchers mostly agree with the term “added value”. Aaker (1991; 2009) believed that “brand equity is a set of brand assets and liabilities linked to a brand; its name and symbol, which add to or subtract from the value provided by a product or service to a firm and/or to that firm’s customers”. It means that brand equity is the added value that bonds with consumers.
Brand equity generates value for the company and the consumers. It creates value to the consumers by giving information to consumers, giving confidence in making decision, reinforcing buying, and contributing to self-esteem, such as confidence in using the brands. Brand equity gives value to companies by increasing marketing efficiency and effectiveness, creating brand loyalty, increasing profit margins and winning over the competition (Bagozzi, 1998).
According to Aaker (1991; 2009), brand equity could be evaluated from brand loyalty, brand awareness, perceived quality, brand associations and other proprietary brand assets. Aaker categorized brand equity into two groups, which are consumer-based brand equity, consisting of the first four elements, and the second group is the other proprietary assets, such as patents, trademarks and channel relationships.
This paper focuses on consumer-based brand equity, which consists of brand awareness, brand association, perceived quality and brand loyalty.
Brand Awareness
Brand awareness relates to how strong a brand is in the memory of consumers (Aaker, 1991; 2009). Based on Kim and Kim (2004) brand awareness is the ability of a brand to appear in consumers mind when they are thinking about a category of a product. Brondoni (2001) believed that brand awareness becomes a crucial point of difference between a certain brand and its competitors.
Ukpebor and Ipogah (2008) believe that brand awareness can be determined as the degree of consumer’s familiarity towards a brand that can be measured through brand recognition, brand recall, and top of mind. Brand recognition is defined as consumers’ ability to remember a certain brand with the help of something or someone to remember it, such as logo, slogan, tagline, advertising and packaging which often called as aided recall. The purpose of brand recognition is to reassure the brand and help the brand to be recognized by other people.
Brand recall is defined when consumers can easily retrieve the brand of a category from their mind without any help or clue (unaided recall). The purpose of brand recall is to position the brand in consumers’ minds.
Finally, top of mind is defined as the first brand that appears in consumers’ minds when they think about a product/service category, as they know and familiar about the brand. The purpose of top of mind is to position the brand to be the first brand in consumers’ mind.
Brand Association
According to Aaker (1991; 2009), brand association is something in consumers’ minds or memories that connect to the brand including product attributes, consumers’ benefits, uses, life-styles, product classes, competitors and countries of origins. Brand associations can provide a point-of-different, purchase reasons, positive attitudes and feelings which may influence purchase behavior and satisfaction, reduce reasons to shift to other brands, and provide basis for brand loyalty (Aaker, 1991; Tuominen, 1999). Brand associations can be categorized into three types which are attributes, benefits and attitudes.
31 refers to the type of consumers use the brands. Usage imaginary refers to the ideas or type of situations in which the brand is used (Condor.depa ul.edu, n.d.). Packaging information refers to information of the products in the packaging.
The second types of brand associations are brand benefits, meaning the associations of the brand is linked with the benefit of the brand itself which makes consumers attached to the brand. Benefits can be categorized into three types, functional benefits, experiential benefits, and symbolic benefits. Functional benefits are related with fairly basic motivations like safety needs or avoidance. Experiential benefits are related to how consumers feel when the products or services are being used. Symbolic benefits are the extrinsic benefits of products or service usage which are related to the needs for social approval or personal expression such as prestige and exclusivity (Keller, 1993; Keller, 1998)
The last type and the most abstract types of brand associations is brand attitudes, which are consumers’ complete evaluations of a brand. Brand attitudes provide the basis for consumers’ action and behavior related to the brand depending on the attributes and benefits of the brand itself (Keller, 1993; Keller, 1998).
Perceived Quality
Lee (2011) stated that perceived quality was the consumers’ judgments and perceptions on overall excellence or superiority of a product or service compared to others. Lee also believed that consumers face difficulties in assessing the correct judgment about a product; thus, perceived quality is formed to judge the overall quality of a product. Perceived quality enables a brand to provide purchase reasons for their consumers and create a strong aspect to differentiate and position its product or service. Perceived quality is useful for the companies as it enables the brand to charge a premium price, attract new consumers, and allow brand extensions (Aaker, 1991; 2009).
According to David A. Garvin (in Vantamay, 2007), there are seven dimensions of perceived quality, which areperformance (the primary functioning characteristics of the product), features (the secondary elements of products giving additional function to the product), conformance with specifications (zero defect of the products), reliability (the steadiness of performance in every transaction), durability (how durable the product is), serviceability (how good the services are being provided to the consumers), and fit and finish (how consumers feel and judge the quality of the products or services given).
Brand Loyalty
Aaker (1991) defined brand loyalty as a measurement of how consumers’ bond to a brand. Brand loyalty reflects whether consumers will change to other brand due to changing of prices or features. According to Sadat (2009), brand loyalty relates to consumers’ strong commitments to subscribe or purchase the same brand again in the future. It affects consumers’ vulnerability to shift its competitors. A consumer is considered loyal to a brand when they do not easily shift a brand to another, even when the brand is not available in the store (Jalilvand, Samiei & Mahdavinia, 2011). Brand loyalty can also be shown by spreading the positive words and recommendation (2012 Brand Loyalty Survey, 2012). Brand loyalty is essential as it provides the basis and motivation for consumers to buy the brand again in the future (Ahmed & Moosavi, 2013). Kotler and Keller (2006) measure brand loyalty through repeat purchase (consumers’ loyalty towards a certain brand), retention (consumers’ resistance towards the brand), and referrals (consumers’ willingness to recommend the brand). Jalilvand, Samiei and Mahdavinia (2011) measures through consumers’ first choice, preference, and unwillingness to shift to other brands. Agusli and Sondang (2013) measure through positive wording, recommendation, and repeated usage towards a brand.
Keller (1998) believed that loyalty is attached to consumer behavior to repurchase the brand as their first choice. Hence, it can be said that a brand should be able to become consumers’ primary choice so that consumers will repurchase the product. By having a brand loyalty, company can cut marketing costand increase the number of purchase.
Purchase Intention
According to Howard (1991, p. 41), purchase intention is closely related to consumers’ plans in making actual purchase in certain period of time. Purchase intention also can be described as the urge or motivation arising from consumers’ minds to purchase a certain brand after they evaluate it, before deciding to make any purchase based on their needs, attitudes, and perceptions towards the brands (Mc Carthy, 2002, p.298; Durianto & Liana, 2004, p. 44; Madahi & Sukati, 2012).
32 attributes since they have experienced the product and have complete product knowledge about the product. If the product suits them, they will purchase it again in the future.
Purchase intention includes two perspectives, from new consumers and from current consumers. Purchase intention from new consumers is used to form brand choices and know consumers behavior (Rizwan et al., n.d.). Purchase intention from current buyers is more to predict consumers’ satisfaction and future sales once the consumers find out that the brands suits them and worth buying (Madahi & Sukati, 2012). This research focuses in observing purchase intention on future sales of current consumers.
According to Hosein (2012), consumers purchase intention can be measured by using interest, attending, and information. Interest is consumers’ feelings towards a brand that influences them to purchase. Attending is the attendance of consumers in exhibitions and other supporting events that influence them to purchase. Information is any additional knowledge and facts about the brand gathered by the consumers and make them consider to purchase it.
Relationship Between Concepts
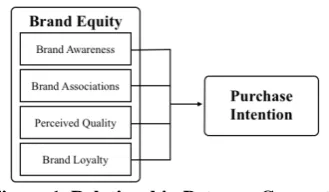
Many empirical studies have indicated that brand equity has an impact towards the purchase intention (Ashill & Sinha, 2004; Chang & Lie, 2009). Aaker (1991; 2009) also stated that brand equity has a positive impact towards the consumers purchase intention. According to Aaker (1991; 2009) and Keller (1993; 2003), brand equity’s elements (e.g. brand awareness, brand associations, perceived quality, brand loyalty) influence the consumers purchase intention.
Brand awareness plays an important role in consumers purchase intention as it can increase the familiarity of consumers towards the brand, which can then lead to possible purchase. Brand associations affect the basis for purchase intention towards a brand as it helps consumers to obtain information, distinguish the brand, generates reasons to purchase, and creates positive values/attitudes to the firms and their consumers. Similarly, perceived quality also provides values to consumers as it can be the point of differentiation and reason to purchase. Finally, brand loyalty will make consumers attached to the brand. Consumers do not only repeat buying but also make them invulnerable to any brand changes such as change of price or product features.
All these four dimensions are the construct of the brand equity. Therefore, brand equity will also significantly influence purchase intention depending on the four dimensions (Jalilvand, Samiei & Mahdavinia, 2011).
Figure 1. Relationship Between Concepts
The writers has developed two hypotheses, which are:
ABC’s brand equity simultaneously has a significant influence towards purchase intention
ABC’s brand equity individually has a significant influence toward purchase intention
RESEARCH METHOD
This research aims to analyze the impacts of brand equity elements towards purchase intention in the case of ABC in Surabaya. Therefore, The writers use both descriptive and causal studies as their research methods. The writers apply descriptive study for profiling respondents’ data and causal studies for answering the research questions regarding the impacts of brand equity towards purchase intention. The two hypotheses that have been developed are also part of causal study.
The dependent variable in this research is purchase intention, which can be evaluated from these statements:
Because I am interested in ABC (XYZ) car, I will buy it in the future
If I want to buy a car in the future, I will come to ABC (XYZ) showroom
If I want to buy a car, I will gather information about ABC (XYZ)
In this research, the independent variable is the elements of brand quity which are brand awareness, brand association, percived quality, and brand loyalty.
Below are the items to measure brand awareness. I have ever heard about ABC (XYZ) I know how ABC (XYZ) cars look like When talking about automobiles, I can
remember ABC (XYZ)
When talking about automobiles, ABC (XYZ) becomes my top of mind
Below are the items to measure brand association. ABC (XYZ) cars’ features fulfill my needs ABC (XYZ) car is worth buying
I think ABC (XYZ) car is only for medium up class people
I can use ABC (XYZ)as my daily car ABC (XYZ) provides technology in terms
33 When I drive ABC (XYZ) car, it makes me
feel comfortable
Driving ABC (XYZ) car gives me high prestige
I am interested in ABC (XYZ) car because of its features
Below are the items to measure to measure perceived quality.
ABC (XYZ) cars have excellent performances
Cars from ABC (XYZ) have excellent features
The specifications of ABC (XYZ) cars match with the promised ones
ABC (XYZ) always gives perfect and qualified cars in the transaction
ABC (XYZ) cars are durable
ABC (XYZ) sales promotion staff provide excellent services towards their consumers Overall, I am satisfied with the car that I
received from ABC (XYZ) Below are the items to measure brand loyalty.
I can easily replace ABC (XYZ) with another brand
When the ABC (XYZ) car that I want is not available, I will buy a car of another brand
I buy ABC (XYZ) car because its dealers are everywhere
Since I get a lot of benefits from ABC (XYZ) car, I will purchase ABC (XYZ) car again
I will recommend ABC (XYZ) cars to other people
In this research, the writers used nominal and ordinal data. Nominal data are used for the classification quetions of the respondents such as gender, grouping of job positions, living area, ABC’s main competitor, and ABC and XYZ cars that respondents have or had. While for the ordinal data are used for age group and income group. As for the main questionnaires, the writers use Likert-scale as their rating scales, starting from strongly disagree up to strongly agree in each statement.
The population in this study is represented by people who own or used to own both ABC and XYZ cars in Surabaya. The population is chosen as this research aims to identify the brand equity of ABC towards XYZ, their biggest rival. Thus, the target respondents or samples are those among the population. In doing this research, the writers use simple random sampling from probability sampling. The writers try to be as random as possible in choosing the sample by distributing questionnaires in all areas in Surabaya. The writers distribute questionnaires to those who attend or come to ABC’s exhibition at shopping malls and ABC’s main dealers. Moreover, the writers also distribute questionnaires to
shopping malls and random places, such as churches and universities.
Ghozali (p. 52, 2013) mentioned that validity is useful in measuring how valid a questionnaire used in a test. Validity can be measured by comparing the value of r calculated from the questionnaire results (r-data) with the r-value in the table (r-table). The r-table can be seen from the 2-tailed table with degree of freedom (df)= n-2, n as the number of samples. In SPSS, the r-data can be seen in Cronbach Alpha, located in Correlated Item – Total Correlation column. If the r-data is higher than r-table and the value is positive, then the indcators of a variable can be said as valid.
According to Cooper & Schindler (2011), reliability is concerned with the estimation of degrees to which a measurement is free of random or unstable error. According to Ghozali (2013), measuring reliability can be calculated by using Cronbach Alpha in SPSS. The Cronbach’s Alpha value ranges from 0 to 1. The closer the value to 1, the higher the internal consistency reliability. The indicators can be said reliable to represent the variable if the Cronbach Alpha is higher than 0.7 (Ghozali, 2013). This research applies the one-shot measure using the Cronbach Alpha in measuring the reliability.
Since the objective of this research is to analyze the relationship between the elements of brand equity towards purchase intention, the writers used multiple linear regression analysis, with this equation in figure 2:
In the multiple regression analysis, the writers focused on the result of Adjusted R2, F-test and t-test.
34 The F-test basically shows whether all independent variables used in the regression model simultaneously have impacts toward dependent variable (Ghozali, 2013). This research used 95% confidence level in which the significance level is 5%. In this research, the hypothesis that will be tested using the F-test is shown below:
H0. β1 = β2 = … = βk = 0 H1. β1 ≠ β2 ≠ … ≠ βk ≠ 0
According to Ghozali (2013), testing the hypothesis can be done by comparing the significance f to significance level (α) or comparing the F value to F table. If the significance f is less than 0.05 significance level or F value is higher than F table, H0 should be rejected, which indicates that the independent variables simultaneously influence the dependent variable.
The t-test shows how far the influence of the independent variables individually explains the dependent variable (Ghozali, 2013). In this research, the hypothesis that will be tested using the t-test is shown below:
H0. βk = 0 H1. βk ≠ 0
According to Ghozali (2013), testing the hypothesis can be done by comparing the significance t to significance level (α) or comparing t-test statistic to t-table (t-critical value). If the significance t is less than 0.05 or t-test statistic value is greater or lower than ± t-table, H1 is accepted. It indicates that the independent variables individually have an influence towards the dependent variable.
RESULTS AND DISCUSSION
Table 1. Validity Statistic of Brand Awareness
Correlated Item - Total Correlation
AW1 0.502
AW2 0.505
AW3 0.670
AW4 0.591
Table 2. Validity Statistic of Brand Association
Correlated Item - Total Correlation
AS1 0.662
AS2 0.634
AS3 0.269
AS4 0.456
AS5 0.600
AS6 0.723
AS7 0.684
AS8 0.659
Table 3. Validity Statistic of Perceived Quality
Correlated Item - Total Correlation
PQ1 0.706
PQ2 0.691
PQ3 0.678
PQ4 0.658
PQ5 0.550
PQ6 0.511
PQ7 0.674
Table 4. Validity Statistic of Brand Loyalty
Correlated Item - Total Correlation
BL1 0.444
BL2 0.571
BL3 0.238
BL4 0.558
BL5 0.551
Table 5. Validity Statistic of Purchase Intention
Correlated Item - Total Correlation
PI1 0.653
PI2 0.684
PI3 0.651
According to Ghozali (2013), validity test can be conducted by comparing the value of r calculated from the questionnaire results (r-data) with the r-value in the table (r-table). This research uses 125 samples, thus r-table used is 0.1757. From table 1 until table 5, it can be seen that all the Correlated Item – Total Correlation (r-data) are higher than 0.1757 (r-table), indicating that all the indicators used to explain brand awareness, brand association, perceived quality, brand loyalty, and purchase intention are valid.
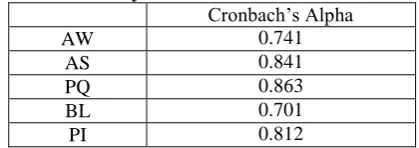
Table 6. Reliability Statistic
Cronbach’s Alpha
AW 0.741
AS 0.841
PQ 0.863
BL 0.701
PI 0.812
According to Ghozali (2013), the indicators are considered reliable to represent the variables when the value of Cronbach’s Alpha is higher than 0.7. Table 6 indicates that all Cronbachs’ Alpha are higher than 0.7, indicating that all indicators are reliable to represent the variables.
Table 7. ANOVA Table
F Sig.
Regression 23.355 .000
35 table 7 is 23.355, which is way higher than F table (2.6795). Therefore, it can be implied that H0 is rejected, indicating that there is a simultaneous influence of the independent variables (the elements of brand equity) toward the dependent variable (purchase intention).
The result of this research shows brand equity simulataneously has an influence towards purchase intention, which is inline with the previous relevant research (Jalilvand, Samiei & Mahdavinia, 2011; Agusli & Sondang, 2013; Astuti & Kurnianto, 2013).
Table 8. Regression Coefficient Table
Model
Standardized Coefficients
t Sig.
(Constant) 1.639 .104
avg_ABC_aw .038 .495 .621
avg_ABC_as .294 2.608 .010
avg_ABC_pq .191 1.829 .070
avg_ABC_bl .263 3.113 .002
Table 8 shows whether the independent variables individually have an influence toward the dependent variable. According to t-test, individual variable (e.g. brand awareness, brand association, perceived quality, and brand loyalty) has a significant influence toward the dependent variable (purchase intention) when the significant t is less than significance level (0.05) and test statistic value is greater than or lower than ± t-table (± 1.979).
As shown in table 8, only brand association and brand loyalty that significantly influence purchase intention as the t-critical values is greater than 1.979 and significance t is lower than 0.05. Hence, it can be concluded that only brand association and brand loyalty that are confirmed to individually have a significant influence towards purchase intention of ABC, while brand awareness and perceived quality are confirmed not to have a significant influence toward purchase intention of ABC.
However, this research shows some differences compared to the previous relevant research. Both Jalilvand, Samiei, and Mahdavinia (2011) and Astuti and Kurnianto (2013) indicate that all elements of brand equity individually has a significant influence on purchase intention, while this research indicates that only brand association and brand loyalty individually influence purchase intention. This difference may occur because of different countries and different industries. According to Jalilvand, Samiei, and Mahdavinia (2011), “further quantitative research is needed to identify the determinants of brand equity using cross-country applications to predict purchase behavior in various contexts”. It means their research might have different results from other research due to different countries and different industries. Moreover, different country will have different culture that may lead to different
consumers’ buying behavior (Bhasin, 2014). The result of brand association and brand loyalty which individually influence purchase intention is similar to previous relevant research (Jalilvand, Samiei & Mahdavinia, 2011; Agusli & Sondang, 2013; Astuti &Kurnianto, 2013).
The result of this research shows that brand association and brand loyalty have a significant influence on purchase intention. According to Chatterjee (2012), car brand is considered as one of status symbols in Indonesia. Indonesian people care about how others see them and concern their prestige when they purchase a car. As a result, prestige is perceived as an important factor in purchasing a car. As prestige is one of the indicators in brand association, this finding supports the result of this research result in which brand association has a significant influence on purchase intention.
Brand loyalty is also proven significantly to influence purchase intention.In the automobile industry, Indonesian consumers can be categorized loyal to a brand, especially when they already trust and like the brand (BMW: Indonesia Lebih Setia Daripada Cina, 2013).
In contrast to brand association and brand loyalty that significantly influence purchase intention, brand awareness and perceived quality are shown insignificant in influencing purchase intention. The result of this research shows that brand awareness does not have any significant influence towards purchase intention. As indicated by Lenskold (2011) and Gordon (2014), there is a chance thatbrand awareness individually does not influence purchase intention and drive sales, though it is still believed to take significant part together with other elements to drive purchase intention. According to Gordon (2014), being aware of a brand may not drive purchase intention if it is not combined with its unique characteristics that differentiate the brand with other brands.
Perceived quality is confirmed does not have any significant influence towards purchase intention in this research. The possible reason behind this result may be because most Indonesian consumers do not have a lot of knowledge of cars. A research of J.D. Power Asia Pasific in 2011, 50% of Indonesian consumers do not have enough knowledge of the technology and features used in a car (Akib, 2011). Thus, it can be seen that perceived quality does not have a significant influence towards car purchase intention in Indonesia.
Table 9. Adjusted R Squarre Test
R R Square Adjusted R Square
Std. Error of the Estimate
36 Table 9 shows how well the regression model explains about the variation of dependent variable. The higher the value of adjusted R2, the better the independent variables in explaining the dependent variable.
Based on table 9, it can be seen that the adjusted R Square is 0.419. This indicates that 41.9% of the variance in purchase intention of ABC cars can be explained by the variance of the elements of brand equity (e.g. brand awareness, brand association, perceived quality, and brand loyalty), taking into account the sample size and independent variables.
Besides, this also indicates that there are 58.1% other factors that cannot be explained in this research but have significant impacts towards purchase intention in the automobile industry.
Internet holds such a crucial role in giving information to consumers when they want to buy cars. According to research conducted by Netpop and Google, 96% of prospective buyers in Indonesia will seek information through online research before they go to the car dealers (Saputra, 2013; Mangalandum, 2013). The research also found out that 44% chance that prospective buyers shift to other car brands after they receive information from the internet (Saputra, 2013; Mangalandum, 2013). Hence, based on the research, it can be implied that internet plays an important role in influencing car purchase intention as it provides information, testimonials, photos, and videos.
Another factor might come from promotions and credit installment. Promotions, such as free annual service, free body paint, and other services are provided in order to boost the purchase intention of consumers. Besides providing free services, ease in the transaction such as providing light installment and low down payment (dp) is also done (Kurniawan, 2013). According to Davy Tuilan, Director of Marketing and Development PT. Suzuki Indomobil Sales (SIS), interest rate (BI-rate) plays an important role in purchase intention, especially in the automobile industry (Kurniawan, 2013). The higher the interest rate, the heavier consumers will bear the installment. Therefore, it can be implied that promotions and credit installment may influence car purchase intention.
The other factor that may have influence towards purchase intention is the car resale value. In Indonesia, people often buy second-hand cars as the price is lower and more negotiable (Serial Area Perdagangan: Nensy: Rejeki Manis Mobil Bekas, 2013). As the demand for second-hand cars in Indonesia is high, cars are often considered one of the forms of investment. Therefore, the writers believe that the resale value can influence car purchase intention.
Finally, another factor influencing purchase intention is the social factor, including reference groups and family. Reference group is defined as a
group/people whom an individual looks for the basis for self-behavior (Howkins & Mothersbaugh, p.227, 2010). Meanwhile, a family, consisting of parents, siblings, spouses, and children, have the biggest influence on consumer behavior (Kotler & Keller, 2012; Konecnik Ruzzier, Ruzzier & Hisrich (p. 102, 2014). Since purchasing a car is not the same as purchasing consumer goods, consumers are likely to use the opinion from the family and their reference groups as the basis for the purchase. Thus, the writers believe that the social factor, consisting of family and reference group, may have a significant influence on car purchase intention.
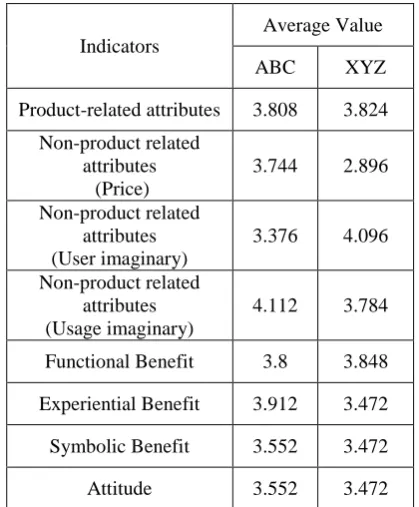
Furthermore, the writers would like to analyze and compare the elements of brand equity of ABC and XYZ. From the multiple regression analysis that has been done before, it can be concluded that there are two elements of brand equity of ABC that are significant, which are brand association and brand loyalty. XYZ plays as the benchmark of this research, the analysis below will focus on the significant elements of ABC’s brand equity. The writers compare the average value between ABC and XYZ in order to gain deep analysis about the competition.
Table 10. Summary of Average Value of ABC and XYZ
– Brand Association
Indicators
Average Value
ABC XYZ
Product-related attributes 3.808 3.824 Non-product related
attributes (Price)
3.744 2.896 Non-product related
attributes (User imaginary)
3.376 4.096 Non-product related
attributes (Usage imaginary)
4.112 3.784
Functional Benefit 3.8 3.848 Experiential Benefit 3.912 3.472 Symbolic Benefit 3.552 3.472
Attitude 3.552 3.472
Table 11. Summary of Average Value of ABC and XYZ
– Brand Loyalty
Indicators Average Value
ABC XYZ
Unwillingness to Shift to Other Brands
3.312 3.088 3.32 3.168
Preference 3.208 3.616
37 Based on the table 10 and table 11, it can be seen that in the brand association, ABC is behind XYZ in terms of product-related attributes, non-product attributes (user imaginary), and functional benefit while ABC wins over XYZ in terms of non-product attributes (price and usage imaginary), experiential benefit, symbolic benefit, and attitude. In terms of brand loyalty, all indicators for ABC are below XYZ, indicating that ABC lacks in providing loyalty program to its consumers. To sum up, ABC has a better brand association than XYZ, but it lacks in loyalty from the consumers.
CONCLUSION
The writers have gathered 138 questionnaires; however, only 125 questionnaires are valid and used for this research. The result of the reliability and validity test shows that all indicators used in representing the variables are reliable and valid. This research aims to determine whether ABC’s brand equity leads to purchase intention and to determine which element(s) of ABC’s brand equity have the biggest influence on purchase intention. Furthermore, the writers also conducted the comparative analysis between the significant element(s) of ABC and XYZ in order to gain deep analysis about the competition.
Based on the multiple regression test, brand equity (brand awareness, brand association, perceived quality, and brand loyalty) simultaneously has significant influence towards purchase intention. Moreover, it is found that only two out of four elements of brand equity individually have a significant influence towards purchase intention, namely brand association and brand loyalty whereas brand awareness and perceived quality do not have significant influence on purchase intention.
Finally, the differences of significant elements between ABC and XYZ can be found from the comparative analysis. The result of comparative analysis indicates that ABC has a better brand association than XYZ as the indicators of non-product attributes (price and usage imaginary), experiential benefit, symbolic benefit, and attitude are higher than XYZ. However, in terms of brand loyalty, ABC is below XYZ, proven by all indicators’ values of brand loyalty of ABC which are less than those of XYZ.
Realizing that this research is still far away from perfection, the writers noticed several limitations that should be noted while composing this research. The first limitation is limited respondents. The respondents in this research are limited to those who own or used to own both ABC and XYZ. Though the number of samples have already fulfilled the requirement (90 samples), the sample gathered in this
research may be too few to represent the actual perceptions of a car brand.
The second limitation is limited coverage area of the research. This research only covers Surabaya area where ABC Surabaya Center is located. However, ABC Surabaya Center also supervises some areas, such as East Java, Bali, and Lombok. Hence, the result and findings of this research may be applicable in Surabaya area only, while there may be difference results for other areas.
The third limitation is that the result and findings cannot be generalized. Though this research is conducted in the automobile industry, this research only compares two well-known car brands in Indonesia, namely ABC and XYZ. As a result, the result and findings of this research may not be generalized and applied for all car brands since the respondents involved limited to those who own or used to own both ABC and XYZ.
Finally, the last limitation is respondents’ honesty, memory, and reluctance. In gathering the respondents for this research, the writers have to find those who own or used to own both ABC and XYZ. However, the honesty of the respondents who say that they own or used to own both ABC and XYZ cannot be proven. Moreover, even though the respondents have honestly admited that they own or used to own both car brands, the respondents may forget or carelessly answer the questionnaires. The respondents might experience ABC and XYZ long time ago, thus they may forget about the cars, especially when they have sold it. Finally, even though the respondents remember the cars they own or used to own, they may be reluctant to fill out the questionnaires wholeheartedly. To sum up, the writers believe that respondents’ honesty, memory, and reluctance is one of the limitations in this research.
Realizing the limitations, the writers propose some suggestions that might be useful for conducting further researches. The first suggestion is to increase the number of respondents. Increasing the number of samples will lead to a better result, since it can represent the whole population. Not to mention more respondents will create a more accurate result. The second suggestion is to enlarge the area of the sample. Covering other areas beside Surabaya will also create a better result for the research that might be applicable not only in Surabaya, but also in other areas. By expanding the location for the research, it also will ease the further researchers to find more number of samples.
38 instance, the researchers should find people who own or ever owned ABC and XYZ cars within five years.
REFERENCES
2012 Brand Loyalty Survey. (2012) (1st ed). Atlanta.
Retrieved from
http://web.clickfox.com/rs/clickfox/images/cf-survey-results-brand-loyalty.pdf
Aaker, D. (1991). Managing brand equity. New York: Free Press.
Aaker, D. (2009). Managing Brand Equity. New York: Simon and Schuster.
Ahmed, S., & Moosavi, Z. (2013). Factors Influencing the Cell Phone Brand Loyalty of Swedish Generation Y.
Agusli, D. and Sondang, Y. (2013). Analisa Pengaruh Dimensi Ekuitas Merek Terhadap Minat Beli Konsumen Midtown Hotel Surabaya. Jurnal Strategi Pemasaran, 1(2), 1--8.
Akib, S. (2011). Membeli Mobil Pembelian Paling Mahal dalam Seumur Hidup. Oto.detik.com. Retrieved May 9, 2014, from http://oto.detik.com/
Ashill, N. J. and Sinha, A. (2004). An Exploratory Study into the Impact of Components of Brand Equity and Country of Origin Effects on Purchase Intention. Journal of Asia - Pacific Business, 5(3), 27.
Astuti, B., & Kurnianto, E. (2013). Analisis Pengaruh Komponen Pembentuk Ekuitas Merek Terhadap Minat Beli. Proceeding Seminar Nasional Dan Call For Papers Sancall 2013. Badan Pusat Statistik. (n.d.). Perkembangan Jumlah
Kendaraan Bermotor Menurut Jenis Tahun
1987-2012. Retrieved from:
http://bps.go.id/tab_sub/view.php?kat=2&tabe l=1&daftar=1&id_subyek=17¬ab=12 Bagozzi, R. (1998). Marketing management (1st ed.).
Upper Saddle River, N.J.: Prentice Hall. Bhasin, H. (2014). Factors affecting consumer buying
behavior. Marketing91.com. Retrieved May 7,
2014, from
http://www.marketing91.com/factors-affecting-consumer-buying-behavior/
Brondoni, S. M. (2001), “Brand Policy and Brand
Equity”, Emerging Issues in Management; pp.
5-25.
BMW: Indonesia Lebih Setia Dibanding Cina. (2013). Otosia.com. Retrieved May 13, 2014, from http://www.otosia.com
Campbell, M. C. (2002). Building brand equity. International Journal Of Medical Marketing, 2 (3), pp. 208--218.
Chang, H. H. and Liu, Y. M. (2009). The Impact of Brand Equity on Brand Preference and
Purchase Intentions in the Service Industries. The Service Industries Journal, 29(12), 1687. Chatterjee, N. (2012). Indonesians Flaunt
GrowingWealth on the Road. Nytimes.com. Retrieved May 9, 2014, from http://www.nytimes.com
Condor.depaul.edu. (n.d.). w5_lectu. Retrieved from: http://condor.depaul.edu/dlamont/mkt555/w5_l ectu.htm.
Cooper, D. R. & Schindler, P. S. (2011). Business Research Methods. 11th ed. New York: Mcgraw-Hill.
Durianto, D. dan C. Liana (2004). Analisis efektivitas iklan televisi softener soft & fresh di jakarta dan sekitarnya dengan menggunakan consumen decision model, Jurnal Ekonomi Perusahaan, Vol.11 (no.1): 35-55
Gabungan Industri Kendaraan Bermotor Indonesia. (2014). Gabungan industri kendaraan bermotor indonesia - home. Retrieved February 24, 2014 from: http://gaikindo.or.id Ghozali, I. (2013). Aplikasi Analisis Multivariate
dengan Program IBM SPSS 21 Update PLS Regresi (7th ed.). Semarang: Badan Penerbit Universitas Diponegoro.
Gordon, D. (n.d.). What Drives Business, Branding Or Marketing? (1st ed.). North Carolina: Channel Marketing Group. Retrieved from http://www.channelmkt.com/articles/What%20 Drives%20Business.pdf
Hawkins, D., & Mothersbaugh, D. (2010). Consumer behavior (1st ed.). Boston: McGraw-Hill Irwin.
Hosein, N. Z. (2012). Measuring the Purchase Intention of Visitors to the Auto Show. Journal Of Management & Marketing Research, 9.
Howard, J. A. (1994). Buyer behavior in marketing strategy. Englewood Cliffs, N.J.: Prentice Hall. Jalilvand, Samiei, N. & Mahdavinia, S. H. (2011). The effect of brand equity components on purchase intention: an application of aaker's model in the automobile industry. International Business & Management, 2 (2). Keller, K.L. (1993). Conceptualizing, Measuring and
Managing Customer-Based Brand Equity. Journal of Marketing, 57, 1-22.
Keller, Kevin (1998). Strategic Brand Management(1st ed.). Prentice Hall: Upper Saddle River.
Kim, W.G and Kim, H.B. (2004). Measuring Customer-based Restaurant Brand Equity: Investigating the Relationship between Brand Equity and Firms' Performance. Cornell Hotel and Restaurant Administration Quar- terly, 45(2), 115-131.
39 SMEs (1st ed.). Cheltenham: Edward Elgar Publishing.
Kotler, P., & Keller, K. (2012). Marketing management (1st ed.). Upper Saddle River, N.J.: Prentice Hall.
Kurniawan, A. (2013). Penjualan Mobil Masih Lancar dengan Suku Bunga BI 7,5 Persen. KOMPAS.com. Retrieved May 7, 2014, from http://otomotif.kompas.com/
Lee, G. C. (2011). Customer-based brand equity: a literature review. Journal Of Arts Science \& Commerce ISSN, 2229 (4686), p. 4686. Lenskold, J. (2011). Can Brand Awareness Generate
Measurable ROI?: Lenskold Group. Lenskold.com. Retrieved May 13, 2014, from http://www.lenskold.com/content/articles/lensk old_jan11.html
Madahi, A. & Sukati, I. (2012). The effect of external factors on purchase intention amongst young generation in Malaysia. International Business Research, 5 (8).
Mangalandum, R. (2013). Produsen Mobil Jangan Remehkan Pengaruh Website terhadap Pembeli. SWA.co.id. Retrieved May 7, 2014 from: http://swa.co.id
McCarthy E. Jerome & William D, (2002). Dasar-Dasar Pemasaran Manajemen Global, Jilid dua, Edisi keenam belas, Erlangga, Jakarta Pavlou, P.A., and Gefen, D., (2004). Building
effective online market places with institution-based trust. Information Systems Research Vol.15 (1): 37-59.
Pi, S., Liao, H.L., Liu, S.H., Lee, I.S., (2011). Factors influencing the behavior of online group buying in Taiwan. Journal of Business Management Vol.5 (16): 7120- 7129.
Rizwan, M., Khan, H., Saeed, A., Muzaffar, A., Arshad, U., & Hussain, M. (n.d.). Antecedents of Purchase Intention A Study From Pakistan. Sadat, M. Andi. 2009. Brand Belief: Strategi
Membangun Merek Berbasis Keyakinan. Jakarta: Salemba Empat.
Saputra, D. (2013). Internet dapat mempengaruhi keputusan pembeli mobil. Antaranews.com. Retrieved May 1, 2014 from: http://www.antaranews.com
Serial Area Perdagangan: Nensy: Rejeki Manis Mobil Bekas. (2014). Retrieved May 7, 2014, from http://swa.co.id/
Tariq, M., Nawaz, M., Nawaz, M., & Butt, H. (2013). Customer Perceptions about Branding and Purchase Intention: A study of FMCG in an Emerging Market. Journal Of Basic And Applied Scientific Research, 3(2), 340--347. Tuominen, P. (1999). Managing brand equity. LTA,
1(99), 65--100.
Ukpebor, P., Ipogah, B., Aronsson, B. and Svensson, M. (2008). A Study to Indicate the
Importance of Consumer Based-Brand Equity on Consumer Perception of Brand (A Case Study of Fast Food Restaurant). Retrieved on April, 18 p. 2009.
Vantamay, S. (2007). Understanding of perceived product quality: reviews and recommendations. BU Academic Review, 6 (1), pp. 110--117.