43
Managing Brand Equity : A Case Study of PT. X
Vincent Effendi, Joseph Shalom Liemmongan
International Business Management Program, Petra Christian University Jl. Siwalankerto 121-131, Surabaya
E-mail: [email protected]; [email protected]
ABSTRACT
Food & beverages is a tremendously growing industry in the recent and future years. It is a heavy and competitive industry with a steep prospect for Entrepreneurs in Surabaya. This research explore an immense opportunity to explore the impact of having a brand equity towards the purchase intention of F&B’s industry for the case of PT. X.
This Case Study found that there are discrepancies and similarities in the perspective of Owners/Brand Managers of PT. X and their consumers in influencing the purchase intention by Brand Equity. Employing both qualitative (interviews) and quantitative (self-administered questionnaires) the research found that the similarities are on perceived quality and brand loyalty, while the different findings are in the brand awareness and brand association; the owner/brand managers thought that the variables is affecting well, while the results do not show like what they perceived. The owners comes up with different factors from the brand equity’s elements in affecting purchase intention in responding to the consumers’ perception, which is, ‘Trend’ and Appetite. In the statistical methods, specific individual elements that are significant are: Perceived Quality, and Brand Loyalty, while Brand Awareness and Brand Association were not.
Keywords: Brand Equity, Purchase Intention, Branding Management, Marketing Management.
ABSTRAK
Industri makanan dan minuman adalah industri dengan pertumbuhan pesat di tahun-tahun ini dan tahun-tahun yang akan datang. Industri ini adalah Industri dengan kompetisi yang sengit dengan pesaing lain, dan menjanjikan prospek yang baik untuk wiraswasta di Surabaya. Penulis melihat sebuah kesempatan yang baik untuk mendalami dampak ekuitas merk terhadap minat beli industri makanan dan minuman, PT. X sebagai subjek studinya.
Studi Kasus ini menemukan bahwa adanya perbedaan dan kesamaan di dalam perspektif pemilik atau pengelola merek PT. X dengan konsumen PT. X di dalam mempengaruhi minat pembeli berdasarkan Ekuitas Merek. Menggunakan baik metode kualitatif (wawancara) dan kuantitatif (kuesioner). Peneliti menemukan bahwa adanya kesamaannya dalam persepsi kualitas dan loyalitas merek untuk mempengaruhi minat beli. Sedangkan, perbedaan terdapat pada kewaspadaan merek dan asosiasi merek; pemilik atau pengelola merek berpikir bahwa strateginya sudah bekerja sesuai dengan tujuannya, namun, hasilnya tidak menunjukan hal yang sama. Pemilik PT. X mengemukakan sebuah factor yang berbeda dari lingkup ekuitas merek untuk mempengaruhi minat beli, yaitu, Tren, dan Nafsu Makan. Pada metode statistik, elemen individu yang signifikan adalah: Persepsi Kualitas, Loyalitas Merek. Kewaspadaan Merek dan Asosiasi merek tidak signifikan.
Kata Kunci: Ekuitas Merk, Minat Beli, Manajemen Merk, Manajemen Pemasaran.
INTRODUCTION
Food and Beverage industry (F&B) is a rapidly growing industry in the Indonesian market, especially Surabaya. This industry based on the data by Surabaya Dalam Angka (2016) contributes an average of 6.5% to Surabaya’s Gross Domestic Product (GDP) annually; the biggest contributor among its category. Projecting its steep
growth according to Surabaya Dalam Angka (2016), F&B industry GDP is constantly increasing averagely 13% annually.
44 (Surabaya Dalam Angka, 2016). Therefore, this creates both an opportunity and challenge for F&B business owner to be competitive.
According to Aaker (1991) and Keller (1993) branding is an important feature or tool that help brands to distinct or strengthen its product or services from their competitors. Aaker (2009) explains that the added value of a brand can be measured by brand equity. Brand equity is a set of attributes or liabilities that can add or subtract a value of a brand (Aaker, 2009). Brand equity plays an important role to boost up business performance. Moreover, managing the brand equity well will help the business to develop their brand’s strength (Aaker, 2009).
Keller (1993) explains that brand equity has consumer-based and other proprietary assets. Consumer-consumer-based brand equity is used to view the value of brand from the perspective of the consumer, while the other proprietary assets are used to measure the monetary estimated value of the brand more precisely for accounting purposes (Keller, 1993). This research will focus on consumer-based brand equity because the researchers are trying to measure the value perspective of the consumer on the brand equity.
Aaker (1991) explains that stronger brand equity will give more added values, meaning that it will help the company to generate more benefits from its brand. A brand with a higher value will be more easily to be recognized, recalled and therefore have a place in the consumer’s mind to affect the purchase intention (Ajzen, 1991). Businesses want to affect their customers’ purchase intention, and one of the major goals of the business to do so is to put their brand on the top of the customers’ minds (Brondoni, 2001). Therefore, to influence the purchase intention is to have brand equity, which is to have the higher added value.
In this research, the researchers chose to do the evaluation of the topic for the case of PT. X. is chosen for its significant growth and how the founders, K and A, strongly believe that branding is important. PT. X’s growth can be seen by the following: (1) Revenue (2) Employees, and (3) Branches. First, founded in March 2013 making only IDR 14 million, right now in 2017 PT. X has an average of IDR 500 million revenue per month (Maulana, 2015; CNN Indonesia, 2017). Second, from having to start with only 3 employees PT. X right now employs 54 employees (Wongso, 2017). Third, starting from garage now PT. X has grown to have four branches in Jakarta & Surabaya. (K. Binanto & A. S. Liemmongan, personal commnunication, February 21, 2017).
Taking a different perspective, the researchers believe that the acknowledgement of PT. X in the market exists too. Multiple mass media have reviewed PT. X during its growth, having to be exposed to mass media increases their acknowledgment by the market. PT. X has been exposed by Jawa Pos, Suara Surabaya, Hard Rock FM, and also by national television channels such as Trans TV, SCTV, and CNN Indonesia (Maulana, 2015; CNN Indonesia, 2017).
Therefore, by overlooking the condition of PT. X, it becomes an interesting phenomenon to be studied. With its significant growth, the practice of branding management, and with the acknowledgement in the market, the researchers
find PT. X’s case fitted to be the subject of analyzing the phenomenon. The way this research will study the phenomenon is to see the two perspective of the management of Brand Equity from two subjects and reflect it. From the owners of PT. X and the customers’ of PT.X. Reflecting both perspective allows the researchers to find similarities and discrepancies of the perspective and see where can PT.X can focuses as it is a factor which are truly realized in the market.
LITERATURE REVIEW
This section will begin with the definition and concept of brand equity and its four essential elements which are (1) brand awareness, (2) brand association, (3) perceived quality, and (4) brand loyalty and how it relates to purchase intention, this review is to support the research as its backbone. Upon explaining the definitions and concepts, the researchers will establish the theoretical framework and end the chapter with the preposition development. These main highlights of the variables are connected to the background
Brand Equity
According to Aaker (2009), brand equity is a set of attributes or liability linked to a brand, which adds or subtract the value provided, by a product or services to the company and the company’s consumer. Previously Farquhar (1989) explains that brand equity is an added value to a brand and product that made of positive consumer feelings, thinking, and acting.
Having brand equity, the consumer can perceive the brand with higher or lower value, with higher brand equity, the higher perceived value is (Aaker, 2009; Kotler & Keller, 2016). Brand equity also helps the firm to generate value by increasing marketing efficiency and effectiveness, creating brand loyalty to the consumer to increase profit margins and finally to become the market leader (Bagozzi, 1998).
Aaker (2009) explains that brand awareness, brand association, perceived quality, brand loyalty, and other proprietary brand assets are the elements that can measure the brand equity. To specify on brand equity, according to Keller (1993) there are (1) consumer-based brand equity and (2) other proprietary brand assets. Consumer-based brand equity is the perspective of the consumer on the brand. This research focuse on consumer-based brand equity.
Brand Awareness
Brand awareness is how strong the brand’s presence in the consumer’s mind (Aaker, 2009). Kotler and Keller (2016) defines brand awareness as the consumer’s ability to recognize and recall the brand’s components in consumer’s mind as a component of a certain product or service of a company. Brand Awareness acts as one of the crucial points to differentiate company’s brand from their competitor. When the brand has a high brand awareness, it will increase the likelihood that the brand will be chosen when the consumer on the purchase decision process (Keller, 1993).
45 fundamentally. Brand recognition relates to consumer’s ability to recognize a specific brand among others when given the brand characteristics as a cue such as product that they sell (Kotler & Keller, 2016). Brand recognition is known as “Aided Recall”. Aided recall is a situation when the consumer can identify a brand by given any cues. Brand recall relates to consumer’s ability to generate the brand from the memory spontaneously once he/she was given a relevant clue such as the category of the product (Kotler & Keller, 2016). Brand recall is also known as “Unaided recall or occasionally spontaneous recall”. Unaided recall is a situation where the consumers can identify a brand from their memory when they prompted by a product category (Kotler & Keller, 2016).
Brand Association
Brand association is a set of brand assets and liabilities such as product's attributes that can be associated with the brand (Aaker, 2009). By associating with the brand, the consumers can relate to the benefits of using the product, lifestyle, product classes. Brand association can establish a positive or negative attitude and feel for the consumer, which may influence the purchase behavior, purchase satisfaction, as consumer’s loyalty (Aaker, 2009). There are three aspects of brand association which are brand attributes, benefits, and attitudes (Keller, 1993).
First, brand attributes are goal attributes that characterize a product or service. Similar to Perceived Value, Brand attributes can be the product or non-product related attributes (Keller, 1993). Product related attributes are tangibles attributes or anything that is related to the product’s physical composition or service’s requirements including product characteristics. Non-product related attributes are external aspects of the product or service that relate to its purchase or consumption (Keller, 1993).
Second, Brand Benefits, this attribute explains the association of the benefits of the brand, which connect the consumer to the brand. There are three aspects of brand benefits, which are functional, experiential, and symbolic (Keller, 1998). Functional Benefits are intrinsic advantages and more linked to basic motivations such to satisfy the desire of eating cakes. Experiential benefits are related to how consumers feel when they use the product or services (Keller, 1998). Symbolic benefits are the extrinsic advantages of product or service consumption that correspond to non-product-related attributes such as needs for social approval or personal expression such as exclusivity (Keller, 1998).
Third, Brand Attitudes are the complete evaluations of a brand (Keller, 1993). This attribute relates to how consumers think and how they strongly feel toward the brand. The consumer can be familiar with the brand but they might have different feel toward the brand, it can be unfavorable, neutral, of favorable. Brand attitudes help to determine the consumer's action and behavior toward the brand depending on the brand attributes and benefit of the brand (Keller, 1993; 1998).
Perceived Quality
Perceived quality acts as a crucial dimension as it is a view or perspective of a consumer of a product’s excellence (Aaker, 2009; Zeitahml, 1988). It is a perspective because it is not an actual or an objective quality, it is an abstract extraction that is similar to behavior within the mind of a consumer; an act of pre-judgments of price, quality, or value before even trying/seeing (Zeitahml, 1988). Perceived quality can represent other more elements or details of brand equity because it includes functional benefits variables such as price and value (Zeitahml, 1988).
Having a perceived quality, the consumers are being given some reasons for making a decision of purchasing a product. They were given reasons like the quality offered and/or their belief in the product’s overall value compared to other brands. Also, perceived quality enables the consumer to draw their presumptions of the product’s excellence. Perceived quality is represented by two attributes, which are internal and external factors (Zeitahml, 1988). The former represents the physical or actual display of a product. In a cake, the internal factors are flavor, texture, color, and the degree of sweetness. In a sense, internal factors are that the consumer can derive from having an experience with the service or product. The latter, is the factor that is not related directly to the physical product itself, for example, it would be price, brand name, and level of advertising (Zeitahml, 1988).
Aaker (2009) explains the dimensions of measuring perceived quality. First, Quality statements use measurements for perceived quality with asking the consumer by comparing a brand to alternative brands, of its quality, and rating (Best vs. the worst) (Aaker, 1996). Second, brand leadership, in this research perceived quality by leadership is irrelevant because it reflects market size, and popularity, and it is not a simple construct for the case of PT. X. Lastly, by value, it’s according to the value proposition of the brand’s products, when the perceived quality divided by cost-in this context the cost is money/price of the product. Therefore, the points to measure from perceived quality is to measure how the consumers presume the brand of its quality, by comparing the brand to alternatives which are in the same business and consumer’s segmentation (Aaker, 1996).
Brand Loyalty
Brand loyalty is an act of loyalty of the consumers to a certain brand (Aaker, 2009). The loyalty of a consumer relates to the willingness to repurchase the same brand for a certain product. Furthermore, Aaker (2009) suggests that brand loyalty acts as the foundation of many elements of brand equity; it is the earliest part of the consumer to experience of its use. Keller (1998) also mentions that brand loyalty is a core of brand equity as well. Carelessly manage a brand, it could affect the consumer relationship and their loyalty. Keller (1998) and Aaker (2009) point out four indicators of brand loyalty, these indicators also enable the brand to enhance itself and/or the business’ value, while it also lowers the expenses for retaining their brand.
46 choice (Aaker, 1996). Due to the consumers’ loyalty, they have a lower barrier for them on purchasing the new product of the brand they are loyal with (Aaker, 2009). Followed by the second indicator is relating with a consumer and their level of ease on switching brands within the same specific products; if they switch easily means they are less loyal.
Third, a loyal consumer is not sensitive to brand’s price premium. Producers can charge a rather higher price compared to the competitors (Aaker, 1996); price premium generated by perceived value the consumer expect from the product/services’ excellence (Aaker, 2009). Also, due to their loyalty consumers have a strong stance to stay loyal to that brand even when there is a price reduction remarks from other competitions (Aaker, 2009; Keller, 1998).
Lastly, the fourth indicator is the willingness of consumers to share their positive experience with others (Aaker, 1996). Anselmsson, Bondesson, and Johansson (2014) find that this indicator creates a chain of positive word of mouth. Knowing the level of ease to switch between brands can be counted as a measurement for Brand Loyalty. Also, Keller (1998) mentions that in order to measure brand loyalty, a marketer can study the satisfaction level of its consumer on its brand. Therefore, to measure brand loyalty the researchers use these 4 indicators, which are consumer’s barrier, ease of switching, price premium, and positive word of mouth, and satisfaction.
Purchase Intention
Then, to see the dependent vraible, Purchase Intention, Ajzen (1991) define “Intention” as the will of consumers to try, or how much of a shot the consumers are willing to make. A consumer having a stronger intention would resulting in the final decision-making which leans toward the same product/ services which the consumer intended to buy. Purchase intention is also influenced by price, value, and quality (Zeitahml, 1988). However, these other influencers are the subjective view of the consumer that can be associated with brand equity which is mostly represented by Brand Association, and Perceived Value (Aaker, 2009; Zeitahml, 1988). Therefore, the attributes of Brand Equity which relates to Purchase intention acts as the justification for the other possible influencer of Purchase Intention.
Shah et al. (2011) and Kotler & Keller (2016) explains that purchase intention focuses to the preference of the consumer to choose between the products, and it is during the process of collecting information the favorable brands will be brought up first. Despite Ajzen’s (1991), Ingen & Ghosh (1990) opinion the difficultness to measure purchase intention it is still an important aspect of consumer’s decision process and a measurable one (Aaker, 2009; Zeitahml, 1988).
Shown in figure 1 is the visualization of the framework for this paper. The framework describes the relationships between the variables. As defined in the literature, the independent variables (IV) are the dimensions of Brand Equity that have relationship towards purchase intention (DV). The researchers use brand equity alone to affect purchase intention because it is already able to corporate the other possible variables (Price, Value, and Quality)
according to Zeitahml (1988) that would affect the dependent variable. In the following paragraphs, the researchers will explain how the IVs create a logical relationship with the DV.
Figure 1 Relationship Between Concepts
The first independent variable called brand awareness influences the purchase intention (Aaker, 1996). Keller (1993) also adds that consumers have a tendency to only purchase a certain brand that they are aware of in the market. Brand awareness can provide the consumers a sense of familiarity with the brand; it means that the brand will frequently be recalled when the consumer is in the purchasing process. Higher brand awareness makes the brand extremely difficult to be dislodged from the consumers’ mind (Aaker, 1996). Therefore, by having awareness and familiarity with the brand provides preferences to the consumer during the purchase decision process of the consumer and makes the purchase intentions of the consumer increased.
The second variable called Brand Association explains that when the consumers are going to purchase a product, the product or the brand needs to be matched with the consumer’s brand association (Aaker, 1996). It depends on what the consumers have in their mind related to the brand. If the consumers feel that the brand suits with their expectation, brand associations can establish a good attitude of the consumer that may lead to purchase behavior and purchase satisfaction, which in the end brand association affects the purchase decision whereas purchase intention is in related to it (Aaker, 2009).
Third, Perceived Quality, relating to the purchase decision process by Kotler & Keller (2016), perceived quality gives a reason for the consumer to decide to purchase because of its excellence. Also, it enables the consumer to differentiate the product’s state compared to other brands. In the mind of the consumer it affects greatly whether to decide to purchase on the certain product or not (Keller, 1993; Aaker, 2009). The underlying reasons are needed during the evaluation of alternatives upon purchasing a product, the stronger the reason of purchasing, the stronger the intention towards that certain brand.
47 having a tough level of switching between brands and a low barrier of entry towards that certain brand. Therefore, with these indicators brand loyalty can be seen that consumers can retain their belief and product of choice thus affecting their willingness and/or decision to repurchase the same brand. Kotler and Keller (2016) outline that "intending to" or "having to" decide to purchase a certain brand is greatly associated with purchase intention. Therefore, brand loyalty enables the consumer to retain their selection between brands. It shows that brand loyalty has a relationship to purchase intention.
Therefore, with each of the IVs’ logic has been explained. Many empirical studies have shown that brand equity has an impact toward the purchase intention. In the research by Akhtar, Qurat-Ul-Ain, Siddiqi, Ashraf, & Latif (2016) found that brand equity has a positive impact towards the consumer’s purchase intention. Moreover, according to Aaker (2009) and Keller (1993), brand equity and its four essential elements influence the consumer’s purchase intention.
Brand awareness’ relationship to purchase intention is seen by the following explanation. the consumer can gain familiarity toward the products and subsequently increase the consumer probability to purchase the product from that brand (Aaker, 1996). Brand associations help the consumers obtain information, distinguish the brand, generates an intention to purchase the product, and also establish a good consumer attitude to the brand (Aaker, 2009). Perceived quality also help the consumer to have a different point of view to the brand and lead to purchase intention if the brand's quality is as the expectation (Aaker, 1996). Finally, with brand loyalty, the consumer can be attached to the brand (Aaker, 1996). This makes them more reluctant to shift to another brand and finally increase the purchase intention. Therefore, these four dimensions of brand equity have an influence toward the consumer’s purchase intention.
Qualitative Research is inductive, in terms of formulating a result. It is focused on answering or exploring one phenomenon in a social context. It is bounded to specific context that is not generalizable (Bryman, 2012). As qualitative research aims to explore or explain a phenomenon, it does not test or prove one hypothesis, because hypothesis is strictly in a positivist scope, while qualitative goes for an interpretivist approach (Bryman, 2012).
This research will be having mixed-method of quantitative and qualitative methods. Therefore, for the qualitative part of this research, it will not show any hypothesis, but it is rather to have a proposition. Proposition is a statement that states the researchers’ opinion for a phenomenon (Cooper & Schindler, 2014).
Proposition: There are gaps or discrepancies between the perspective of PT. X’s Owner/Brand Managers compared to their customers’ on influencing the purchase intention by Brand equity.
RESEARCH METHOD
Case study is one of the ways of doing a social science research or a basis for its research methodology (Yin, 2008). Case study is being used to answer “how” or why questions. It is used when the focus of the research is on a live phenomenon (Yin, 2008). Case study is a mainstream methodology for qualitative researchers. However, despite its frequent use, case study is still vague of its status as a strategy because its protocols are not well explored and structured (Bryman, 2012).
The reason to use case study as the research design is because of the advantages of its use, mainly that the researchers can go in depth with the result of a context that is in use (Yin, 2008). So the advantages are, first, the data that will be concluded is from within the subject matter being studied. So, for this research the owner of PT. X will be studied in terms of their brand management. Second, internally, the instrument of collecting the data allows the researchers to conduct both quantitatively and qualitatively. Yin (2008) mentions that case study cannot be resembled to only qualitative nor quantitative research as it covers both of the methods. Lastly, the qualitative data can detail out the exploration, which can describe a real-life phenomenon or situations that are not captured when using a survey since qualitative data are not bound to any limit.
In this research, the design would be done in this respective order of methods, (1) qualitative data collection – (2) quantitative data collection – (3) qualitative data collection. First of all, the researchers will acquire data from the subject (PT. X owners) with an interview in terms of the first encounter to see the brand management of PT. X. The next step, the researchers will move on to acquire data from the consumers and test what the consumers perspective of the brand equity of PT. X. Lastly, the researchers will present the findings and see how the owners of PT. X would relate to the findings from their branding management.
The interview will be conducted by using focused interview type. Focused interview is when the interviewers ask open questions towards the interviewees about a phenomenon that is relevant to their social being and of the interest of the interviewers or researchers (Bryman, 2012). On the other hand, from the Self-Administered Questionnaires (Which the acquired quantitative data also should be analyzed. Statistical method applied in this statistical analysis is multiple linear regression. Multiple linear regression is performed to see how two or more independent variables (X1, X2, X3, X4) explain, influence, and predict on the continuous dependent variable (Y) (Sekaran & Bougie, 2016). Moreover, multiple linear regression is able to identify which among the independent variables are having the most significant influence on the independent variable. The equation of multiple linear regression in this research is written as below:
48 sorting it to only the related/relevant information regarding the research. This process leads the researches to search for information in order to build a picture and describe the phenomenon occurred. In this stage, Miles, Huberman, and Saldana (2014) suggest that all of the irrelevant data is to be removed.
Second, data display is the process when the researchers present the selected data after the reduction. Anderson (2010) explain that the data display for an interview can be displayed in a form of quotation. The data that is displayed is the data that is most representative of the findings. Third, drawing a conclusion from the data. Miles, Huberman, and Saldana (2014) explain that drawing conclusion is the process when the researchers begin to analyze the data and extract the core information in order to generate the conclusion.
In analyzing the quantitative data, the researchers process the data in BLUE Classical test to see whether the data is (1) The data of the variable in the regression is normally distributed. (Normality) (2) The variance of residuals or error terms is the same for all observations. (Heteroscedasticity) (3) The residuals do not have a correlation in the current period (t) and the previous period (t-1) and (4) There is no correlation among the independent variables. (Multicolilinearity). Then when the data is tested for and it accepts all the null hypothesis of BLUE Classical test, the researcher continues with Validity and Reliability test, seeing the significance r-value for the former, and cronbach alpha for the latter.
Passing the Validity and Reliability test then the researchers continue to see the statistical test with 3 model which are (1) F-Test: F-value result is to be > F-Critical Value, and the P-Value < 5%. (2) t-Test: If t-test < -t critical value or > +t critical value (Reject H0), or if the P-Value < 5% Significance Level. Lastly, (3) Adjusted R2: When adjusted R2 is equaled 1.0, it explains the linear relationship of IV and DV the desired result of R2 is having it closer to 1.
RESULTS AND DISCUSSION
The researchers will discuss about the answer for the research questions and elaborate the result of the preposition which has been stated in the previous chapters. The research question in this case study is “To what extent is the difference of perspective between PT. X owners compared to their consumers’ on brand equity to influence the purchase intention of PT. X?”. Previously the researchers have elaborated on the sequence of the data gathering. After doing the first interview with PT. X owners, the researchers continue to gather data from the consumers with self-administered questionnaire and process it with statistical data analysis. Then, with the gathered the data gathered, the researchers try to reflect what PT. X owners think about their brand management regarding the results of the consumers.
Upon displaying the data from the interviews, the researchers have presented it with themes and evidence of each theme in related with its theoretical review. These themes allow the researchers to see the data in a clustered manner and help the researchers to reflect it with the findings
of the statistical data analysis. The themes have helped the researchers to construct the following discussion. The following discussion will reflect the sequence of the data gathering, from the first interview’s result, then it follows to the reflection of the second interview on the statistical data findings.
PT. X owners believe that the brand equity is important by seeing from these efforts they made. First, they believe that a brand must have its own charm. Charm according to PT. X owners is same with the added value of the brand (Brand Equity). Moreover, they believe that their brand has to go beyond the brand itself whenever their consumers have something to see from their brand. In other words, having something greater than expected or shown. By connecting the evidence, the researchers can conclude that PT. X owners embrace their brand equity in order to gain more added value for their brand. Their belief toward their brand is in accordance with Aaker’s (2009) explanation which indicates that a brand should focus to improve their brand loyalty by having more added value to the brand. Each of the elements of brand equity is supported by PT. X’s brand management.
For their brand awareness, they are confident that PT. X’s brand is well known and the people appreciate it with good response in buying or praising the brand. They mentioned that back then if people were to see a shape of cake like mille crepes, they do not call it mille crepes, instead, they called it PT. X cake. Moreover, PT. X owners state that their brand is popular enough in the market since they met a lot of people who recognize PT. X. According to Keller (1993), a brand that has a high brand awareness is the brand that can be easily recognized and recalled by the consumers. Therefore, theory from Keller (1993), implies that PT. X has a high brand equity and therefore able to influence their consumer purchase intention.
For the brand association, they believe that they succeed to create an association for their brand with cake since their customer can associate PT. X’s brand with cake directly even though they not only selling cake. Moreover, their consumers are having a good experience toward the brand because people give positive comments and also, they got pride when they have PT. X. These facts also supported by the theory from Aaker (2009) which explain a brand with good brand association is when the assets of a brand can be used by the consumer to think about the brand directly.
49 For their brand loyalty, they believe that by being consistent, the consumer will have PT. X in mind for their cake preferences; they believe that PT. X sells good cakes and it satisfies their wants. However, they believe that brand loyalty is difficult factor to influence purchase intention since what the market want is constantly changing. Aaker (1996) explains that one of the ways to grab the consumers’ loyalty is by fulfilling the consumers’ expectation. They believe that following the market demand will enable them to fulfill the consumers’ expectation and generate their loyalty of preference towards PT. X and thus increase the purchase intention of their products.
In the first interview, PT. X owners already suggested that there is another factor which not related with any elements of brand equity, it is themed as ‘Trend’. On the first place, they believe that trend is the main factor for the market demand because their market, the people of Surabaya, is a market who like to consume something new accordingly to the trend. This factor will have a strong influence toward their consumer. Based on the theoretical background presented by the researchers, the ‘Trend’ factor could not be linked to any operationalization of Brand Equity’s elements. The researchers see this as a pre-variable to affect purchase intention before brand equity.
To have a comparison, the researchers continue to gather data to see the consumer’s perception on PT. X’s brand equity upon influencing purchase intention. By distributing self-administered questionnaire to the PT. X’s customers.
The data that the researchers gathered are tested for its validity and reliability. For the validity test, the researchers are using the Pearson Correlation test in determining the validity of the data. The data can be said as valid is the significance 2-tailed value is less than 0.05 (Ghozali, 2013). The result of the test is presented below in Table 1. From the result in the Table 1, it can be implied that all of the data are valid. The data can be said as valid because all of the significance (2-tailed) value is under 0.05. Therefore, the data is ready to be used for the next analysis step.
T
able 1. Validity Statistics of VariablesIn determining the reliability of the questionnaire data, the researchers will conduct the Cronbach’s Alpha Test to
see whether the data is reliable or not. The data can be said as reliable when the Cronbach’s alpha is greater than 0.7 (Ghozali, 2013). In determining the reliability, the researchers also test all of the variables. The result of the test is presented below in Table 2.
Table 2. Reliability Statistics of Variables
From the result, we can see that the data is not only valid, but also reliable. The data can be determined as reliable since all of the Cronbach’s alpha is above 0.7. Therefore, the data is valid and reliable to be used in this research. After knowing the data is valid and reliable, the researchers will use the data to do the multiple regression analysis.
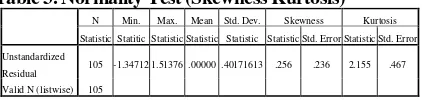
Since the data is valid and reliable, the researchers begin to test the data with BLUE Classical Assumption test. Starting with the Normality, In order to test the normality of the residual, skewness kurtosis test is used. The result of the test can be seen in the table above. The data can be determined as normal if the z-kurtosis and z-skewness value are between -1.96 and 1.96 (Ghozali, 2013). After calculating the data, the value of the z-skewness is 1.070 and the z-kurtosis is 1.030. The result shown in Table 3 of the test makes the researchers should accept the null hypothesis. The result means that the residual of the data is following normal distribution assumption of the research.
Table 3. Normality Test (Skewness Kurtosis)
Followed by heteroscedasticity test and the result is presented in the table above. The value that will be looked after is the significance of each independent variable. The result can be regarded as significant if the significance value is more than 0.05 (Ghozali, 2013). As the result shows in Table 4, the significance for each variable is greater than 0.05. This result indicates that the variance of the residuals are constant (homoscedastic).
Table 4. Heteroscedasticity Test
BAW01 BAW02 BAW03 BAW04 Sig. (2-tailed) BAWAVG 0.000 0.000 0.000 0.000
Brand Association Brand Awareness
Pearson Corellation Test - Validity Test
BAS01 BAS02 BAS03 BAS04 BAS05 Sig. (2-tailed) BASAVG 0.000 0.000 0.000 0.000 0.000 BAS06 BAS07 BAS08 BAS09 BAS10 Sig. (2-tailed) BASAVG 0.000 0.000 0.000 0.000 0.000
PEQ01 PEQ02 PEQ03 PEQ04 Sig. (2-tailed) PESAVG 0.000 0.000 0.000 0.000
BRL01 BRL02 BRL03 BRL04 BRL05 Sig. (2-tailed) BRLAVG 0.000 0.000 0.000 0.000 0.000 PIT01 PIT02 PIT03 PIT04 PIT05 Sig. (2-tailed) PITAVG 0.000 0.000 0.000 0.000 0.000
Brand Association
Perceived Quality
Brand Loyalty
Purchase Intention
Variable Cronbach's Alpha N of Items
Brand Awareness 0.877 5
Brand Association 0.875 10
Perceived Quality 0.756 4
Brand Loyalty 0.835 5
Purchase Intention 0.855 4
Descriptive Statistics
N Min. Max. Mean Std. Dev. Skewness Kurtosis Statistic Statitic Statistic Statistic Statistic Statistic Std. Error Statistic Std. Error Unstandardized
Residual 105 -1.34712 1.51376 .00000 .40171613 .256 .236 2.155 .467 Valid N (listwise) 105
Model
Unstandardized Coefficients
Standardized Coefficients
t Sig. B Std. Error Beta
50 Continuing with Autocorellation, Table 5 below shows the result of the Durbin-Watson test that is used for testing the autocorrelation of the data. The Durbin-Watson value of this test is 2.062. In this research, the critical value of the Durbin Watson is dL: 1.6371 and dU: 1.74106. To determine the result, the data has to be between dU and 4-dU (1.74106<d< 4-1.74216) (Ghozali, 2013). The result of the test shows that the value is lies between those ranges. Therefore, that means the researchers accept the null hypothesis that shows the residual of data is scattered. Throughout the result, the data that is used currently fulfilling autocorrelation assumption.
Table 5. Autocorrelation Test
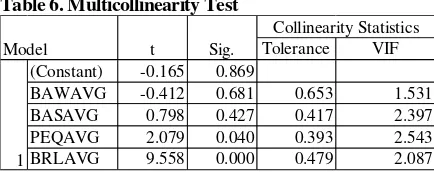
Lastly, Multiocollinearity Test, Table 6 below shows the result of the multicollinearity test. This test is useful in deciding whether there is a high relationship between each independent variable or not. The correlation between each variable can be determined as not correlated if the VIF value is less than 10 or the tolerance value is greater than 0.1 (Ghozali, 2013). The result also indicates that the independent variables are not highly correlated with each other since the value is fulfilled the requirements. Based on the result, that means the researcher can accept the null hypothesis. This result shows that the data is fulfilling the assumption of there is no perfect multicollinearity.
Table 6. Multicollinearity Test
In conclusion, the researchers succeeds to accept al the H0 of BLUE Classical assumption test. Table 7 below showed that the 73% of the variance in the purchase intention can be represented by the independent variables shown by adjusted R-Squared of the regression model is 0.73, the closer the value to 1 the strong the relationship is.
Table 7. Model Summary of Multiple Regression
The researchers continues with F-Test and T-Test. This research’s data shown by the Table 8 below, shows significance level (α) is below 0.05 and it can be concluded that the researchers found out that the brand equity simultaneously influences the purchase intention of PT. X’s consumers.
Table 8. ANOVA Table
There are individual variables which are significant in influencing the consumer purchase intention are perceived quality and brand loyalty and the rest are not. Following is the discussion of the findings related to the statistical data analysis. The findings of the researchers that brand equity is significant and simultaneously influencing purchase intention is aligned to Aaker (2009). Consumer based brand equity and its elements are working as one and related to form a consumer behavior, which in this research is the purchase intention of the consumer.
Zeithaml (1998) also explains that brand equity or added value brings a positive and significant impact on the purchase intention of consumers. Also, based on researchers’ journal references they also found that brand equity and its elements simultaneously affect purchase intention. Relevant researches from Ashill and Sinha (2004), Chang and Liu (2009), Tharmi & Senthilnathan (2012), Huang, Wang, Tseng, and Wang (2013) shows the similar findings which Brand Equity shows a significant and positive result towards purchase intention.
Table 9. Coefficient Matrix of Independent Variables
Doing the T-Test, the researchers sees the Independent variables which are its significant value is below 0.05. Individually for brand awareness, it is not significantly influencing the purchase intention. From Aaker (1996) explanation, the factors that contribute more to brand equity are brand loyalty and perceived quality, not brand awareness. This can be occurred because the brand awareness does not generate an intention to purchase in the first place. When people know about the product, they do not always have intention to purchase the product (Keller, 1998). A study by Gordon (2014) also supports this result by showing that brand awareness individually does not influence the purchase intention and generate sales. However, it is still believed that brand awareness can have a significant impact when brand awareness works together with other elements to generate purchase intention. Moreover, only being aware of the brand will not drive purchase intention unless the brand is supported by unique characteristics that can differentiate its brand (Gordon, 2014).
B rand association is found to individually insignificant. The idea was customers who have brand association that suites their needs will show intention to purchase (Aaker, 2009). However, brand association will not Model R R Square Adjusted
R Square
Std. Error of Estimate
Durbin - Watson
1 0.86 0.74 0.73 0.40967 2.062
Tolerance VIF (Constant) -0.165 0.869
BAWAVG -0.412 0.681 0.653 1.531
BASAVG 0.798 0.427 0.417 2.397
PEQAVG 2.079 0.040 0.393 2.543
BRLAVG 9.558 0.000 0.479 2.087
Model t Sig.
Collinearity Statistics
1
Model R R Square Adjusted
R Square
Std. Error of Estimate
1 0.86 0.74 0.73 0.40967
Standardized Coefficients Constant B Std.Error Beta
BAWAVG -0.042 0.255 -0.165 0.869
BASAVG -0.026 0.063 -0.026 -0.412 0.681
PEQAVG 0.08 0.1 0.063 0.798 0.427
BRLAVG 0.722 0.076 0.704 9.558 0
Sig. t Unstandardized
Coefficients
51 always work as it is. When the consumer associates the brand with something, they just gain knowledge about it, but they do not always have an intention to buy (Keller, 1998). According to Potter and Hotchkiss (1995), in food and beverages industry, quality of the product is the most important thing to determine the consumer’s purchase intention. When the consumers buy a food and beverages product, they will pay attention more on the taste rather than the brand association. This fact also works in PT. X’s business, people will consider more about the taste of the cake compared to the brand association itself. These findings are aligned with Potter and Hotchkiss’ (1995) and also Keller (1998) theory that brand association has an influence but it is insignificant for this type of research.
The next variable tested is perceived quality and it is found to be individually significant. Based on Keller (1993) and Aaker (2009) perceived quality gives consumers a reason to purchase by with their prejudice of quality towards the brand. It shows the product or services’ excellence, which enables to give the consumers a good reason to consume. Both claims that perceived quality affects during purchasing decision steps. In addition, consistent the researchers’ highlight of the explanation by Aaker (1996) that brand loyalty and perceived quality both are the key and crucial points of brand equity. Therefore, it shows why both perceived quality and brand loyalty passes the significance level. While the base theory has shown why individually perceived quality is significant, similar research from Huang, Wang, Tseng, and Wang (2013) also emphasizes on their findings for its significance. Also, followed by Phan and Mai, (2016) shows the highest individual factors for purchase intention are perceived quality and brand loyalty in the food industry.
Brand loyalty is the last variable that is tested and found to be individually significant. As shown in the literature review about the relationship of brand loyalty to purchase intention, consumers that are loyal are basically the ones that retain their belief and product of choice; with loyalty to a certain brand, it became their most intended decision. Which is why, it is able to show that with higher loyalty, it is easier for a consumer to have their intention to purchase the brand they are loyal to (Keller, 1998; Aaker, 2009; Kotler & Keller, 2016). Aside from the theories, similar research finds brand loyalty significant as well, from Huang, Wang, Tseng, & Wang (2013) and, Mirabi, Akbariyeh, and Tahmasefibard (2015), and lastly Phan and Mai, (2016).
In order to see to what extent the PT. X owners opinion regarding the result, the researchers conduct the second interview with the PT. X owner. After the researchers present the result to the PT. X owners, they give their comment first regarding the similarities of the result. They agree that the brand equity influences their consumer purchase intention when brand equity and its elements work together, not individually. This result is in accordance with Gordon’s (2014) theory which explains that elements of brand equity work together, not individually. Therefore, there is no gap between the PT. X owners and their consumer.
PT. X owners see that consistency plays a significant role in influencing the purchase intention. Consistency is
another factor that they never thought that can give a huge impact previously. After seeing the result, they see how consistency in running the branding strategy is very important. They believe that being consistent with the branding strategy can create excellence and generates perceived quality in their consumer’s mind. Having consistency in branding does not mean that the brand has to be exactly the same over the time, it has to be consistent yet evolvable and flexible. PT. X owners believe that consistency in the maintaining the quality can make their consumers also have the same perception with the owners. In order to keep their consumer’s loyalty, they also build a program that can make the consumer have a reason to loyal with the brand. While managing the brand, they always prioritize their effort on perceived quality and brand loyalty of their consumer because they believe that this is the core factors to be the market leader. Aaker (2009) explains that excellence of a brand can generate a good perceived quality which leads to purchase intention. Therefore, the researchers find there is there is strong relevancy between the PT. X owners and consumer perception.
Both the explanation from PT. X owners and consumer show that perceived quality and brand loyalty is important in influencing the purchase intention. For the perceived quality, PT. X owner did have a high effort in maintaining their quality and how to present the brand to show quality. Moreover, Potter and Hotchkiss (1995) support this fact by stating that quality of food is the first important thing in food and beverages industry. For the brand loyalty, it also reflects the explanation from Aaker’s (1996) that brand loyalty is a very important core for brand equity. PT. X maintains its consistency in delivering their brand to meet the consumer’s expectation and fulfill their satisfaction. From the self-administered questionnaire, the consumers responded the same with what the owner’s perceived on the brand management.
For the discrepancies, they were surprised with the result of the findings in the beginning. However, they think that the result still makes sense since they believe that there are other factors that influence the purchase intention. They think that different on the perception can happen because there are other factors which can cause this happen. These factors are ‘Trend’ and ‘Appetite’. In food and beverages industry, PT. X is not considered as new anymore by the market and this fact makes PT. X do not really have their trend anymore. The consumers in Surabaya follow the ‘Trend’ of consuming a new product which fulfills their pride or needs.
52 its availability is not limited, it is accessible and easily to be bought.
Moreover, they admit that they do not put a lot of effort in utilizing the brand awareness and the brand association to drive the purchase intention. Therefore, PT. X owners see that brand association is based on the “Trend” that happen in the market which is why it is controlling their brand association to be insignificant. In the previous interview, the researchers have explained how ‘Trend’ cannot be related to any operationalization of brand equity’s element in Aaker’s (2009). ‘Trend’ is treated as a pre-variable to affect brand association to influence purchase intention. However, this finding is only limited for the case of PT. X, ‘Trend’ as another factor to provide a significance of brand association. PT. X owners suggest for another factor called ‘Appetite’, they also believe that in food and beverages industry, people will buy a product which suits with their appetite. The consumers would have no intention while having no appetite, no matter how popular the brand is, people will not buy their product when the consumers are not in the mood of eating a cake. Appetite will be consumers first decision rule to purchase the product. PT. X owners believe even though their brand awareness is very high, but the consumers do not have any appetite to consume a cake, then consumers will never buy a cake. This result resembles with the findings from Potter and Hotchkiss (1995) which explain appetite, taste, and quality is important upon deciding to purchase a food product.
Therefore, mirroring the result of the quantitative data, with PT. X’s strategy on branding that PT. X is doing, there are similarities and discrepancies. The similarities lay on the result of the perceived quality and brand loyalty. Both of the perspectives agreed that these two variables are significantly influencing the purchase intention. On the other hand, the discrepancies lay on the PT. X owners perception and consumer perception on the application of brand awareness and brand association. PT. X owners believe that the brand awareness and brand association strategy was on point. However, the consumer responded differently. Hence, PT. X owners justify the findings by explaining that there is ‘Trend’ and ‘Appetite’ which also play a significant role in influencing their consumer’s purchase intention.
In addition, there is a gap in the statistical findings compared to what the owners of PT. X have been managing the brand equity. According to the owners of PT. X, they have been pushing their branding to represent quality and deliver it as well; this relates to perceived quality. However, in the statistical analysis, it was found that the most significant variable is brand loyalty, it is not the perceived quality which the owners put much effort on. The researcher can justify this by Aaker’s (1996) theory, the center of the brand equity is perceived quality, when it is built it will generate a sense of excellence. Then, with that sense of excellence, it will meet the customers’ expectation and fulfill their satisfaction. Finally, with such fulfillment, the consumers will have a loyalty or preference to the brand which shows its excellence. Therefore, a consumer which have a high brand loyalty has a significant perceived quality
as well, and that is why it allows the variable to be most significant to affect purchase intention.
CONCLUSION
As the case study has been done, the researchers will summarize all the findings. During this research, Interview has been conducted and self-administered questionnaire has been developed and designed in order to know the impact of brand equity, which consists of brand awareness, brand association, perceived quality, and brand loyalty toward the purchase intention of PT. X’s customers in Surabaya by analyzing the data using the mixed-method (Quantitative and Qualitative). A mixed-method application has been done by first, have an interview for the perspective of PT. X’s owner on their brand equity to affect purchase intention, followed by performing multiple linear regression analysis to see the consumers’ perspective towards PT. X’s brand equity on their purchase intention, and another interview performed to see the opinions of PT. X owners on the findings.
To answer the preposition on this case-study, the researchers reflected on the first interview’s result to the statistical analysis. In the findings and discussion, the researchers found that in PT. X’s strategy on branding for their brand equity to influence purchase intention, there are similarities and discrepancies on their perception compared to the consumers’ perception. First, the similar part is on the result of the perceived quality and brand loyalty. It was found that both PT. X’s owner and the consumers have the similar perspective. What PT. X’s owner believed that their branding pursues for perceived quality and brand loyalty to affect their consumers’ purchase intention is being well reflected to the consumers, they responded the same as what the owners desired to; the statistical analysis for the respond of consumers resulted in a significant effect on perceived quality and brand loyalty towards the consumers’ purchase intention.
In contrast, PT. X owners perception and consumers perception for brand awareness and brand association to affect the consumers’ purchase intention was different. Previously, PT. X owners believed that the brand awareness and brand association is strategically managed, which they believe that their consumers are already well associating their brand and are aware with it, but the consumers responded differently. Even if they are aware and associates the brand with certain attributes, upon influencing their purchase intention was insignificant. In the statistical result, they show an insignificant effect of brand awareness and brand association towards their purchase intention.
53 of PT. X themselves justifying that they are the one who know the business and they are the experts of their market.
By conducting this case study, it has given the researchers an opportunity to have in depth analysis of PT. X’s branding management by reflecting it to the consumers’ perception. Moreover, the researchers also can help the PT. X owners to have more understanding about how their customer are thinking to the branding strategy that they are doing currently. With this research, the PT. X owners will know what kind of improvements and strategies that are effective to increase the purchase intention of their customer in Surabaya.
REFERENCES
Aaker, D. (1991). Managing brand equity. New York: Free
Press.
Aaker, D. (1996). Measuring Brand Equity Across Products
and Markets. New York: Simon & Schuster, Inc.
Aaker, D. (2009). Managing Brand equity. New York: Simon
and Schuster.
Ajzen. I. (1991). The Theory of Planned Behavior.
Organizatioal Behavior and Human Decision Processes, 179-211. Retrieved from https://cas.hse.ru/data/816/479/1225/Oct%2019%20 Cited%20%231%20Manage%20THE%20THEORY %20OF%20PLANNED%20BEHAVIOR.pdf Akhtar, N., Qurat-Ul-Ain, Siddiqi, U., Ashraf, A., & Latif,
M. (2016). Impact of a Brand Equity on Consumer
Purchase Decision in L’Oreal Skincare Products. International Review of Management and Business Research, 5(3). doi:ISSN: 2306-9007
Anderson, C. (2010, October). Presenting and Evaluating
Qualitative Research. American Journal of
Pharmaceutical Education, 8(74), 141.
Anselmsson, J., Bondesson, N. V., & Johansson, U. (2014). Brand image and customers' willingness to pay a
price premium for food brands. Journal of Product &
Brand Management, 90-102.
Ashill, N. J., & Sinha, A. (2004, September). An Exploratory Study into the Impact of Components of Brand Equity and Country of Origin Effects on Purchase
Intention. Journal of Asia-Pacific Business, 27-43.
Bagozzi, R. (1998). Marketing management (1 ed.). Upper
Saddle River, N.J: Prentice Hall.
Baker, T. L. (1994). Doing Social Research. New York:
McGraw-Hill Inc.
Bansah, M., Dabi, M., Dzorvakpor, S., & Nwodo, H. (2015, n.d.). The Effect of Branding on Consumer Buying Behaviour among Textile Ghana Fabric Users in the
Ho Municipality of Ghana. European Journal of
Business and Management, 7(26), 117-125.
Retrieved January 2017, from
http://citeseerx.ist.psu.edu/viewdoc/download?doi= 10.1.1.735.2061&rep=rep1&type=pdf
BPS. (2015). Jumlah Penduduk berdasarkan Jenis Kelamin
dan Kelompok Usia. Retrieved from Retrieved from
http://data.go.id/dataset/jumlah-penduduk-berdasarkan-jenis-kelamin-dan-kelompok-usia Brondoni, S. (2001). Brand Policy and Brand Equity.
Emerging Issues in Management , 5-25. doi:http://dx.doi.org/10.4468/2001.1.02brondoni
Bryman, A. (2012). Social Research Methods. New York:
Oxford University Press.
Chang, H. H., & Liu, Y. M. (2009, November). The impact of brand equity on brand preference and purchase
intentions in the service industries. The Service
Industries Journal, 1687-1706.
CNN Indonesia. (2017, February 26). Lezatnya Omzet Bisnis Cake. Surabaya, East Java, Indonesia. Retrieved
February 26, 2017, from
https://www.youtube.com/watch?v=uEUdJZiyRA8
Cooper, D., & Schindler, P. (2014). Business Research
Methods (12thed.). New York: McGraw Hill.
Eriksson, P., & Kovalainen, A. (2008). Qualitative methods
in business research. Los Angeles: SAGE.
Farquhar, P. (1989). Managing Brand Equity. Marketing
Research, 1(3), 24-33. Retrieved December 2016, from
http://web.b.ebscohost.com/abstract?direct=true&pr ofile=ehost&scope=site&authtype=crawler&jrnl=10 408460&AN=6896052&h=JfWv5HKECB0dMy1W MkhSRNR3dQSAGVlDPMGFT%2fBRkR88w9p9 8Jj%2b3ncwqzRO%2b8cT0V2AhTO3fnAwW%2b G4%2bsMvKg%3d%3d&crl=c&resultNs=AdminW ebAuth&resultL
Ghozali, I. (2013). Aplikasi Analisis Multivariat dengan
Program IBM SPSS 21. Semarang: Badan Penerbit Universitas Diponegoro.
Golafshani, N. (2003). Understanding Reliability and
Validity in Qualitative Research. The Qualitative
Report, 8(4), 597-606.
Gordon, D. (2014). What Drives Business, Branding Or
Marketing? North Carolina: Channel Marketing Group.
Green, S. (1991). How many subjects does it take to do a
regression analysis? Multivariate Behavioral
Research, 499‐ 510.
Harris, L. R., & Brown, G. T. (2010, January). Mixing interview and questionnaire methods: Practical
problems in aligning data. Practical Assessment,
Research & Evaluation, 15(1), 2-16.
Hill, R. (1998). What Sample Size is Enough in internet
survey research. Interpersonal Computing and
Technology, 6(3-4).
Huang, D. (1970). Regression and econometric methods (1st
ed.). New York: Wiley.
Huang, P., Wang, C., Tseng, Y., & Wang, R. (2013, June). The impact of brand equity on customer's purchase
intention – Taking perceived value as a moderating
variable. Journal of Information and Optimization
54
Ingene, C. A., & Ghosh, A. (1990, February). Consumer and Producer Behavior in a Multipurpose Shopping
Environment. Geographical Analysis 22(1), 70-93.
Jawa Pos. (2016). The Best Bakery & Pastry Shop Surabaya.
Retrieved February 25, 2017, from Jawa Pos Culinary:
http://www.jawaposculinary.com/category/the-best-bakery-and-pastry-shop-surabaya/PT. X-cake-co-2
Jones, S. (2011). Brand like a Rockstar: Lessons from Rock
'n Roll to Make Your Business Rich and Famous
(Vol. 1). Austin: Greanleef Book Group.
Keller, K. L. (1993, n.d.). Conceptualizing, Measuring, and
Managing Customer-Based Brand Equity. Journal
Of Marketing, 57(1).
doi:http://dx.doi.org/10.2307/1252054
Keller, K. L. (1998). Strategic Brand Management. Building, Measuring, and Managing Brand Equity.
Kotler, P., & Keller, K. L.(2016). Marketing Management,
Global Edition (Vol. 15). Pearson. New York: Pearson.
PT. X. (2015). PT. X.com. Retrieved February 25, 2017, from
PT. X: http://PT. X.com/category/stories/
Liemmongan, Joseph. Interview with K & A. Initial Interview with Founders of PT. X. Surabaya, East Java, Indonesia. 27 Feb. 2017
Liemmongan, Joseph. Interview with A. Second Interview with Founders of PT. X. Surabaya, East Java, Indonesia. 10 May. 2017
Lind, D., Marchal, W., & Wathen, S. (2013). Statistical
Techniques in Business & Economics (15th ed.). .
New York: McGraw-Hill/Irwin.
Macdonald, E., & Sharp, B. (2000, n.d.). Brand Awareness Effects on Consumer Decision Making for a Common, Repeat Purchase Product: A Replication.
Journal of Business Research, 48. Retrieved January
2017, from
http://s3.amazonaws.com/academia.edu.documents/ 46589218/Brand_Awareness_Effects_on_Consumer
_Deci20160618-25037-1063kl0.pdf?AWSAccessKeyId=AKIAIWOWYYG Z2Y53UL3A&Expires=1488207307&Signature=0z 157epdRuWaTOSsd%2F1hcOP2oY4%3D&respons e-content-disposition=inlin
Markowski, C., & Markowski, E. (1990). Conditions for the
Effectiveness of a Preliminary Test of Variance. The
American Statistician, 44.
Maulana, F. S. (2015, April 20). jawapos.com. (Jawa Pos)
Retrieved February 25, 2017, from Jawa Pos: http://www2.jawapos.com/baca/artikel/16014/Sama -Sama-Tekankan-Tekun-dan-Fokus
McMahon, H. (1980). TV Loses the 'Name Game' But Wins
Big on Personality. Advertising Age, 54.
Miles , M., Huberman , M., & Saldaña, J. (2014). Qualitative
Data Analysis: A Methods Sourcebook. London: SAGE.
Mirabi, V., Akbariyeh, H., & Tahmasebifard, H. (2015, January). A Study of Factors Affecting on
Customers. Journal of Multidisciplinary Engineering
Science and Technology, 2(1), 267-273.
Oxford. (2017). Trend. Retrieved June 16, 2017, from Oxford
Living Dictionaries:
https://en.oxforddictionaries.com/definition/trend Phan, T. A., & Mai, H. P. (2016, September). Determinants
Impacting Consumers’ Purchase Intention: The Case of. International Journal of Marketing Studies.
Retrieved from
http://www.ccsenet.org/journal/index.php/ijms/articl e/view/61260
Potter, N., & Hotchkiss, J. (1995). Food Science. New York:
Chapman and Hall.
Ramya, N., & Ali, M. (2016, n.d.). Factors affecting
consumer buying behavior. International Journal of
Applied Research 2016, 76-80.
Riezebos, R. (2003). Brand Management. London: Pearson
Education.
Rindell, A. (2008). What do Brands mean to us?: A short
introduction to brand research within Consumer Culture Theory. HAAGA-HELIA University of Applied Sciences. Retrieved from https://theseus32-kk.lib.helsinki.fi/bitstream/handle/10024/97161/wha t_do_brands_mean_to_us.pdf?sequence=1
Saunders, M., Lewis, P., & Thornhill, A. (2009). Research
methods for business students. New York: Prentice Hall.
Sekaran, U., & Bougie, R. J. (2016). Research Methods For
Business: A Skill Building Approach, 7th Edition.
Chichester: John Wiley & Sons.
Shah, S. S., Aziz, J., Jaffari, A. R., Waris, S., Ejaz, W., Fatima, M., & Sherazi, S. K. (2011, n.d.). The Impact
of Brands on Consumer Purchase Intentions. Asian
Journal of Business Management, 105-110.
Surabaya Dalam Angka (2016). Surabaya Dalam Angka.
Surabaya: Badan Pusat Statistik. Retrieved from https://surabayakota.bps.go.id/website/pdf_publikasi /Kota-Surabaya-Dalam-Angka-2016.pdf
Tharmi, U., & Senthilnathan, S. (2012, May). The Relationship of Brand Equity to Purchase Intention.
IUP Journal of Marketing Management.
Westwood, R. (2015, July). Three Ways to Build Brand
Loyalty. Retrieved 05 19, 2017, from Forbes: https://www.forbes.com/sites/ryanwestwood/2015/0
7/30/three-ways-to-build-brand-loyalty/2/#7437598303e1
Wongso. W. (2017). Data Karyawan PT. X. Surabaya: HRD
PT. X.
Yamane, T. (1967). Statistics: An Introductory Analysis.
New York: Harper and Row.
Yin, R. (2008). Case Study Research: Design and Methods.
London: Sage
Zeithaml, V. A. (1998, July). Consumer Perceptions of Price, Quality and Value: a means-end model an synthesis