ANALYZING THE INFLUENCE OF BRAND IMAGE, PERCEIVED
PRICE AND PERCEIVED QUALITY ON CONSUMER BUYING
DECISION OF LOW COST GREEN CAR (CASE STUDY OF:
ASTRA TOYOTA AGYA AT MANADO)
ANALISIS PENGARUH DARI CITRA MEREK, PERSEPSI HARGA DAN PERSEPSI
KUALITAS PADA KEPUTUSAN PEMBELIAN KONSUMEN DARI MOBIL MURAH
RAMAH LINGKUNGAN (STUDI KASUS DARI: ASTRA TOYOTA AGYA DI MANADO)
David I. O. Lalujan
1, S. S. Pengemanan
2, W. J. F. Alfa Tumbuan
3 1, 2, 3Faculty of Economics and Business,International Business Administration (IBA), Management Program Sam Ratulangi University Manado, 95115, Indonesia
Email:1[email protected] 2[email protected] 3[email protected]
ABSTRACT
The Ministry of Industry issued a regulation No.33/M-IND/PER/7/2013 about production development of
LCGC On September 2013, and it’s has experienced impressive growth in Indonesia automotive sector
since 2013. LCGC is an abbreviation of Low Cost Green Car. Literally means 'cheap car environmental friendly' in Indonesian”mobil murah ramah lingkungan”.The main purpose of this research is to analyze what drive people to buying LCGC Astra Toyota Agya and measured by three dependent variables (brand image, perceived price and perceived quality) .This study is going to use multiple linear regression analysis to analyze the consumer buying decision to buy the LCGC Astra Toyota Agya. The numbers of respondents are 53 consumers. The 53 consumers are taken from PT. Hasjrat Abadi Toyota Tendean, those consumers are already bought the LCGC Astra Toyota Agya in 2016 from month January-April. The result of this study shows that brand image, perceived price and perceived quality simultaneous have significant effects on consumer buying decision, brand image partial does not significant effect on consumer buying decision, perceived price and perceived quality partially has significant effect on consumer buying decision of LCGC Astra Toyota Agya in Manado. LCGC Astra Toyota Agya should improve their advertisement of Agya and quality even the quality of the car is the best on its class; such as adding side-beam impact for safety and a new extraordinary color. So it will increase buying interest and strengthen competitiveness of fellow LCGC products.
ABSTRAK
Departemen Perindustrian mengeluarkan No.33 regulasi / M-IND / PER / 7/2013 tentang pengembangan produksi LCGC Pada September 2013, dan itu telah mengalami pertumbuhan yang mengesankan di sektor otomotif Indonesia sejak 2013. LCGC adalah singkatan dari Low Cost Green Car. Secara harfiah berarti 'mobil murah ramah lingkungan' dalam Bahasa Indonesia 'mobil murah ramah lingkungan". Tujuan utama dari penelitian ini adalah untuk menganalisis apa yang mendorong orang untuk membeli LCGC Astra Toyota Agya dan diukur dengan tiga variabel dependen (citra merek, persepsi harga dan persepsi kualitas). Studi ini akan menggunakan analisis regresi linier berganda untuk menganalisis beli konsumen pada keputusan untuk membeli LCGC Astra Toyota Agya. Jumlah responden adalah 53 konsumen. 53 konsumen yang diambil dari PT. Hasjrat Abadi Toyota Tendean, mereka adalah konsumen yang sudah membeli LCGC Astra Toyota Agya pada tahun 2016 dari bulan Januari-April. Hasil penelitian ini menunjukkan bahwa citra merek, persepsi harga dan persepsi kualitas secara simultan memiliki pengaruh yang signifikan terhadap keputusan pembelian konsumen, citra merek secara parsial tidak berpengaruh tidak signifikan terhadap keputusan pembelian konsumen, persepsi harga dan persepsi kualitas secara parsial memiliki pengaruh yang signifikan terhadap keputusan pembelian konsumen LCGC Astra Toyota Agya di Manado. LCGC Astra Toyota Agya harus meningkatkan iklan mereka dari Agya dan kualitas bahkan kualitas mobil adalah yang terbaik di kelasnya; seperti menambahkan side-beam-impact untuk keselamatan dan warna yang luar biasa baru. Sehingga akan meningkatkan minat beli dan memperkuat daya saing sesama produk LCGC.
1. INTRODUCTION
Research Background
Automotive industry is a sector that has experienced impressive growth in Indonesia. Nielsen Global Survey of Automotive Demand (Nielsen, 2011) found that Indonesian consumers have strong intention to purchase new car in next two years. The growth of car industry in Indonesia supported by sales of LCGC which contributes with 259,74% on 2014 after the first launch on 2013. On September 2013, the Ministry of Industry issued a regulation No.33/M-IND/PER/7/2013 about production development of LCGC. The regulation was made to control the production and marketing of LCGC as the solution to reduce energy usage and pollution, also to maximize local component usage.
The main point of the regulation is regarding the technical specification, pricing, model, and other administrative requirement. The foreign brand that will produce this type of car has to delegate most of the production to local industry in Indonesia, but still under the foreign brand name. In practice, about 80% of this car component are made in Indonesia, but under technical specification of the ATPM(Agent Tunggal Pemegang Merek). LCGC is an abbreviation of Low Cost Green Car. Literally means 'cheap car environmental friendly’ in Indonesian ‘mobil murah ramah lingkungan”. LCGC is providing incentives to car manufacturers both local and foreign brand holders to produce cheap and environmentally friendly cars. LCGC has begun the process leading to exemption from import duty machining, assembly, and component-based LCGC (KEMENPERIND, 2012).
Nowadays in Manado where the research was implemented, we might have seen many or much small car in the streets passing by each other, the smallest car we have seen on the streets mostly are the LCGC and there are currently fifth brands that participate on government’s LCGC program, they are Astra Toyota Agya & Calya, Astra Daihatsu Ayla & Sigra, Honda Brio Satya, Suzuki Karimun Wagon R and Nissan-Datsun Go+ & GO. In this study is researched about consumers buying decision on people that have LCGC Astra Toyota Agya, because LCGC Astra Toyota Agya gain the most sold LCGC car on the class and why it is become the most sold LCGC.
Research objective
1. To know the simultaneous influence of brand image, perceived price and perceived quality on consumer buying decision of LCGC Astra Toyota Agya at Manado.
2. To know the partial influence of brand image on consumer buying decision of LCGC Astra Toyota Agya at Manado.
3. To know the partial influence of perceived price on consumer buying decision of LCGC Astra Toyota Agya at Manado.
4. To know the partial influence of perceived quality on consumer buying decision of LCGC Astra Toyota Agya at Manado.
Theoretical Framework
Consumer Buying Decision
According to Schiffman and Kanuk (2010), a decision is election to a choice of two or more alternatives selection. In other words, for someone to make a choice there must be an alternative option. When someone has the choice between buying or not buying, a choice between brand X or brand Y, or the option to do A or B, The person is in a position to make a decision.
Kotler (2001:254), image is the set of beliefs, ideas, and impression that a person holds regarding an object. Kotler and Amstrong, (2006:52) state is, a brand identity for the seller or manufacturer of a product or service is a complex symbol that can convey up to six levels of understanding as follows:
1. Attribute: a brand can be reminiscent of certain attributes.
2. Benefits: attributes must be translated into the functional benefits and emotional. 3. Value: the brand also says something about the value of the manufacturer. 4. Culture: a brand may also symbolize a particular culture.
5. Personality: a brand can reflect a particular personality.
User a brand implies the type of consumer who buys or use of a product.
Perceived Price
The concept of perceived price as quoted in Zeithaml (1988). “From the Consumers perspective, price is what is given up or sacrificed to obtain aproduct”. As quoted from Dickson and Sawyer (1985) and Zeithaml (1982) in Zeithaml (1998) studies of relationship between price and quality reveal that consumers do not remember the actual price of products that is why they build their own perception aboutthe price itself which later acknowledged as “perceived price”.
Perceived Quality
Perceived quality is a critical element for consumer decision making; consequently, consumers will compare the quality of alternatives with regard to price within category (Jin and Yong, 2005). Perceived quality is defined as the consumer’s judgement about a product’s overall excellence or superiority.
Previous Research
Chung, Dawn and Sun-Jin (2009) the results is brand image strongly influences Korean consumer’sproduct evaluation of aesthetics, performance, brand and technical prestige, purchase attitudes and the purchase intention. Ratama R. (2013) The results of this study proves that buying interest which was built-based perceived quality able to direct and in the end will encourage the achievement of purchasing decision the appropriate target, perceived quality indirectly affect the purchasing decision. Yee and San (2011), from this research majority of customers will consider the quality when they intend to purchase cars. This result is further supported which indicate that perceived quality have positive association with purchase decisions.
Conceptual Framework
H2
H3
H4
Brand
Image (X1)
Perceived
Quality (X3)
Buying Decision
(Y)
Perceived
H1 Figure 1.Conceptual Framework
Source: Theoretical Review
Research Hypotheses
H1 : Brand image, perceived price and perceived quality have simultaneous influence on consumer buying decision of LCGC Astra Toyota Agya at Manado.
H2 : Brand image has partial influence on consumer buying decision of LCGC Astra Toyota Agya at Manado.
H3 : Perceived price has partial influence on consumer buying decision of LCGC Astra Toyota Agya at Manado.
H4 : Perceived quality has partial influence on consumer buying decision of LCGC Astra Toyota Agya at Manado.
2. RESEARCH METHOD
Types of ResearchThis research is causal type of research where it was investigated the brand image, perceived price and perceived quality on consumer buying decision of LCGC Astra Toyota Agya at Manado. This research uses quantitative method and multiple regression analysis.
Place and Time
The location of this study was implemented in Manado City, North Sulawesi, Indonesia from February up to April 2016.
Population
The research populations are for Manado people's that already have LCGC Astra Toyota Agya. This research took 53 persons as respondent which already have LCGC Astra Toyota Agya to filling the questionnaire of LCGC Astra Toyota Agya in Manado. The 53 respondents is where those who bought the car in 2016 from month January to April. They were gathered fromPT. Hasjrat Abadi Toyota Tendean.
Data Collection Method
The research is used primary data. Primary Data refer to information obtained first-hand by researcher on the variable of interest for specific purpose of study. The researcher gets primary data from the result of questionnaires and spread questionnaire to collect the primary data.
Operational Definition of Research Variable
1. Brand Image (X1)
Brand image can be defined as the meaning that the consumers identify with the product or as the sum of their understanding of the product. Brand image is the result of impressions of consumers gained from various sources about the brand. (Karpat, 2000:32).
2. Perceived Price (X2)
Perceived Price is the tendency of consumers to use prices in giving an assessment of the suitability of the product benefits. (Stanton, 1998)
Consumer opinions of a product’s (or a brand’s) ability to fulfill his or her expectations. (Athiyaman, 1997; Bejou, et al, 1996).
4. Consumer Buying Decision (Y)
The process by which consumers identify their needs, collect information, evaluate alternatives, and make the buying decision.
Data Analysis Method
Validity and Reliability Test
Analyzing the validity of the questionnaires, Pearson Product Moment is used. An instrument measure is valid if the instrument measure what ough to be measured. Reability test is esthabilished by testing for both consistency and stability of the answer question. Alpha Cronbach is realiable coefficients that can indicate how good items in asset have positive correlation one another (Sekaran 2006:177).
Multiple Regression Analysis Model
Multiple Regression is an extension of simple linear regression. It is used when people want to predict the value of a variable based on the value of two or more other variables. The variable people want to predict is called the dependent variable using to predict the value of the dependent variable are called the independent variables. A statistical tool that allows you to examine how multiple independent variables are related to a dependent variable. Once you have identified how these multiple variables relate to your dependent variable, you can take information about all of the independent variables and use it to make much more powerful and accurate predictions about why things are the way they are. This latter process is called Multiple Regression (Higgins, 2005:2). The formula of multiple regression models in this research is shown below:
Y = a + β1X1+ β2X2+ β3X3+ e
Whereas:
Y : Consumer Buying Decision a : Intercept
β1-β3 : Regression Coefficient of Each Variable X1 : Brand Image
X2 : Perceived Price X3 : Perceived Quality e : error
3. RESULT AND DISCUSSION
Reliability Test
“The minimum value of cronbarch’s alpha must be 0.6. It is better if the value is above 0.6” (Sekaran, 2003).
Table 1. Reliability Test
No Variables Cronbach’s Alpha
2 Perceived Price .804 3 Perceived Quality .884 4 Consumer Buying Decision .768
Source: Data Processed (2016)
Validity Test
The purpose of validity test is to know whether the instrument is valid or not. If the correlation coefficient between the value of one indicator and the total value of all indicators is positive and more than or equal 0.3 (r≥ 0.3), then the instrument is considered as valid.
Classical Assumption Test
Multicollinearity Test
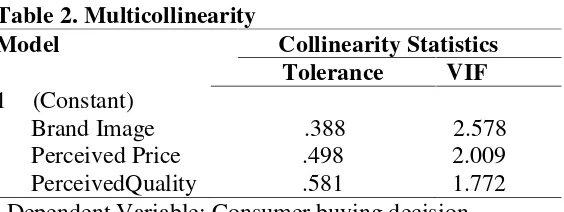
Table 2. Multicollinearity
Model
Collinearity Statistics
Tolerance
VIF
1
(Constant)
Brand Image
.388
2.578
Perceived Price
.498
2.009
PerceivedQuality
.581
1.772
a. Dependent Variable: Consumer buying decision
Source: SPSS Data Analysis, 2016Since tolerance value of brand image is 0.388, perceived price 0.498 and perceived quality 0.581 which are more than 0.2. The VIF value of brand image is 2.578, perceived price 2.009 and perceived quality 1.772 which are less than 10 show that the model concluded to be free from multicollinearity.
Heteroscedasticity Test
Heteroscedasticity occurs of the dots form certain patterns. In this research the dots spreading above and below of zero point in ordinate. This is proved that there is no heteroscedasticity in this regression.
Normality Test
Normality test can be identifying by using graph of P-P Plot. The data will distribute normally if the value of P-P Plot is near diagonal line of the graph. The dots are spreading near the diagonal line and follow the direction of the diagonal line. Therefore the normality test is completed.
Multiple Regression Analysis
Table 3. Multiple Regression Result
Model Unstandardized
Coefficients
Standardized Coefficients
t Sig.
B Std. Error Beta
(Constant) .212 .274 .773 .443
1 Perceived Price .327 .093 .307 3.506 .001 PerceivedQuality .487 .069 .574 7.078 .000
a. Dependent Variable: Consumer buying decision
Source: SPSS Data Analysis, 2016
The equation as follows:
Y = 0.212 + 0.155 X1 + 0.327 X2 + 0.487 X3
The interpretation of the equation is:
1. Constant 0.212 shows the effect of brand image (X1), perceived price (X2), perceived quality (X3) to consumer buying decision (Y). It means that, in a condition where all independent variables are constant (zero), consumer buying decision (Y) as dependent variable is predict to be 0.212.
2. 0.155 is the coefficients of X1 (Brand Image) meaning that if there is one unit increasing in X1 while other variables are constant then Y is predicted to increase by 0.155. 3. 0.327 is the coefficients of X2 (Perceived Price) meaning that if there is one unit
Model R R Square Adjusted R
Square
Std. Error of the Estimate
1 .902a .813 .802 .25313
a. Predictors: (Constant), Perceived Quality, Perceived Price, Brand Image b. Dependent Variable: Consumer Buying Decision
Source: SPSS Data Analysis, 2016
The value of R is 0.902 indicating a substantial positive association between independent variable and dependent variable. The value of R2 is 0.813 means that 81.3% brand image (X1), perceived price (X2), and perceived quality (X3 as independent variables have strong positive association and affects consumer buying decision (Y) while the rest 18.7% is affected by other factors that are not included into this research.
Hypothesis Testing
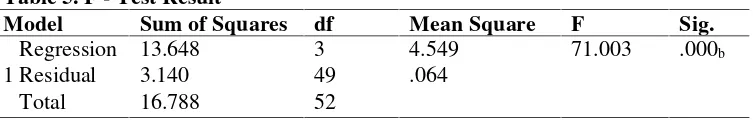
The result is: Fcount(71.003) > Ftable(3.18). Since Fcountis greater than Ftable, so H0is rejected and H1is accepted, meaning independent variables simultaneously influence the dependent variable.
Table 6. T–Test Result
Table 5. F - Test Result
Model Sum of Squares df Mean Square F Sig.
Regression 13.648 3 4.549 71.003 .000b 1 Residual 3.140 49 .064
Total 16.788 52
a. Dependent Variable: Consumer Buying Decision
b. Predictors: (Constant), Perceived Quality, Perceived Price , Brand Image
Model Unstandardized
Brand Image .155 .096 .160 1.615 .113 1 Perceived Price .327 .093 .307 3.506 .001 PerceivedQuality .487 .069 .574 7.078 .000
a. Dependent Variable: Consumer buying decision
Source: SPSS Data Analysis, 2016
The result is: It was accepted if tcount> ttable.Table above shows that brand image tcountis 1.615 and since the level of significant is 5% then the ttableis 2.01. The result is: 1.615<ttable= 2.01. Since the tcountis smaller than ttablethen it means that variable brand image does not effect on consumer buying decision. Therefore, H2 is rejected. Next table shows that perceived price tcountis 3.506. The result is: tcount= 3.506 > ttable= 2.01. Since the tcountis greater than ttablethen H0is rejected and H1is accepted. It means perceived price effects on consumer buying decision. Therefore, H3is accepted. Next table shows that perceived quality tcountis 7.078. The result is: tcount= 7.078> ttable = 2.01. Since the tcountis greater than ttablethen H0is rejected and H1is accepted. It means that variable perceived quality has influences significantly on consumer buying decision. Therefore, H4is accepted.
Discussion
Brand Image and Consumer Buying Decision
This research found that brand image does not influence on consumer buying decision of LCGC Astra Toyota Agya in Manado. A good condition of perform, technology that dynamically updated, good service that LCGC Astra Toyota give can make the brand image better. The respondent also did not agree with the current serve that make their decision to make them bought LCGC Astra Toyota Agya. Brand image is the one of most important factors that influences to determine the quality of goods or services to consumer buying decision. The purpose and goals is with the presence of a positive brand image it considered able to support the quality of goods and services. So consumers will judge the fit or quality with the positive image of its brand. Customers rely on branded products and mostly prefer to buy products with well brand name (Malik et al., 2013). consumers tend to form a more positive impression and believe for a product that has a good brand image because a good brand image of the brand also determine the quality of a car, in this study LCGC Astra Toyota Agya considered to have excellent quality in terms of its product, so it can be deciding factor for consumers buying decision, even in these research brand image did not influence the consumer buying decision.
Perceived Price and Consumer Buying Decision
Perceived Quality and Consumer Buying Decision
This research found that perceived quality has significantly influence on consumer buying decision. This finding has supported by Yee. C. Johnn and San. N. Cheng (2011). Customers will consider some risk when they want to purchase cars because car is one of the expensive asset and most of the consumer perceive that car should be long lasting. Therefore, they face uncertainty if the purchase the unsuitable car that result in poor performance, embarrassment, poor self-image and unsafely, which cause them lost in financial risk, physical risk, social risk and performance risk. The perceived quality is the priority when to buy a car and this research found why the LCGC Astra Toyota is the most sold LCGC than the fellow LCGC products; it is because of the quality. Consumers perceives for quality and their choose LCGC Astra Toyota Agya.
4. CONCLUSION AND RECOMMENDATION
Conclusions
There are four constructive findings that can be concluded from the overall result in this research, which are listed as follow: s
1. Brand image, perceived price and perceived quality simultaneously does significant effects on consumer buying decision of LCGC Astra Toyota Agya in Manado.
2. Brand image partially does not have significant effect on consumer buying decision of LCGC Astra Toyota Agya in Manado.
3. Perceived price partially has significant effect on consumer buying decision of LCGC Astra Toyota Agya in Manado.
4. Perceived quality partially has significant effect on consumer buying decision of LCGC Astra Toyota Agya in Manado.
Recommendations
Therefore, several recommendations given are:
1. LCGC Astra Toyota Agya should promoting and improve the advertisement of Agya and adding more extra feature of the car, such as extraordinary color so it could have been recognized easily from most of the people so it could improving the selling of LCGC Astra Toyota. Because from the world of mouth Toyota have the strongly brand image through the product named and called‘Kijang’.
2. The prices of LCGC Astra Toyota Agya are outreach from it terms LCGC, which means Low Cost Green Car. It should be following the regulation of LCGC itself. By doing so, LCGC Astra Toyota Agya could be affordable for all Indonesia people. “Let’s Go Beyond” will be very meaningful if the prices revisted.
3. LCGC Astra Toyota Agya should improve their quality even the quality of the car is the best on its class. Such as adding more safety and performance feature. So it will increase buying interest and strengthen competitiveness of fellow LCGC products.
4. For the future research, it is suggested the next researcher should add more variable or intervening to make a better result for the influence on consumer buying intention.
REFERENCES
Caldwell DM, Ades AE, Higgins JPT. Simultaneous comparison of multiple treatments: combining direct and indirect evidence.BMJ2005; 331: 897-900.
Chung, J-E., Dawn, T., P., Sun-Jin, H., (2009). Effects of Country-of-Manufacture
and Brand Image on Korean Consumers’ Purchase Intention. Journal of Global Marketing, ISSN 0891-1762, 22:21-41.
Jin, B and G.S Yong, (2005). Integrating effect of consumer perception factors in predicting private brand purchase in a Korean discount store context. Journal of Consumer Marketing, DOI: 10.1108/07363760510589226. Retrieved on January 10th, 2014. Vol. 22 (2), Pp. 62-71.
Kotler and Gary (2001), Principles of Marketing, International Edition; 9th edition, Pearson Education Inc, New Jersey.
Kotler, Philip and Armstrong, (2006), Principles of Marketing. Kotler & Amstrong Pearson Education,Inc., New Jersey.
Malik, M. E.,Ghafoorm M. M., Iqbal, H.K., Ali, K., Hunbal, H., Noman, M., and
Ahmad, B., (2013). Impact of Brand Image and Advertisement on Consumer Buying Behavior. World Applied Sciences Journal 23 (1): 117-122, 2013 ISSN 1818-4952. Peraturan Kementerian Perindustrian Republik Indonesia No.33 /M-IND/PER/7/2013tentang
Pengembangan Produksi Kendaraan Bermotor Roda Empat yang Heamat Energi dan Harga Terjangkau.
Ratama, R. (2013). Analysis Perceived Quality, Brand Image and Perceived Value on Buying Interest and Implications for Purchasing Decision (Case Study on Singtel Cellular Card in Malaysia).International Journal of Behavior Marketing. Vol. 5, No. 10.
Schiffman, Leon G. and Leslie Lazar Kanuk, (2010), Consumer Behavior, 10th Edition, New Jersey : Pearson Education.
Sekaran, U., (2003). Research Method for Business, A Skill Building Approach.Fourth Edition. John Wiley & Sons, Inc.
Sekaran, U., and Bougie, R., (2006). Research Methods for Business, a Skill Building Approach. 5thedition. Wiley United Kingdom.
Yee, John., C and San, Cheng., N., (2011). Consumer’s Perceived Quality, Perceived Value and Perceived Risk Towards Purchase Decision on Automobile. American Journal of Economic and Business Administration, ISSN 1945-5488. Retrieved on January 15th, 2014. Vol. 3, Pp. 47-57.
Yaseen N., M, Tahira., Gulzar A. and Anwar A. (2011). Impact of Brand Awareness, Perceived Quality and Customer Loyalty on Brand Profitability and Purchase Intention: A Resellers View. Interdisciplinary Journal of Contemporary Research in Business, Vol
3. No 8. December 2011. Available at: http://www.journal-archieves13.webs.com/833-839.pdf. Accessed August, 24th 2014. Pp.833-839.