133
The Impact of Perceived Advertising Spending and Price Promotion on Brand
Equity:A Case of ABC Brand
Kevin Edward Nurcahya
International Business Management Program, Petra Christian University Jl. Siwalankerto 121-131, Surabaya
E-mail: [email protected]
ABSTRACT
Intense competition in Indonesian beverage industry lead many corporations to spend trillion rupiah on marketing communication, such as advertising and price promotion with the hope of increasing brand equity. However, the question is whether promotional activities in this industry amplify or attenuate the brand equity of a product. Therefore, this paper aims to model the impact of perceived advertising spending and price promotion on brand equity, measured through consumer perceptions, specifically in the case of ABC brand brand.
This study includes explanatory research with the samples taken for one of PT XYZ’s flagship products, ABC brand. All of the respondents are Surabaya people, altogether 123 respondents. The sampling method used was simple random sampling. A quantitative approach was employed, using 25-item, 5-point Likert scale questionnaires. Multiple regression analysis methods in SPSS 21 program were used to examine the result. The result has several conclusions. First, perceived advertising spending has significant effect on brand equity and three out of for brand equity dimensions, namely perceived quality, brand awareness and brand loyalty. Second, price promotion also has significant impact on brand equity and three out of four dimensions of brand equity: brand loyalty, perceived quality and brand association.
Keywords: Perceived advertising spending, price promotion, brand equity, Surabaya.
ABSTRAK
Persaingan yang ketat dalam industri minuman di Indonesia menyebabkan banyak perusahaan menghabiskan triliunan rupiah pada komunikasi pemasaran, seperti iklan dan promosi harga dengan harapan dapat meningkatkan ekuitas merek. Namun, pertanyaannya adalah apakah promosi ini memperkuat atau melemahkan ekuitas merek. Oleh karena itu, penelitian ini bertujuan untuk menguji dampak persepsi belanja iklan dan promosi harga pada ekuitas merek, yang diukur melalui persepsi konsumen, khususnya dalam kasus merek ABC brand. Penelitian ini merupakan penelitian yang bersifat menjelasan hubungan antar variabel. Seluruh responden berasal dari wilayah Surabaya, dengan total 123 responden. Metode sampling yang digunakan adalah metode sampel acak. Penelitian dilakukan dengan pendekatan kuantitatif menggunakan kuesioner yang terdiri dari 25 butir pertanyaan yang diukur dengan 5-poin skala Likert. Metode analisis regresi berganda yang terdapat dalam program SPSS 21 digunakan untuk mengolah data. Hasil yang didapatkan mencapai beberapa kesimpulan. Pertama, belanja iklan memiliki efek yang signifikan terhadap ekuitas merek dan tiga dari empat dimensi ekuitas merek, yaitu persepsi kualitas, kesadaran merek dan loyalitas merek. Kedua, promosi harga juga memiliki dampak yang signifikan terhadap ekuitas merek dan dua dari empat dimensi ekuitas merek: persepsi kualitas dan asosiasi merek.
Kata Kunci: Persepsi belanja iklan, promosi harga, ekuitas merek, Surabaya.
INTRODUCTION
Indonesia is still a favorable place for the food and beverage industry. Due to the increasing purchasing power, increasing wage, and growing population of middle class income people of as well as growing number of modern retail outlets, it became the main driver of growth demand
134 industry. In order to win the competition, every company must try to achieve the goal of creating and retaining customers. In order to achieve that goal, they should strive to produce and deliver goods and services that consumers want at a reasonable price and quality. Thus, every company should be able to understand the wants and needs of consumers to be able to satisfy them (Tjiptono, 2002).
In the other side, due to a lot of products offered by new players, society begins to think more selective in choosing a product, so that they will get usefulness or benefits they were looking for of a product. Marketers who are facing fierce competition will always be motivated to develop and grab the market share. One way to grab the market share is the brand, the brand itself can become the competitive advantage of the firm to grab or maintain its market (Rosvita, 2010). Brand helps firms to communicate its value to the consumers and get connected to the minds and hearts of the consumers (Keller, 2007). If a product only provides functional benefits, a brand can provide both functional and emotional benefits resulting in customer satisfaction (Hankinson and Cowking, 1996).
These days, in order to maintain loyal consumers, marketers must work harder with branding strategy to strengthen the brands (Hameed, 2013). The strategies used by companies usually using promotional activities with some budget spent for advertising and price promotion (Selvakumar and Vikkraman, 2011). Advertising is hoped to protect companies’ brands and maintain its loyal customers from competitors (Agrawal, 1996).
For many companies, brand equity is one of their concerns and priorities (Keller and Lehmann, 2006). According to Keller (2003) and Aaker (1991), brand equity is the value of the brand in the market. Many large corporations spend several trillion rupiah on marketing communication, such as advertising and price promotion with the hope of increasing brand equity. However, the real question is, do advertising and price promotion in Ready-to-Drink Tea industry amplify or attenuate the brand equity of a product? And how should managers allocate resources to advertising and price promotion? Although many people believe that advertising spending increase overall brand equity and price promotion reduce the overall brand equity, there is still lack of proof in the non-durable goods industry. Therefore, this paper aims to model the impact of perceived advertising spending and price promotion on each of the elements of brand equity, measured through consumer perceptions, specifically in the case of ABC brand, a product from PT XYZ.
LITERATURE REVIEW
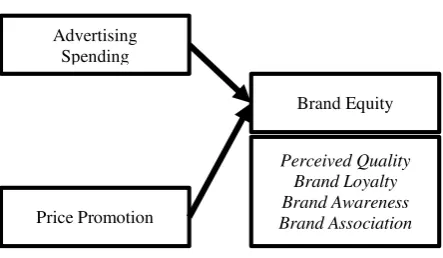
The important concepts relevant to this research are promotion which consists of perceived advertising spending and price promotion, and brand equity which consist of brand awareness, brand loyalty, perceived quality and brand association.
Brand Equity
According to Aaker (1997) brand equity can add or reduce the total value of a specific products or services perceived by the consumers. Brand equity is able to become a competitive advantage of a firm in the market because it creates a point of differentiation compare to other brands (Aaker 1991). Aaker (1997), Durianto et al (2004) and Tjiptono (2005) grouped the brand equity in four main dimensions, namely: brand awareness, brand association, perceived quality, and brand loyalty.
Perceived Quality
Perceived quality is consumers’ assessment of the advantages and superiority of the product/brand as a whole compare to other brands (Aaker 1991) Therefore, the perceived quality is not based on the manager or the market opinion, but the consumers’ subjective evaluation toward the quality of a specific product/brand. According to Aaker (1997) consumers’ ability to perform quality judgment is depends heavily on the intrinsic and extrinsic attributes such as brand image, brand name, advertising programs, and what the consumers fell about the price while they are trying to buy a product/brand.
Brand Loyalty
Brand loyalty is the core element of brand equity dimensions. The loyal customers will be a barrier to entry for competitors. Brand loyalty can be a tool to get an opportunity to set a price, giving the producers enough time to respond to the innovation from competitors and could be a barrier of fierce price competition (Aaker, 1991). Oliver (1997) defines brand loyalty a commitment to rebuy product or service consistently in the future. In the other words, brand loyalty is representing how close a consumer connects to a specific brand (Simamora, 2004; Durianto, 2004).
According to Mowen & Minor (2002), brand loyalty is viewed as the extent to which a customer showed a positive attitude towards a brand, has a commitment on a particular brand, and intend to continue to buy it in the future. Meanwhile, According to Giddens (2002), there were few signs of consumers who have loyalty to brands: consumer has a commitment to the brand, consumers are loyal would recommend the brand to others, and do not make the purchase consideration in return such products.
Brand Awareness
135 brands that consumers remember without reminding them about the slogan, logo, tagline, etc. In addition, Top of Mind (TOM) is one the best predictors of consumer choice (Romaniuk, Sharp, Paech & Driesener, 2004). Woodside & Wilson (1985) also confirmed that the higher the TOM, the higher the purchase intention and the higher the relative purchase of the brand.
Brand Association
Brand association is everything that is associated or related with the consumers’ memory of a brand (Aaker 1991 and Simomora 2003). These associations can be an attribute of a product, a spokesperson or a particular symbol. A strong brand association can help customers to process and receive information, become a reason to buy that product as well as creating a positive attitude and feelings toward the brand (Aaker, 1991). Schiffman and Kanuk (2000), added that a positive brand associations are able to create a brand image in accordance with the expectation of consumers, so it create consumer confidence in purchase decision process. Durianto, et al (2004), defines brand association as the impression that comes to someone’s mind related to his memory about a brand.
Aaker (1991) also stated that brand association consists of 3 perspectives which are: brand-as-product (value), the brand-as person (brand personality) and the brand-as-organization (organizational associations). Brand-as-product (value) focuses on the brands’ value proposition.
Perceived Advertising Spending
Perceived advertising spending is defined as consumer perception of advertising frequency and expenditure as agreed by Ha et al. (2011) and Hameed (2013). In this study the writer focuses on determining the effects of perceived advertising spending on brand equity, measured through consumer perceptions. Companies use advertising to communicate brands’ functional and emotional values, since it is believed as a powerful tool to promote the brand (Chernatony, 2006). There are several aspects that need to be considered when a company wants to see the effectiveness of advertising: content or the message, execution, and frequency of advertising seen by the consumers (Batra, Myers and Aaker, 1996).
Price Promotion
According to Kotler and Keller (2012), price promotion is part of sales promotion. Sales promotion is one of the most important parts in marketing campaigns, which is used to stimulate faster and bigger (in terms of volume/number) sales of specific products or services. Sales promotion mostly in the form of incentive tools for the consumers (Kotler & Keller, 2012). Advertising offers consumer a reason to buy, in the other hands, sales promotion offers an incentive for consumers to buy the products (Kotler & Keller, 2012). Agrawal (1996) defines price promotions as an offensive strategy that can be used to attract the loyal consumers from other competing brands.
Relationship between Concepts
Figure 1. Relationship between concepts
Previous studies have found out that perceived advertising spending and price promotion have relationship with brand equity:
In their research, Cobb-Walgren, Beal, and Donthu (1995) conclude that the money spent on advertising has positive effects on each dimension of brand equity and brand equity as a whole. In the other hand, most previous researches on sales promotions has focused on price promotions; past literature has mainly proposed that price promotions have a negative impact on brand equity (Buil, Chernatony, & Martinez, 2010; Selvakumar & Vikkraman 2011; Villarejo & Sanchez, 2005).
Keller (2007) concludes that advertising will lead to strong brand awareness, trigger unique and strong associations to memory of consumers, and result in positive brand feelings. Advertising can increase the scope and frequency appearance of a brand, as the result, it increase the brand awareness (Chu and Keh, 2006; Keller, 2007). Hence, the bigger the amount of advertising, the bigger brand awareness and associations of a brand, it will result in bigger brand equity. However in order to achieve those goals, a good design and great execution are needed. In addition, due to fierce competition in the saturated market, company should have creative and original marketing communication (Kapferer, 2004; Keller, 2007). This strategy helps company to get consumers’ attention and awareness and results in increasing brand equity (Buil, Chernatony, & Martinez, 2010). In conclusion, in order to increase the brand awareness, a company needs to increase their advertisement spending.
Additionally, creative and unique advertising can create a favorable, strong and unique brand association (Cobb-Walgren et al., 1995; Keller, 2007). The associations linked to the brand are images that consumer perceives after messages that the company sends through some advertising campaigns is recognized by them (Keller, Heckler & Houston, 1998). Advertising is also crucial in increasing brand associations. Frequent advertising increases the probability that a brand will be included in the consumers’ consideration, which makes consumer’s brand choice simpler. Thus it becomes habit of a consumer to buy that specific brand (Hauser and Wernerfeldt,1990).
There is also a significant relationship between perceived advertising spending and perceived quality.
Advertising Spending
Price Promotion
Brand Equity
136 Moorthy and Zhao (2000) suggest that increasing brand name recognition is the impact of frequent advertising. Intense advertising spending indicates company is investing a lot in brand or product. In addition, this action shapes high quality product perception of in customer’s mind (Aaker and Jacobson, 1994). Increasing amount of investment in a brand using marketing communication spending tools are not only results in higher perception of quality, but also increases the overall product value as supported by Archibald et al (1983). Hence, the more a brand is advertised; the more consumers have high perceived quality for that brand (Yoo et al., 2000).
Perceived advertising spending also has relationship with brand loyalty (Ha et al., 2011 and Hameed, 2013). Millions of dollars are invested every year on advertising which results in creating loyal customers and increasing brand loyalty to a specific brand or company (Chioveanu, 2008). Advertising is used to build and maintain brand loyalty, which protect firm’s loyal consumers from other related brands (Agrawal, 1996).
In contrast, promotional campaign based on lowering prices can make brands in jeopardy since it makes a consumers confusion; and leads to an image of unstable quality in the long-term (Winer in Villarejo & Sanchez, 2005). Price promotion believes to give short term benefit for the consumers, however, it is considered to weaken the brand equity of that brand (Yoo et al., 2000). Therefore, it is an unfavorable strategy to build strong brand equity using price promotion strategy, because in nature, price promotion creates a sense of short term benefit for their consumers. In addition, competitors can easily copy and counteracted the strategy (Aaker, 1991).
In conclusion, the seven concepts are connected to each other as shown by the graphs on the previous pages. This model is adapted from Selvakumar & Vikkraman (2011) who examined the effects of perceived advertising spending and price promotion on brand equity in several industries. The model shows that (1) Perceived advertising spending and price promotion have a direct effect on brand equity; and (2) Perceived advertising spending and price promotion also have direct effect on each elements of brand equity.
Some findings of the researches on consumer behavior, marketing mix and brand equity are as follows:
Boonghee Yoo et al. (2000) explored the relationships between selected marketing mix elements and the creation of brand equity. In their research, consumers’ perceptions of five selected strategic marketing elements: price, store image, distribution intensity, perceived advertising spending, and frequency of price promotions were investigated. One of the results in this study is as consumer seen advertising more frequent, not only create higher brand awareness and associations but also a more positive perception of brand quality, which leads to strong brand equity. The most influential factors which cause in decreasing brand loyalty is decreasing number of perceived advertising spending.
Other than that, this research find price promotion makes consumers to infer low product quality. They believe
that price promotion makes consumers to think only about promotion and not about the utility provided by the brand. The researchers also conclude that price promotions do not enhance brand associations.
Villarejo and Sanchez (2005) tested the impact of marketing communication and price promotion on brand equity. The researchers collected the data in a sample group of families which purchased durable goods. The significant result of this study explained perceived advertising spending showed a favorable causal relationship for three of the four dimensions of brand equity. The higher the spending on advertising for the brand, the better the quality of the product as perceived by the consumer, the higher the level of brand awareness and the more associations linked to the product. However, company’s high perceived advertising spending on a brand does not have a significant effect on consumers’ loyal behavior towards the brand. Price promotion as incentives to increase sales have been found to have a negative effect on brand equity, perceived quality and brand image.
Isabel Buil, Eva Martínez, And Leslie De Chernatony (2010) tested the effect of advertising and sales promotions, both monetary and non-monetary promotion, on brand equity. Monetary promotion is like price-off, cents-off coupons, rebates and non-monetary promotion is like premiums & sampling. The researchers conclude that perceived advertising spending has a positive effect on brand awareness. However, it does not always increase and enhance perceived quality and brand associations. The result is explained by the fact that advertising spending can reach a saturation point, a point where it cannot increase the brand equity anymore.
The effect of sales promotions on brand equity differs according to the type of promotional tool used and the type of product categories. Interestingly, monetary promotions were found to negatively influence perceived quality but had a non-significant impact on brand associations whereas non-monetary promotions had a positive effect on brand associations and had a non-significant impact on perceived quality.
Based on the research objectives, the writer hypothesizes the following:
Perceived advertising spending and price promotion simultaneously have significant impact on brand loyalty, brand awareness, perceived quality, brand association, and brand equity
Perceived advertising spending and price promotion individually have significant impact on brand loyalty, brand awareness, perceived quality, brand association, and brand equity.
RESEARCH METHOD
137 All the variables in this study will be measured using these measurement questions:
Perceived Quality (PQ) elements. ABC brand is a very good quality product (quality judgment); ABC brand offers products of consistent quality (quality judgment); ABC brand offers very reliable products (quality judgment); ABC brand is a quality leader within its category. (superiority of the product as a whole compare to other brands).
Brand Loyalty (BL) elements. I will buy ABC brand again. ( purchase intention ); I will not buy other brands if ABC brand is available at the store. (purchase consideration); ABC brand would be my first choice. (commitment); I consider myself to be loyal to ABC brand. ( positive attitude); I will recommend ABC brand to others. (recommend to others)
Brand Awareness (BAW) elements. I am aware of ABC brand brand (brand recognition); ABC brand is a brand of Tea Industry I am very familiar with – (brand recognition); I can recognize ABC brand among other competing brands – (brand recognition); I know what ABC brand looks like – (brand recall); When I think of Tea Industry, brand ABC brand is the first brand that comes to mind (Top of Mind).
Brand Association (BAS) elements. ABC brand is good value for the money (brand as product); ABC brand has refreshing personality (brand as personality); The company which made ABC brand has trusted credibility (brand as organization)
Perceived Advertising Spending (PAS) elements. Advertising campaign of ABC brand can be seen frequently; Advertising campaign of ABC brand can be easily seen everywhere; I think ABC brand brand is advertised more frequently, compared to competing brands; In my opinion, the ad campaigns for ABC brand costs a lot of money, compared to campaigns for competing brands.
Price Promotion (PP) elements. Price promotion for ABC brand is frequently offered; Price promotion for ABC brand can be found everywhere; I think price promotions for ABC brand are more frequent than for competing brands; I think price promotion of ABC brand , in general is very good.
By looking at ABC brand’s target market which is people with the age of 15-55 years (W. Hendra, personal communication, February 28, 2014), the population is restricted to the people who have this following criteria: Living in Surabaya; All gender with the age range of 15-55 years old; At least once have ever seen the promotional campaign for ABC brand; At least once ever consume ABC brand. In addition, Tabachnick and Fidell (1996) provide a comprehensive overview of the procedures used to determine regression sample sizes. He suggests sample size = 104 + m (m = Independent Variables). Thus using this formula, minimum sample size needed in this research is minimum 104 + 2 = 106. To collect the data, questionnaires with 130 questions were distributed among customers. Sample is collected by accidentally give the questionnaire to the respondents is crowded places such as universities, malls, department stores, and using online survey. In
addition, the researcher selects respondents who have certain characteristics, namely the respondent ever consume and see promotional campaign of ABC brand. The sample size of 130 customers was used to collect the data. Total 123 usable questionnaires were found to analyze the results. Invalid questionnaires were removed from the sample. The data further analyzed using IBM SPSS 21 program for Windows.
The data in this research will be analyzed using reliability test, validity test, linear regression and multiple linear regressions. In addition, multiple linear regressions is said to be a good model if they can fulfill classic assumption test (Santoso, 2001).
To test the validity of the measurement tools, it can be done by calculating the statements’ correlation value of each the data using product moment technique (Sudarmanto, 2013). Criteria that need to be fulfilled using product moment test is by comparing the value of r (coefficient correlation) calculated/tested with the r-table. If rtested > r-table, we fail to reject H0 or it means that the measurement tools are valid (Sudarmanto, 2013).
In this research, Cronbach Alpha formula is used to test the reliability of measurement scales. Generally, a construct/variable can be classified as reliable if it gives higher than 0.60 Cronbach Alpha (Santosa & Ashari, 2005). To test the normality, Kolmogorov-Smirnov test is used (Ghozali, 2011). Ghozali (2011) suggests that the decision rule is, if the significant value of Kolmogorov-Smirnov higher than the desired significant level (0.05), the residual of the data is normally distributed.
There are two tools to test whether multicollinearity exists in a regression model according to Ghozali (2011): VIF (Variance Inflation Factor) and Tolerance value. If the tolerance value is below 0.1 and VIF is higher than 10, thus there is multicollinearity in the regression model. In contrast, if the tolerance value is higher than 0.1 and VIF is less than 10, thus there is no multicollinearity exist in the regression model.
Heteroscedasticity test is conducted to check whether the variance of residuals among separate observations are different (Ghozali, 2011). To check the heteroscedasticity, Spearman Correlation Coefficient is used (Sudarmanto, 2013). The decision rule is: the value of tested correlation coefficient (r tested) should be compare with correlation coefficient’s table (r-table) for df=N-1-1 and desired alpha level (5%). If r tested < r-table thus H0 is accepted or there is no systematic relationship between the independent variables and the absolute value of its residuals. It means that heteroscedasticity does not exist.
In this research, Durbin-Watson test will be used to check the existence of autocorrelation. Criteria that needs to be fulfilled using Durbin-Watson (DW) test (Santoso, 2001):
138 method will used to analyze how strong perceived advertising spending and promotion affecting brand equity and each elements of brand equity. To test the accuracy of the multiple linear regression function, it must be tested using adjusted F-test, t-test, and R2 test (Ghozali, 2011).
The equations can be seen as follows:
Y_1 (BL) = α + β_11 (PAS) + β_21 (PP) + ε Y_2 (BAW) = α + β_12 (PAS) + β_22 (PP) + ε
Y_3 (PQ) = α+β_13 (PAS) + β_23 (PP) + ε Y_4 (BAS) = α+β_14 (PAS) + β_24 (PP) + ε
Y_5 (BE) = α + β_15 (AS) + β_25 (PP) + ε
Where :
Y = Dependent variables; BE = Brand Equity; PQ = Perceived Quality; BL = Brand Loyalty; BAW = Brand Awareness; BAS = Brand Association
α = Coefficient of intercepts
β1 = Coefficient of first independent variable; PAS = Perceived
Advertising Spending
β2 = Coefficient of second independent variable; PP = Price Promotion
ε = Error Terms
To check the significant impact of more than 1 independent variable, F-test is used. The F-value is the ratio of the mean squared of each term and mean squared error, that is, F = MeanSq(xi)/MeanSq(Error). In this research, hypothesis tested with the F-Test is as follows:
H0 : β1 = β2 = … = βk = 0 H1 : β1 ≠ β2 ≠ … ≠ βk ≠ 0
As the research is using 95% confidence level, therefore the significant level is 5%. If the significant value is higher than 0.05 or the F-value is lower than F-table, we fail to reject H0 or it means that the independent variable does not show a statistically significant relationship with the dependent variable.
In addition, t-test is also use to measure the significance of each independent variable in the regression model. The hypotheses tested in t-test for this research are as follows:
H0 : βk = 0 H1 : βk ≠ 0
The null hypothesis is rejected if the calculated t is greater than t value for n-2 degrees of freedom or if the P-value is lower than the typically 0.05 significant level (Cooper & Schindler, 2011).
Finally, R2 is used to see how many percent of the
dependent variable values can be predicted by the independent variable (Cooper & Schindler, 2011). In this case, the higher the adjusted R2, the better the model in
explaining the variability in dependent variable values. Adjusted R2 is preferred because it eliminates the bias due
to the number of independent variables (Ghozali, 2011).
RESULTS AND DISCUSSION
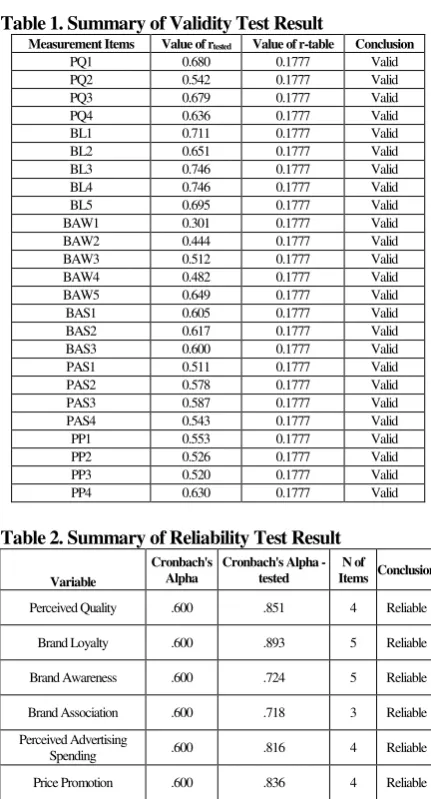
As the starting point the researcher will report the result of validity and reliability analysis. For validity analysis, Ghozali (2011) said that a questionnaire can be
classified as a valid questionnaire if the value of r (coefficient correlation) calculated/tested with the r-table. If r tested > r-table, it means that the measurement tools are valid (Sudarmanto, 2013). In this research 121 degree of freedom is used, and the significant level of 5%, the r-table is 0.1777
For the reliability analysis the researcher measures the reliability of the measurement items (instruments) using Cronbach Alpha formula, a construct/variable can be classified as reliable if it gives higher than 0.60 Cronbach Alpha (Santosa & Ashari, 2005).
Looking at the data below, the questionnaire is valid and reliable since it passed the validity and reliability tests.
Table 1. Summary of Validity Test Result
Measurement Items Value of rtested Value of r-table Conclusion
PQ1 0.680 0.1777 Valid
PQ2 0.542 0.1777 Valid
PQ3 0.679 0.1777 Valid
PQ4 0.636 0.1777 Valid
BL1 0.711 0.1777 Valid
BL2 0.651 0.1777 Valid
BL3 0.746 0.1777 Valid
BL4 0.746 0.1777 Valid
BL5 0.695 0.1777 Valid
BAW1 0.301 0.1777 Valid
BAW2 0.444 0.1777 Valid
BAW3 0.512 0.1777 Valid
BAW4 0.482 0.1777 Valid
BAW5 0.649 0.1777 Valid
BAS1 0.605 0.1777 Valid
BAS2 0.617 0.1777 Valid
BAS3 0.600 0.1777 Valid
PAS1 0.511 0.1777 Valid
PAS2 0.578 0.1777 Valid
PAS3 0.587 0.1777 Valid
PAS4 0.543 0.1777 Valid
PP1 0.553 0.1777 Valid
PP2 0.526 0.1777 Valid
PP3 0.520 0.1777 Valid
PP4 0.630 0.1777 Valid
Table 2. Summary of Reliability Test Result
Variable
Cronbach's Alpha
Cronbach's Alpha - tested
N of
Items Conclusion
Perceived Quality .600 .851 4 Reliable
Brand Loyalty .600 .893 5 Reliable
Brand Awareness .600 .724 5 Reliable
Brand Association .600 .718 3 Reliable
Perceived Advertising
Spending .600 .816 4 Reliable
Price Promotion .600 .836 4 Reliable
139
Table 4. Summary of F-test Result
Table 5. Summary of t-test Result No Independent
Table 6. Summary of Adjusted R2 Result
No Model R2 Adjusted R2
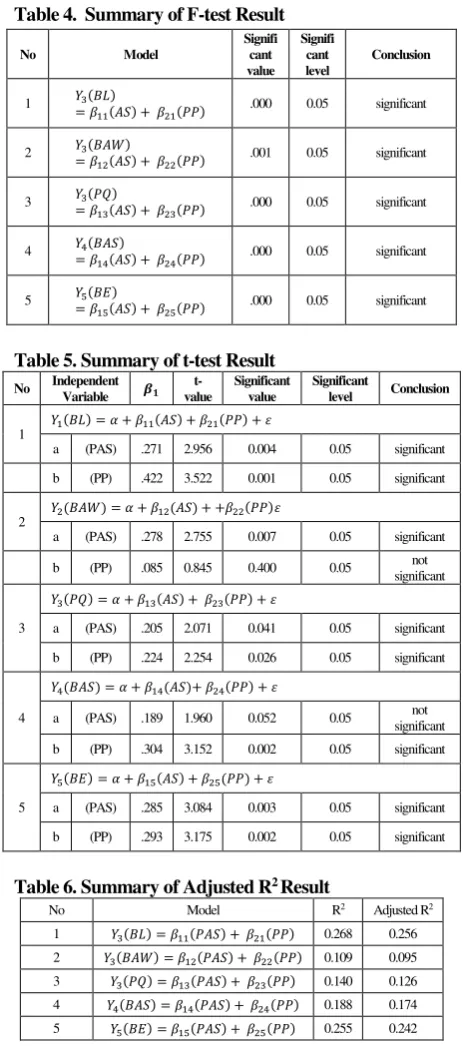
Based on the result, the F significant value of the first model is 0.000, or far below the significant level of 0.05. Thus it can be said that perceived advertising spending and price promotion have simultaneous significant influence on the brand loyalty of ABC brand.
For the individual effect of perceived advertising spending and price promotion on brand loyalty, the researcher found out perceived advertising spending individually has significant influence on brand loyalty (sig. t = 0.004). In addition, price promotion individually also has significant influence on brand loyalty (sig. t = 0.001). The higher the perceived advertising spending and price promotion spent by the company, the higher the brand
loyalty is likely to be, or vice versa. Shimp (1997) also believes that by reinforcing and focusing on the consumer’s “brand-related beliefs and attitudes”, higher perceived advertising spending will result in stronger brand loyalty.
The adjusted R2 of the impact of perceived advertising
spending and price promotion on brand loyalty is moderately low (25.6%) due to the fact that other factors such as brand image and brand trust are not included in this research to see the impact on brand loyalty (Rizan, Saidani, & Sari, 2012).
Comparing the result of this study with previous researches, there are several similarities and differences. First, comparing this study with a research from Yoo et al. (2000), it can be seen that the perceived advertising spending also positively influence brand loyalty. The major reason for a decrease in brand loyalty is the decrease in perceived advertising spending. Compared to the second research from Villarejo and Sanchez (2005), it is found out that perceived advertising spending is not proven to have influences on brand loyalty. This research has the object of consumer goods (non-durable) while Villarejo & Sanchez’s study is examining the industry of durable goods (washing machine). According to PT XYZ’s area sales manager, Wong Hendra, compared to washing machine industry, ABC brand is advertised more frequent (W. Hendra, personal communication, May 10, 2014). Thus, in washing machine industry, the producers might rarely advertise their product that will lead to insignificant impact of perceived advertising spending on brand loyalty. Most previous researches found out that price promotion had no relationship with brand loyalty Villarejo and Sanchez (2005) believed that although price promotion encourages consumers to make repeat purchases pattern, the consumer loses interest in the brand after the first time they try the product/brand. However, in this study the researcher found out that price promotion has positive significant impact on brand loyalty. The difference might be caused due to the difference in the object of this study. Gustin (2014) has found out that price promotion activities has significant positive impact on brand loyalty of ABC brand.
Secondly, based on Table 4., the F significant value in the second model is 0.001, or far below the significant level of 0.05. Thus it can be said that perceived advertising spending and price promotion have simultaneous significant influence on the brand awareness of ABC brand.
For the individual effect of perceived advertising spending and price promotion on awareness, the researcher found out perceived advertising spending individually has significant influence on awareness (sig. t = 0.007). However, price promotion individually does not have significant influence on brand loyalty (sig. t = 0.400). in addition, the higher the perceived advertising spending, the higher the brand awareness is likely to be, or vice versa.
However, only 9.5% of the variation in the brand awareness toward ABC brand can be explained by the variation in the perceived advertising spending and price promotion as the independent variables. The other 90.5% might be explained by other factors such as brand logo and the logo itself (Lucy, 2013). Lucy (2013) also explained that
140 brand awareness was heavily influenced by brand and brand logo. Both of them are very significant factor influencing the brand awareness.
Comparing the result of this study with other three previous researches, the result is similar compare to other previous researchers. First, comparing this study with a research from Yoo et al. (2000), it can be seen that the higher the perceived advertising spending, the higher brand awareness which leads to strong brand equity. For the second related research from Villarejo and Sanchez (2005), the result of this study also found out that perceived advertising spending showed a favorable causal relationship with brand awareness. In addition, brand awareness can be achieved using the effort of a company’s marketing communications toward brand equity. The third related research from Isabel Buil, Eva Martínez, And Leslie De Chernatony (2010) in which testing the effect of advertising and sales promotions, both monetary and non-monetary promotion on brand equity, and the result is the same. The research also revealed that perceived advertising spending has a positive effect on brand awareness. In contrast, as for the price promotion, this study also did not found any significant impact of price promotion toward brand awareness. Shimp (1997) believes that price promotion alone is not enough for increasing brand awareness.
Thirdly, based on Table 4., the F significant value in the third model is 0.000, or far below the significant level of 0.05. Thus it can be said that perceived advertising spending and price promotion have simultaneous significant influence on the perceived quality of ABC brand.
For the individual effect of perceived advertising spending and price promotion on perceived quality, the researcher found out perceived advertising spending individually has significant influence on perceived quality (sig. t = 0.041). In addition, price promotion individually also has significant influence on perceived quality (sig. t = 0.026).
However, since the adjusted R2 of perceived
advertising spending and price promotion on perceived quality is only 0.126, it means that there are other factors influencing perceived quality. Yoo et al. (2000) suggested that price is one of the major factors in influencing perceived quality and to differentiate between a brand with other brands. Furthermore, Yoo et al. (2000) and Buil, Chernatony, & Martinez (2010) suggest that distribution intensity, store image and non-monetary promotion such as premiums & sampling are the significant factors influencing perceived quality.
Comparing the result of this study with other three previous researches, there are several similarities and differences. First, comparing this study with a research from Boonghee Yoo et al. (2000), higher perceived advertising spending, it will results in higher perception of brand quality, which leads to strong brand equity. It is also found out in the second research from Villarejo and Sanchez (2005), perceived advertising spending has significant impact on perceived quality. Furthermore, price promotion (price deals) also found to heighten the perception of quality.
However, the result of this study is different with Yoo’s study since price promotion makes consumers to infer low product quality which can mean that price promotion is negatively significant in influencing the perceived quality. It can be seen also in second related research that price promotion also has negative influence on perceived quality; it means that the higher price promotion, the lower the perceived quality. The different might be explained by the fact that there are some differences in the consumer behavior. According to PT. XYZ’s HR manager, Rizal Alamsjah, Indonesian consumer, especially consumer in beverage products did not easily perceived a product as a low quality product, when price discounts is offered (R. Alamsjah, personal communication, May 15, 2014). The result of this study is different from the third related research which is coming from Isabel Buil, Eva Martínez, And Leslie De Chernatony (2010). In their research, perceived advertising spending does not always influenced perceived quality. This is might be caused by the object of their study. In their case, perceived advertising spending can reach a “saturation point” where it does not significantly contribute in increasing brand equity’s elements, in which one of them is perceived quality (Chu & Keh, 2006). In contrast, recently, PT XYZ has promoted ABC brand intensively through several advertising channels (TV, Radio, and Billboard), the respondents in this study might have seen many advertisements recently and perceived ABC brand as a high quality product (W. Hendra, personal communication, May11, 2014).
Fourthly, based on Table 4, the F significant value for the fourth model is 0.000, or far below the significant level of 0.05. Thus it can be said that that perceived advertising spending and price promotion have simultaneous significant influence on the brand association of ABC brand.
For the individual effect of perceived advertising spending and price promotion on brand association, it is found out that perceived advertising spending individually has no significant influence on brand association (sig. t = 0.052). In contrast, price promotion individually has significant influence on brand association. (t = 0.002).
141 Since the adjusted R2 of perceived advertising
spending and price promotion on brand association is only 0.174, it means that there are other factors influencing brand association. Durianto, et. all (2004: 69), believes other possible factors which influence the brand association is coming from the lifestyle or the personality of consumers, direct and indirect competitors, and product class (positioning). In addition, the sign of the coefficient in the model shows a positive sign meaning that price promotion positively influence brand association, or the higher the price promotion spent by the company, the higher the brand association is likely to be.
Comparing the result of this study with previous researches, there are several differences. First, comparing this study with a research from Yoo et al. (2000), it can be seen that in their research, perceived advertising spending significantly influence brand association. Contrast with the first research, Isabel Buil, Eva Martínez, And Leslie De Chernatony (2010) found out that perceived advertising spending did not necessarily enhance perceived quality and brand associations. Second, compared to the Yoo et al. (2000) research, price promotion is found to have negative relationship with brand association. However, in the next related research (Buil, Chernatony, & Martinez, 2010) monetary promotions had a non-significant impact on brand associations. The results of their studies are different since price promotion has significant positive effect on brand association in this study. The differences in the result is might be caused by the differences in the object of the study and geographical location of the studies. Those previous studies were conducted their research using durable goods as the object, while this study is conducted using non-durable goods as the object. Consumers who buy the brand more frequently (non-durable) should have much stronger associations in memory than those who buy the brand less frequently (Romaniuk & Nenycz-Thiel, 2010). In beverage industry, price promotion plays a vital role in increasing the brand association (W. Hendra, personal communication, May 15, 2014). Product with relatively cheap price and good product quality (valuable product) is creating stronger value proposition which lead to stronger brand association (Aaker, 1991). In addition, since ABC brand is already in the Indonesian market since 40 years ago, people who have experienced consuming this product might have connected to the brands’ “emotional and self-expressive benefits as well as a basis for customer/brand relationships and differentiation” (Aaker, 1991).
Finally, based on Table 4., the significant value for fifth model is 0.000, or far below the significant level of 0.05 it can be concluded that perceived advertising spending and price promotion have simultaneous significant influence on the brand equity of ABC brand.
For the individual effect of perceived advertising spending and price promotion on brand association, it is found out that perceived advertising spending individually has significant influence on brand equity (sig. t = 0.003). Furthermore, price promotion individually also has significant influence on brand equity (sig. t = 0.026). In addition, the sign of the coefficients in the model show
positive signs meaning that for perceived advertising spending and price promotion both individually and simultaneously, positively influence brand equity. In the other words, the higher the perceived advertising spending and price promotion spent by the company, the higher the brand equity is likely to be, or vice versa.
Since the adjusted R2 of perceived advertising
spending and price promotion on brand equity is only 0.242, it means that there are other factors influencing brand equity. For the impact of perceived advertising spending and price promotion on brand equity, Yuyanti (2012) suggests that for beverage industry in Indonesia, line extension is proven to be one of the most significant factors affecting the creation of brand equity. Line extension is creating other product with the same brand but adding or changing the variance of the packaging, taste, volume, functionality, etc. (Yutanti, 2012). Thus, the other 75.8% factor in creating brand equity of ABC brand might be caused by line extension factor. In addition, Yoo et al. (2000) also suggest that a company should pay attention in their products’ distribution intensity because this factor can highly influence the creation of brand equity.
From those three related research, only Yoo et al. (2000) and Villarejo and Sanchez (2005) which discussed about the impact of perceived advertising spending and price promotion on brand equity. The result of this study is similar with Yoo’s result about the effect of perceived advertising spending on brand equity, where perceived advertising spending positively influence brand equity. The result from Villarejo and Sanchez (2005) is different compare to this study; they found out that perceived advertising spending does not have significant influence on brand equity. It might be explained due to the fact that other marketing mix tools such as personal selling or direct selling, sales’ reputation and after-sale service play more important roles in increasing brand equity for washing machine products (Kotler & Keller, 2012). However, when it comes to price promotion, the result is different. They found out that price promotion negatively influenced brand equity. In this research, price promotion is found to have positively influence on brand equity. This might be caused by different object in both studies. Those previous studies were conducted their research using durable goods as the object while this study is conducted using non-durable goods as the object. In the literature there is still some discussion about the effect of sales promotions on brand equity (Sriram et al., 2007). According to Hendra (personal communication, May 11, 2014), consumers for beverage products in Indonesia are very sensitive to the price and think primarily for the short term benefit of a product. Rizal (R. Alamsjah, personal communication, May 15, 2014) also suggests that almost all beverages companies in Indonesia are building their brand by giving a lot of promotion, one of them is giving price promotion (price off/discount). Thus, the more price promotion offered to consumers, the company hopes that it will result in higher brand equity.
142 maintained through intense promotion by using advertising and price promotion (W. Hendra, personal communication, February 11, 2014)
CONCLUSION
In the beginning of the research, the researchers have developed the statements of research problem consisting of five questions that need to be answered throughout this research. Following them, ten hypotheses have also been developed accordingly. The remaining part of the study is then addressed to test these hypotheses. After gathering the data and analyzing them using appropriate analytical methods, the researcher is able to verify eight hypotheses out of ten. This means that: (1) Perceived advertising spending and price promotion simultaneously have significant impact on brand loyalty, perceived quality, brand awareness, brand association and brand equity. (2) Perceived advertising spending and price promotion individually have significant impact on brand loyalty, perceived quality, and brand equity. The study, however, could not confirm two hypotheses: (1) Perceived advertising spending and price promotion individually have significant impact on brand awareness; (2) Perceived advertising spending and price promotion individually have significant impact on brand association.
Based on the result of this study, there are several managerial implications for managers. First, advertising is proven to be an important marketing mix tool for companies influencing brand equity especially in increasing perceived quality, brand awareness as well as brand loyalty. Second, price promotion also proven to be an important marketing tool for companies influencing brand equity, especially in increasing perceived quality and brand association. Thus, PT XYZ should maintain their strategy in building the brand equity through advertising and price promotion.The findings of the study present suggestions for managers of PT XYZ through which they can enhance brand equity. Since perceived advertising spending can directly affects brand equity, it is supposed to be the concern of PT XYZ to develop effective advertisements to induce brand equity toward the ABC brand brand.
However, due to a lot of new brands competing in the tea markets, advertising spending perceived by consumers improves brand equity but it is not enough to positively influence the associations related to the brand. In this context, companies should pay special attention to those aspects related to the design or the content of their advertising campaigns in the media, trying to develop original and creative strategies. This can be done by educating the customer about the quality and the benefits of consuming ABC brand. For example, in all the advertisements, ABC brand characteristics like no preservative, no artificial coloring, and the first ready-to-drink tea in bottle packaging in Indonesia market need to be communicated.
In addition, in order to increase the brand equity of ABC brand, PT XYZ should increase their promotional activities. PT XYZ needs to advertise intensively and give
price discount more frequent. Other than that, bundling program need to be considered by giving special price for buying old and the new packaging. This promotion can be used as a tool to introduce and promote a new packaging for the market. In addition, PT XYZ needs to fully utilize their gerobak dorong. Gerobak dorong is one of PT XYZ’s sales channels. This channel is very important since the sellers can move easily to find PT XYZ’s consumers. There are more than 1000 gerobak dorong in Surabaya area and can cover all crowded places in Surabaya (R. Alamsjah, personal communication, March 13, 2014).
There are several limitations to this research. First, this study only examines the direct relationship between perceived advertising spending and price promotion on each dimensions of brand equity. Since brand equity dimensions are closely interrelated, it would be useful to investigate further the relationships between the brand equity dimensions itself (Buil, Chernatony, & Martinez, 2010). In this study, the researcher did not consider the mediating role of each dimensions of brand equity. Second, in this research, the result of adjusted R2 for the five models are
moderately low. Thus, by looking at the result above, there must be other factors that influence the dependent variables. Third, the scope of this research is relatively small, the data obtained might not reflect the whole behavior of PT XYZ consumers in Indonesia. Furthermore, the object of this study is limited to only one product category and one brand. For further research, it is important to check the relationship and roles of each element (dimensions) of brand equity in the creation of brand equity. Structural Equation Modeling (SEM) should also be used to check the mediating variables. Structural equation modeling is used to compare the theoretical model and the mediated model (Hameed, 2013). In order to increase the brand equity of ABC brand, PT XYZ should not only focus in increasing the frequency of their advertisement and/or the price promotion that have been proven to significantly improve the brand equity of ABC brand, but also on the other factors or variables that have not been included in this research. Lastly, bigger coverage area should be considered, because it is crucial to compare different consumer behavior across different regions. In addition, a comparison study between different industries could be made to test the impact of perceived advertising spending and price promotion on brand equity.
REFERENCES
Aaker, David . (1991). Managing Brand Equity. New York: The Free Press
Aaker, David. (1997). Manajemen ekuitas merek : memanfaatkan nilai dari suatu merek, Jakarta : Mitra Utama.
Aaker, D.A. and R. Jacobson, (1994). The financial information content of perceived quality. Journal of Marketing Research, 31(2): 191-201.
143 theoretic analysis with empirical evidence. Market Science, 15(1): 86-108.
Archibald, R. B., Haulman, C. A. and Moody, C. E., Jr. (1983). Quality, price, advertising and published quality ratings. Journal of Consumer Research, Vol. 9, March: 347–356.
Bank Mandiri (2013). Industry Update Vol Mei 2013. Retrieved February 26, 2014, from http://bankmandiri.co.id/indonesia/eriview-pdf/NFDK01177899.pdf
Batra R, Myers, Aaker. (1996). Advertising Management. Englewood Cliffs (NJ): Prentice-Hall.
Bruin, J., (2006). Command to compute new test. Statistical Consulting Group, UCLA.
Buil, I., Chernatony, L. and Martinez, E. (2010, February). The effect of advertising and sales promotions on brand equity brand management. Paper accepted by the 6th
Thought Leaders in Brand Management International Conference, project “GENERES” (Ref. S-09) from the Government of Aragon. Chandon P. (2013). Note on measuring brand
awareness, brand image, brand equity, and brand value. Retrieved June 19,2014, from INSEAS University. Retrieved from https://flora.insead.edu/fichiersti_wp/inseadwp 2003/2003-19.pdf.
Chernatony, L. (2006). From Brand Vision to Brand Evaluation. Strategically Building and Sustaining Brands. Oxford: Butterworth Heinemann.
Chioveanu, I., (2008). Advertising, brand loyalty and pricing. Game Economic Behavior, 64: 68-80 Chu S, Keh HT. (2006). Brand Value Creation:
Analysis of the Interbrand-Business Week Brand Value Rankings. Marketing Letters 2006; 17: 323-331.
Cobb-Walgren C, Ruble CA, Donthu N. (1995). Brand equity, brand preference and purchase intent. Journal of Advertising 1995; 24(3): 25-40.
Cooper, Donald R. and Schindler, Pamela S. (2011). Business Research Methods. New York: McGraw-Hill/Irwin.
Durianto, Darmadi, et al. (2004). Strategi Menaklukkan Pasar. Jakarta: Gramedia Pustaka Utama.
Ghozali, Imam. (2011). Aplikasi analisis multivariate dengan program SPSS edisi 5. Semarang: BP Universitas Diponegoro.
Giddens, Nancy. (2002), Brand Loyalty. Ag Decision Maker, Iowa State University Extensions, Vol:5, No: 54, ss.1-2.
Gustin F. (2014) Analisis pengaruh variabel bauran pemasaran terhadap loyalitas konsumen produk minuman Teh Botol Sosro (Studi Kasus Pada Mahasiswa Fakultas Ekonomi UPI “YPTK” Padang, Universitas Putra Indonesia,
Padang. Retrieved May 25, 2014 from http://sisfo.upiyptk.ac.id/ejournal/File_Jurnal/J URNAL%20Pdf.pdf
Ha, H.Y., J. John, S. Janda and S. Muthaly. (2011). The effect of perceived advertising spending on brand loyalty in services. European Journal of Marketing 45.4, 673-691.
Hameed, Farhina. (2013). The effect of perceived advertising spending on brand loyalty mediated by store image, perceived quality and customer satisfaction: a case of hypermarkets. Asian Journal of Business Management 5, 181-192.
Hankinson, G. & Cowking. (1996). The reality of global brands: case and strategies for successful management of international brands. Midenhead: McGraw-Hill.
Hauser, J., Wernerfelt, Birger. (1990). An evaluation cost model of consideration sets. The Journal of Consumer Research, Vol. 16, No. 4: 393-408
Hendra, Wong. Personal Interview. PT XYZ.10 Feb – 15 May 2014
Kapferer J-N (2004). New Strategic Brand Management. Creating and Sustaining Brand Equity Long Term. 3rd Edition. London Sterling.: Kogan Page.
Keller, KL. (2003). Strategic Brand Management: Building, Measuring, and Managing Brand Equity, 2nd Edition. New Jersey: Prentice Hall. Keller KL (2007). Strategic Brand Management: Building, Measuring, and Managing Brand Equity, 3rd edition. New York: Prentice Hall. Keller, K. L., Heckler, S. E. and Houston, M. J.
(1998). The effects of brand name suggestiveness on advertising recall. Journal of Marketing, Vol. 62, January: 48–57. Keller KL, Lehmann DR. (2006). Brands and
branding: research findings and future priorities. Marketing Science 2006; 25(6): 740-759.
Kotler, Philip and Keller, Kevin L. (2012). Marketing Management Global Edition.14ed. Essex: Pearson Education Limited.
Lucy (2013). Brand and Packaging Analysis on Brand Awarenss and Brand Loyalty on Refreshment Drinking Water. Manajemen dan Bisnis -Institut Pertanian Bogor, Bogor.
Retrieved May 21, 2014 from
http://elibrary.mb.ipb.ac.id/gdl.php?mod=brow se&op=read&id=mbipb-12312421421421412-lucy-1219
Mowen, and Minor, M. (2002). Perilaku Konsumen Jilid 1, Edisi Kelima. Jakarta: Erlangga. Moorthy, S., and Hawkins, S. (2005). Advertising
144 Moorthy, S. and H. Zhao,(2000). Perceived
advertising spending and perceived quality. Marketing Letters 11:3 (2000): 221-233. Oliver, Richard L. (1997). Satisfaction: A Behavioral
Perspective on the Consumer. New York: McGraw-Hill.
Pallant, J. (2005). SPSS Survival Manual: A step by step guide to data analysis using SPSS version 12. Maidenhead, Berkshire: Open University Press.
Rosvita. (2010). Analisis pengaruh kualitas produk, harga, promosi, dan cuaca terhadap keputusan pembelian teh siap minum dalam kemasan merek Teh Botol Sosro (studi kasus pada mahasiswa fakultas ekonomi S1 Reguler II Universitas Diponegoro). Univeritas Diponegoro, Semarang. Retreived February
25, 2014 from
http://eprints.undip.ac.id/20263/2/ROSVITA_ DUA_LEMBANG.PDF
R. Alamsjah. Personal Communication. PT XYZ. 3 Feb – 10 May 2014
Rizan, M., Saidai B., Sati Y. (2012). Pengaruh brand image dan brand trust terhadap brand loyalty Teh Botol Sosro: survei konsumen Teh Botol Sosro brand di Food Court ITC Cempaka Mas, Jakarta Timur. Jurnal Riset Manajemen Sains Indonesia (JRMSI) |Vol. 3, No. 1, 2012. Romaniuk J., Sharp B., Paech C. & Driesener C.
(2004). Brand and advertising awareness: a replication and extension of a known empirical generalization. Australasian Marketing Journal 12 (3), 2004: 70-80.
Romaniuk, J. Nenycz-Thiel, M., (2010) Behavioural Brand Loyalty Measures and Consumer Responses to Brand Attributes. Ehrenberg-Bass Institute for Marketing Science, University of South Australia, Australia. Santoso, Singgih. (2001). Mengolah Data Statistik
Secara Profesional. Jakarta: Alex Media Komputindo.
Santosa, Purbayu, & Ashari. (2005). Analisis Statistik dengan Microsoft Excel dan SPSS. Yogyakarta: Penerbit Andi.
Schiffman, Lean, Kanuk. (2000). Consumer Behavior, 7th edition. New Jersey: Patience Hall
International, Inc,
Sekaran, U., &Bougie, R. (2010).Research Methods for Business: A Skill Building Approach (5th
edition). New Jersey: John Wiley and Sons. Selvakumar J., Vikkraman P. (2011). Impact of
advertising and price promotions on brand equity in service sector. Journal of Contemporary Research In Management. PSG Institute of Management (PSG College of Technology), Coimbatore, Tamil Nadu. Shimp, Terence A. (1997). Advertising, Promotion,
and Supplemental Aspects of Integrated
Marketing Communications, 4th ed. Orlando, FL: Dryden.
Simamora, Bison. (2004). Riset Pemasaran. Jakarta: Gramedia Utama.
Sudarmanto, Gunawan. (2013). Statistik terapan berbasis computer dengan program SPSS Statistics 19. Jakarta: Mitra Wacana Media. Sriram S, Balachander S, Kalwani MU. (2007).
Monitoring the dynamics of brand equity using store-level data. Journal of Marketing 2007; 71(April): 61-78.
Tabachnick, B. G., & Fidell, L. S. (1996). Using multivariate statistics (3rd ed.). New York: HarperCollins.
Tjiptono, Fandy. (2002). Strategi Pemasaran. Yogyakarta: Andi
Tjiptono, Fandy. (2005). Brand Managemen & Strategi. Yogyakarta: Andi.
Villarejo-Ramos, A.,Rondán-Cataluña, F., Sánchez-Franco, M. (2005).Direct and indirect effects of marketing effort on brand awareness and brand image. Marketing Letters 11:3 (2000): 221±233.
Winer, R. S. (1986). A reference price model of brand choice for frequently purchased products. Journal of Consumer Research, Vol. 13, September: 250–256.
Woodside AG & Wilson EJ (1985). Effects of consumer awareness of advertising on preference. Journal of Advertising Research 25: 41-48.
Yoo, B., Donthu, N., and Lee, S. (2000). An examination of selected marketing mix elements and brand equity. Journal of the Academy of Marketing Science Volume 28, No. 2, 195-211