A. Krügera,*, T. H. Kolbea
aTechnische Universität Berlin, Institute for Geodesy and Geoinformation Science, Strasse des 17. Juni 135, D-10623
Berlin – (andreas.krueger, thomas.kolbe)@tu-berlin.de
Commission II, WG II/7
KEY WORDS: Energy Atlas, Energy Assessment, Energetic City Planning, Virtual 3D City Model, Urban Information Model,
CityGML, Energetic Key Indicators, Urban Energy System
ABSTRACT:
In the context of increasing greenhouse gas emission and global demographic change with the simultaneous trend to urbanization, it is a big challenge for cities around the world to perform modifications in energy supply chain and building characteristics resulting in reduced energy consumption and carbon dioxide mitigation. Sound knowledge of energy resource demand and supply including its spatial distribution within urban areas is of great importance for planning strategies addressing greater energy efficiency. The understanding of the city as a complex energy system affects several areas of the urban living, e.g. energy supply, urban texture, human lifestyle, and climate protection. With the growing availability of 3D city models around the world based on the standard language and format CityGML, energy system modelling, analysis and simulation can be incorporated into these models. Both domains will profit from that interaction by bringing together official and accurate building models including building geometries, semantics and locations forming a realistic image of the urban structure with systemic energy simulation models. A holistic view on the impacts of energy planning scenarios can be modelled and analyzed including side effects on urban texture and human lifestyle. This paper focuses on the identification, classification, and integration of energy-related key indicators of buildings and neighbourhoods within 3D building models. Consequent application of 3D city models conforming to CityGML serves the purpose of deriving indicators for this topic. These will be set into the context of urban energy planning within the Energy Atlas Berlin. The generation of indicator objects covering the indicator values and related processing information will be presented on the sample scenario estimation of heating energy consumption in buildings and neighbourhoods. In their entirety the key indicators will form an adequate image of the local energy situation for decision making. An approach for extending the CityGML standard for the explicit storage of these indicators in relation to the according city object will be given by using the concept of CityGML Application Domain Extension (ADE). The aim of this approach is to initiate a discussion process for the specification of a standardized data model extension concerning energy assessment into 3D CityGML models, which facilitates the application of the Energy Atlas decision support concepts within other city models conforming to this standard.
1. INTRODUCTION
Climate change in combination with global population growth, trend to urbanization and higher demands on the living standard of inhabitants requires an answer from city planning concerning energy production, supply, and consumption. Currently, energy planning has to deal with several options, like central vs. decentral energy production; exploitation of regenerative & natural energies (solar heat & photovoltaic, wind power and geothermal energy); construction, extension, alternative usages of supply and utility infrastructures; development of measures to increase energy efficiency (building renovation measures which affect the energy consumption); and campaigns for influencing consumer behaviour. The development of measures having regard to all these options within cities calls for a holistic strategic energy planning from the perspectives of the city administration and the energy providers which requires detailed knowledge and consideration of the local situation to understand the complex system interdependencies.
In several energy planning domains, e.g. estimation of energy consumption, solar potential analysis, thermal remote sensing regarding heat emission of buildings, and utility network modelling, virtual 3D city models are in the research focus. 3D city models conforming to the standard CityGML provide full coverage of city objects of the entire urban area, including geometry, properties, and the spatial arrangement of buildings, with ability of coherent integration of spatio-semantic
attributes, which facilitates the integration of energy-related and ecologic-relevant information on different scales. Thus, energy-related simulation/computation models can be applied for the entire city. Furthermore, using the standard CityGML allows for easy adoption of the same concepts in different cities.
The first part of this paper introduces the framework and project initiative Energy Atlas Berlin focusing on the development of a holistic modelling framework for energy assessment regarding the diverse aspects of the urban energy system. Key indicators and indexes for energy analysis will be identified on the example of estimation of heating energy consumption on building and neighbourhood scale. The concept of indicators and indexes will be incorporated into the design of a CityGML extension for energy assessment, an Energy Application Domain Extension (ADE) which forms the basis of the Energy Atlas Berlin data model.
2. THE ENERGY ATLAS BERLIN
The Energy Atlas Berlin focuses on a holistic approach towards optimizing decisions on comprehensive planning alternatives for energy production, distribution, and use within cities. Objective is the design and development of a strategic tool for transparent energy planning addressing decision makers in industry (energy suppliers, energy (solution) providers), government, administration, and public.
the design and planning level up to political and entrepreneurial level will be addressed during the project initiative based on the central Energy Atlas platform. On higher levels, policy makers require a high level of abstraction. Basically, an engineer will focus on energy flows and balances for individual buildings and its proximity, while a more global view will be relevant for areas of responsibility of a designer or administrative. The greater the area of responsibility is, the more a spatial aggregation is required to support the decision making process. Figure 1 illustrates this correlation.
The Energy Atlas will facilitate the integration, spatial visualization and analysis of energetic and ecologically relevant information; energy requirements and consumption; energy streams and distribution; energy sources and production; and shares in the production, but also in the reductions of greenhouse gas emissions.
Core of the Energy Atlas is the virtual 3D city model of Berlin [Berlin3D, 2009]. The official 3D city model of Berlin consists of about 550,000 buildings in LOD2, about 100 buildings (landmarks) in LOD3, and 4 buildings in LOD4 with integrated Digital Terrain Model. The model is structured according to the CityGML standard and provides geometry, topology, semantics, and appearance in an integrated way for all buildings in Berlin.
Figure 2: Starter Project Energy Atlas Berlin: Core and Application Fields
In the center of the technical framework of the Energy Atlas, the storage of the 3D city model and all integrated datasets is implemented using 3DCityDB [3DCityDB, 2012], an Open Source 3D geodatabase structured by a CityGML conforming relational database schema developed by the Institute of Geodesy and Geoinformation Science of Technische Universität Berlin (see [Stadler et al., 2009] for detailed information). Figure 2 shows the structure of the Energy Atlas framework with the central database providing functionalities for gathering and calculating energy related objects and properties together with their semantic information.
2.1 CityGML
The City Geography Markup Language (CityGML) is an international standard issued by the Open Geospatial
Consortium (OGC) for the representation and exchange of semantic 3D city models. It specifies classes and relations for the most relevant city objects in an object oriented way including geometrical, topological, semantic and appearance properties, generalization and aggregation hierarchies between object classes as well as thematic relations between city objects. CityGML is an application schema of the Geography Markup Language 3.1.1, based on a number of standards from the ISO 191xx family, OGC, W3C Consortium, Web 3D Consortium, and OASIS [Gröger et al., 2008; Kolbe, 2009]. The language provides thematic modules for the representation of buildings, city furniture, land use, relief, and vegetation, traffic infrastructures and water ways including a full 3D geometry representation and the ability of enrichment by application of specific data, e.g. values concerning energy planning. However, the thematic modules can only cover a basic set of application fields. For use in further domains CityGML provides concepts of generic objects, generic attributes, and Application Domain Extensions (ADE). An ADE can extend CityGML by specific attributes or objects in a formalized way to cope the additional thematic requirements.
Five consecutive Levels-of-Detail (LOD) are defined within CityGML, with increasing detailing in spatial and thematic differentiation from LOD0 (2.5D DTM + 3D landmarks and infrastructure) up to LOD4 (most detailed 3D structure including an indoor model). Each object may have attached a separate representation for each LOD simultaneously.
The full coverage of geometry, topology, semantic, and appearance of city objects in diverse LODs coupled with generalization and aggregation hierarchies forming city object structures on different hierarchical scales and the ability of designing domain specific extensions build a stable environment for performing multi-scale analyses and simulations on CityGML-conforming virtual 3D city models.
2.2 Starter Project Energy Atlas Berlin: Data and Concept
Integration to cope with Application Fields
Within the initial project Energy Atlas Berlin, in cooperation with academic partners from several departments of the Technische Universität Berlin and the German Research Centre for Geosciences (GFZ); the industrial partners Vattenfall Europe Berlin AG, GASAG AG, and Berlin Partner GmbH; and the Berlin Senat for Economics, Technology and Women's Issues as partner of the city government of Berlin; the application fields geothermal heat potential, traffic & urban structure, energy characteristics of buildings, and the creation of new business models will be addressed, see Figure 2. For that purpose, energy relevant features, e.g., for energy production, distribution, and consumption will be identified and incorporated. In addition, analysis and visualization tools will be designed and prototypically implemented, such that a visualization of analysis results in combination with the 3D city model of Berlin is available, allowing a visual interpretation related to the urban environment.
The 3D city model of Berlin itself provides the geometry of buildings as well as a basic set of semantic information, such as building addresses, usages, and heights. Data integration of existing energy-related datasets and integration of additional modeling concepts is one prerequisite to augment the model according to the energy domain requirements. For that purpose, the following datasets and concepts are incorporated into the 3D city model of Berlin:
• Datasets with solar potentials of the Solar Atlas Berlin [Solaratlas, 2010] obtained from laser surveying of about 500,000 roofs in Berlin are available for buildings and also
Figure 1: Energy Atlas – Levels of Decision-Making
Building Energy Properties, Balance and
Scenarios Geothermal Heat
Potential
Traffic and Urban Structure
Innovative Business Models
Modeling and Data Survey
Modeling and Set-Up CityGML Energy ADE and Database
Definition
Data Integration, Implementation of Tools for Analyses and Energy
Assessment
for single roof surfaces. The datasets contain slope and orientation of the roofs; the amount of solar irradiation; installation costs, energy yields and CO2 reduction potentials for different solar panel types.
• The modeling concept of an Utility Network ADE which incorporates supply infrastructures and utility networks (i.e. gas, water, electricity, etc.) into CityGML is contributed by another project called SIMKAS-3D (Simulation of Cascading Effects in the Failure of Utility Infrastructures) [Simkas3D, 2010] which deals with scenarios of cascading effects among supplier networks of Berlin’s utility companies that may result in disasters. The definition of the core network model and its relationship to additional packages can be found in [Becker et al., 2011].
• Concepts for estimation of the energetic rehabilitation state of buildings and heating energy consumption are incorporated from [Carrión, 2010 & Carrión et al., 2010].
Figure 3: Energy Atlas Berlin: Model and data Integration
Figure 3 illustrates the integrative approach of the Energy Atlas Berlin. Network modeling concepts, Berlin-wide solar potential data for roofs and the 3D city model dataset of Berlin have been already joined for the Energy Atlas.
2.3 Applicability within other Cities
An increasing number of cities around the world maintain 3D city models conforming to the standardized modelling language CityGML. With this standardized modelling, the 3-dimensional geometry of city objects, like buildings, traffic areas, etc., is available in close association with the semantics [Gröger, Kolbe et al., 2008]. The idea of the Energy Atlas is that Berlin is the test bed for conceptual design of a framework concerning holistic energy planning and simulations based on a virtual 3D city model which is semantically enriched by energy-related datasets. In that context, the standard CityGML allows for easy adoption of the same concepts in different cities.
3. METRICS, INDICATORS AND INDEXES
Holistic urban energy planning deals with simulation of planning alternatives coupled with decision-making regarding suitability to achieve strategic objectives or policies concerning a sustainable development in the energetic behaviour of city. Usually, decision-making in context of sustainable development is associated with information gathering using the concept of indicators. The entire key information which is necessary to understand the interrelations concerning the energetic behaviour of the urban region can be provided by forming a comprehensive set of energy-related indicators. In that context, the most important feature of indicators is the relevance to policy and decision-making, which requires that developed indicators must deal with that relevance [Gallopín, 1997]. In general, an indicator represents a set of rules for refining, collecting, and organising data by a specified request [Carneiro,
2011]. A more detailed investigation on the meaning and definition of indicators gives [Gallopín, 1997]. There, indicators are described as individual variables or variables that are a function of other variables to summarize or simplify, quantify, measure, and communicate relevant information; indicators make visible or perceptible significant phenomena on a transparent way. The function can differ in their complexity, from simple functions up to very complex simulation model calculations. The complexity of the function leads to a distinction between indicators, which usually represent complicated functions on the primary data, and indexes representing simple functions of (in most cases) lower-level variables, like weighted addition of individual variables, multiplication, or maximum operations. In other words, an index covers straightforward aggregation functionality of variable values to one higher aggregated result, whereas an indicator processes a complex calculation resulting in one value of the same or higher level of aggregation.
As above mentioned, indicators and indexes shall summarize or simplify, quantify, measure relevant information which requires an underlying metric of their values, e.g. real, integer values or a reference to such values, and usually a measurement unit. An integration of the indicator concept within virtual 3D city models will be helpful for accessing required energy properties and attributes; results of energy-related system simulation consisting of complex calculations and aggregation functionality for decision-making on higher hierarchical scales. [Carneiro, 2011] introduces the application of indicators within the energy domain for application in solar energy potential analysis and energy demand for heating and lighting by processing LiDAR-based Digital Surface Models. Within this paper, the concept will be adapted for energy assessment using CityGML-based 3D city models. In that context, geometry, topology, morphology, and spatio-semantic attributes (in CityGML-conform virtual 3D city models, a semantic attribute is always correlated to city object geometry [Stadler et al, 2007]) of single city objects or aggregations of them on neighbourhood, district or city scale have to be addressed by indicators and indexes.
4. KEY INDICATORS FOR STRATEGIC ENERGY
PLANNING – ESTIMATION OF HEATING ENERGY CONSUMPTION
This chapter will focus on a sample scenario within the energy assessment domain – the estimation of heating energy consumption of buildings and neighbourhoods. In that context, the interaction of different indicators and indexes will be introduced to show their relevance within this domain. Building on that example, an extension of CityGML will be defined in chapter 5 for covering this scenario by using the ADE concept of CityGML.
4.1 Estimation of Heating Energy Consumption of
Buildings and Neighbourhoods
assessment of the energy consumption values can be processed based on this model.
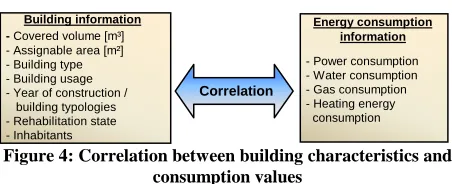
Figure 4: Correlation between building characteristics and consumption values
Due to data privacy issues, complete city-wide energy consumption data is not available for use within holistic simulations or analyses. The same situation occurs within future energy consumption estimations, where real values cannot exist. The city-wide availability of 3D city model and cadastre data is a comprehensive data set for applying estimation algorithms which simulate those correlations to fill this gap.
In the following approach of [Carrión, 2010 & Carrión et al., 2010], the focus lies on heating energy consumption estimation. Within this approach, the heating energy consumption value of a single building depends on the parameters number of storeys, building height, heated volume, construction year, number of accommodation units, and building function (the building usage). The heated volume and building height can be derived from the building geometry. The number of storeys, construction year, number of accommodation units, and the building function can be taken from the semantic information of the building model. In Berlin all these semantics are available in different datasets and were merged with the 3D city model. According to the German Energy Savings Ordinance 2009
The average storey height is derived by:
small or large multi-family house, multi-storey building. Several building typologies exist, which are dependent from the building and city development structure. A typical building typology lists consumption values as factors per m2 per year for different building types and construction year classes in kWh/m2a. For a city, a most suitable building typology must be taken for accurate estimations. By using the building type and the construction year the appropriate factor can be selected and multiplied with the assignable area of a building, which leads to the heating energy consumption of the selected building. In [Carrión, 2010] the estimated values on a test area in Berlin have a 19% average deviation to real values. The Energy Atlas starter project focuses on the refinement of this algorithm. The next section will follow this estimation approach, by identifying the key indicators/indexes related to this domain.
4.2 Definition of Key Indicators and Indexes
Using the 3D city model of Berlin the values for the algorithm have to be completely derived from this model.By analyzing the parameter of each calculation step, the indicators and indexes covering the scenario in section 4.1 can be identified. Values that can be directly taken from the properties of a building are number of storeys, usage of the building,
construction year, and the number of accommodation units. For accessing these parameters, elementary indicators (EI) can be defined which represent these properties (or variables):
•EINumberOfStoreys≙ Property[Building]numberOfStoreys
•EIUsage≙ Property[Building]function
•EIConstructionYear≙ Property[Building]yearOfConstruction
•EIAccommodationUnits≙ Property[Building]numberOfAccommodationUnits The building height and heated volume can be calculated by using analysis functions on the geometry of a building, the vicinity can be derived by analyzing the building topology. Complex indicators (CI) will be defined carrying complex functions directly on the related building object:
•CIBuildingHeight≙ f(Geomertry[Building])
•CIHeatedVolume≙ f(Geometry[Building])
•CIVicinity≙ f(Topology[Building])
According to the formulas in section 4.1, the further results of the estimation approach will be obtained applying complex functions on the above listed elementary and complex indicators. These values are the storey height, assignable area, building type and the resulting heating energy consumption on building scale. The complex function requires the definition of further complex indicators for obtaining these values:
•CIStoreyHeight≙ f(CIBuildingHeight, EINumberOfStoreys)
•CIAssignableArea≙ f(CIStoreyHeight, CIHeatedVolume)
•CIBuildingType≙ f(EIUsage, EINumberOfStoreys, EIAccommodationUnits, CIVicinity)
•CI HeatingEnergyConsumption≙ f(EIConstructionYear, CIAssignableArea, CIBuildingType) Besides the consumption estimation, heating energy can be produced within buildings. For demonstration issues on a more comprehensive insight about the heating energy supply in buildings, we introduce another elementary indicator on an attribute value which is already incorporated assigned to the roof surfaces of buildings within the 3D city model of the Energy Atlas Berlin, the potential solar thermal yield:
•EIRoofSolarThermalYield≙ Attribute[RoofSurface]solarThermalYield
This value can be subtracted from the estimated heating energy consumption obtaining the remaining heating energy demand of a building.
4.3 Indicator/Index Aggregation
Dealing with energy assessment on different scales has to support aggregation concepts. Beneficial for deriving indicators on a higher aggregation level is thematic aggregation as well as spatial aggregation, i.e. thematic aggregation can summarize, multiply or apply maximum operations on balance values of different domains, like energy consumption which can be summarized from heating energy and power consumption; spatial aggregation can use that operations to concentrate values within neighbourhoods, districts, or the city to one single value. Addressing the different scales within the heating energy scenario, we introduce a combined thematic and spatial aggregation of heating energy consumption and solar thermal production of all buildings on neighbourhood scale:
•IndexHeatingEnergyConsumption_Neighbourhood ≙ ∑(CIHeatingEnergyConsumption, EIRoofSolarThermalYield, f(Geometry[Envelope]Neighbourhood))
The underlying simple aggregation functionality can be covered by an index on all indicators processing the heating energy consumption on building scale and the solar thermal yields within the envelope of the neighbourhood.
4.4 Classification of the Indicators/Indexes
indicators/indexes can be classified according to their underlying metric, which can base on the geometry, the topology, the morphology, or the spatially related semantic.
Table 1 gives a compact overview and classification of the introduced indicators and indexes.
4.5 Multiple Indicator/Index Algorithms
Usually, simulation and calculation results can be obtained by various algorithms, e.g. in [Strzalka et al., 2011] two further approaches for heating energy consumption estimation on building scale will be introduced. A simple model considers only the transmission losses through the outer building envelope; the more complex model processes a comprehensive energy balance covering transmission and ventilation losses as well as solar and internal gains according to the German standard [DIN V 18599].
By reason of that multiplicity of algorithms for obtaining one parameter, each complex indicator and index needs the potential of covering multiple variants of functions. For establishing transparency among the derivation process (a demand on indicators, see section 3) each function requires meta-information about the lineage and the data quality of the underlying algorithm as well as the applied function of the set including the selection criteria.
5. CITYGML ENERGY ADE
The CityGML language core does not provide explicit attributes for modeling energy consumption of buildings, utility infrastructure distribution and capacities, and power stations. For this reason, an extension of the data model by energy specific contents is required, in order to allow inventorying, classifying, mapping and analytical processing of energy related values with strong reference to the related city object. Thus, the CityGML core needs to be extended by an Energy ADE.
Figure 5: Indicator/Index Meta-Model in UML notation
According to the formalization in section 3 and the distinction of the terms indicator and index in [Carneiro, 2011] an indicator meta-model can be defined, which acts as basis for defining the Energy ADE. Figure 5 shows the UML meta-model of the indicator concept. Indicators can be elementary or complex. An elementary indicator gives direct access to values of a variable, which can be an attribute or property of a CityGML conforming city object, whereas complex indicators calculate their values by using a complex function and further
indicators as parameters. An index is a special type of indicator that can be derived by applying a simple function on a set of indicators. In deviation from the conceptual model for the construction of urban indicators in [Carneiro, 2011] where an index can only be used to create further indexes, both complex indicators and indexes can act as an input parameter for each other. The reason for that modification lies in the beneficial reusability of index values within complex functions in higher hierarchical levels.
Each instance of a complex indicator and index contains a set of variants of their underlying derivation functions according to various approaches which can be used for calculating the indicator or index value, see section 4.5. An indicator or index within CityGML has no ability to execute the underlying function by itself; it holds only a descriptive notation of the algorithm within the attribute derivationRule. Within analysis and simulation tools executing these rules, their notation must be supported. A sample approach for using a more universal language concept which takes into account the notation of geoobjects and their spatial characteristics and relationships in the context of graph transformation on GML-based data models gives [Krüger, et al., 2010]. Each variant includes a priority ranking (an order of application) as well as meta-information about the data quality (uncertainty) and lineage to establish transparency among the algorithm used to obtain the value. The value of each indicator or index is defined as gml:MeasureType which covers the requirement of an underlying metric of their values including the measurement unit. Due to their complex functionality and unique configuration of their instances indicators and indexes are defined as feature objects.
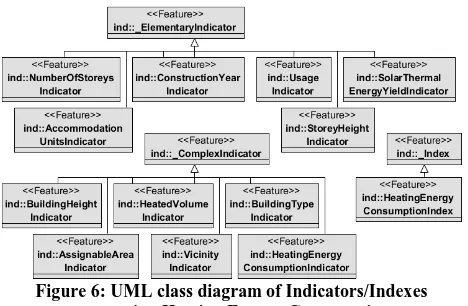
Figure 6: UML class diagram of Indicators/Indexes concerning Heating Energy Consumption
Accordant to the definition and classification of indicators and indexes given in section 4.2 and 4.3, Figure 6 depicts the indicator/index class hierarchy in UML.
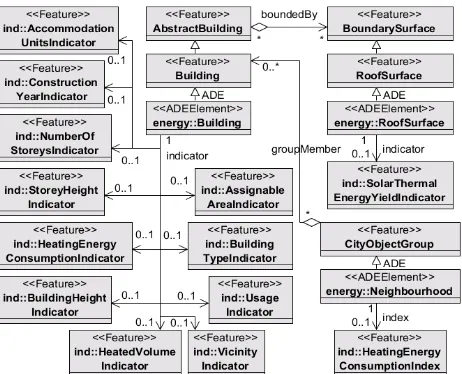
The concept for creating the EnergyADE based on the indicator/index concept is illustrated in Figure 7. The related feature classes, in case of the heating energy consumption domain Building and RoofSurface, will be specialized by corresponding EnergyADE feature classes. Furthermore, a new class Neighbourhood will be incorporated as specialization of a
CityObjectGroup for modelling higher spatial aggregation
levels. The indicator and index classes will be assigned to the related specialized ADE class of the energy domain. The cardinality for each indicator ranges from 0 to 1, meaning the indicator or index instance can exist one time or not, depending on their availability causing by applicability of an underlying algorithm to obtain the values. The given notation using
<<ADEElement>> as stereotype of an ADE class and ADE as
name of the generalization/specialization relation follows an actual convention within the Special Interest Group 3D resulting from their discussion process.
metric concerning elementary indicator complex indicator index
geometry building height, heated volume
topology vicinity (number of adjacent buildings)
morphology (morphometrics)
spatio-semantic metrics
accommodation units, construction year, usage, number of storeys, roof solar thermal yield
building type, storey height, assignable area, building-scale heating energy consumption
neighbourhood-scale heating energy consumption
Figure 7: UML class diagram for incorporating Heating Energy Consumption Indicators/Indexes as an EnergyADE
6. CONCLUSION & OUTLOOK
Within this paper, the concept of an integrated framework for transparent planning processes on all levels of decision making in cities concerning strategic energy planning was introduced - the Energy Atlas Berlin. Energy assessment and system simulation regarding sustainable development consists of simple variables, simple aggregation functionality, and complex calculations resulting in a set of parameters which can be obtained by using the concept of indicators and indexes.The importance of indicators/indexes is dependent on the application domain within the planning process. On a sample scenario - the heating energy consumption estimation - a set of key indicators and indexes were identified and classified, which as unit form a comprehensive image of the estimation approach. Furthermore, concepts towards a CityGML extension for energy planning based on indicators/indexes - the Energy ADE - were introduced, which is a basic prerequisite for integration of semantics and analysis concepts concerning strategic energy planning using virtual 3D city models based on CityGML as integrated platform. The standard CityGML will allow easy adoption of the same concepts in different cities.
Several future research aspects can be identified for the development of a holistic strategic energy planning platform. A comprehensive set of key indicators and indexes have to be identified within all relevant energy application domains of a city. Furthermore, a comprehensive ADE for energy assessment using a systemic approach for the whole city must be broaden to all aspects of energy production, flows and consumption within urban areas. Moreover, a discussion and standardization process should be initiated to reach compatibility between different energy planning systems on CityGML-based 3D city models.
REFERENCES
3DCityDB, 2012. 3DCityDB Home - The CityGML Database
3DCityDB, http://www.3dcitydb.net/, last visited: 29.03.2012.
Becker, T., Nagel, C., Kolbe, T.H., 2010. Integrated 3D
modeling of multi-utility networks and their interdependencies for critical infrastructure analysis. In: Kolbe, T.H., König, G.,
Nagel, C. (Eds.), Advances in 3D Geo-Information Sciences, pp. 1–20.
Berlin3D, 2009. Official 3D City Model of Berlin. www.3d-stadtmodell-berlin.de, last visited: 25.03.2012.
Carneiro, C., 2011. Extraction of Urban Environmental Quality
Indicators using LiDAR-Based Digital Surface Models.
Doctoral thesis, École polytechnique fédérale de Lausanne, Switzerland.
Carrión, D. 2010. Estimation of the energetic rehabilitation
state of buildings for the city of Berlin using a 3D city model represented in CityGML. Master thesis, Technische Universität
Berlin, Germany.
Carrión, D., Lorenz, A., Kolbe, T.H., 2010. Estimation of the
energetic rehabilitation state of buildings for the city of Berlin using a 3D City Model represented in CityGML. In: Kolbe,
T.H., König, G., Nagel, C. (Eds.), Proceedings of the 5th International Conference on 3D Geo-Information 2010 in Berlin. The International Archives of the Photogrammetry, Remote Sensing and Spatial Information Sciences, pp. 31–36.
Gallopín, G.C, 1997. Indicators and their use: information for
decision-making. In Moldan, B., Billharz, S. (Eds.).
Sustainability Indicators: Report of the Project on Indicators of Sustainable Development. SCOPE 58, John Wiley & Sons, Chichester, pp.13-27.
Gröger, G., Kolbe, T.H., Czerwinski, A., Nagel, C., 2008:
OpenGIS City Geography Markup Language (CityGML), Version 1.0.0. OGC Encoding Specification, Doc.No. 08-007r1.
Kolbe, T. H., 2009. Representing and Exchanging 3D City
Models with CityGML. In: Lee, Zlatanova (Eds.), 3D
Geo-Information Sciences, Springer.
Krüger, A., Kolbe, T.H., 2010. A Framework for the
Data-Driven Analysis, Interpretation, and Transformation of
Geospatial Information Models. Tagungsband zur
Dreiländertagung der OVG, DGPF und SGPF - 30. Wissenschaftlich-Technische Jahrestagung der DGPF 2010 in Wien. DGPF, pp. 309–324.
Simkas3D, 2010, Simkas-3D Homepage. http://www.simkas-3d.de, last visited: 28.03.2012.
Solaratlas, 2010. Solaratlas Berlin, http://www. businesslocationcenter.de/en/3d-model-of-berlin/the-project/ project-examples/solar-atlas, last visited: 27.03.2012.
Stadler, A., Nagel, C., König, G., Kolbe, T.H., 2009. Making
interoperability persistent: A 3D geo database based on CityGML. In: Lee; Zlatanova (Eds.): Proceedings of the 3rd
International Workshop on 3D Geo-Information, Seoul, Korea. LNG & C, Springer.
Stadler, A, Kolbe, T.H., 2007. Spatio-semantic Coherence in
the Integration of 3D City Models. Proceedings of the 5th
International Symposium on Spatial Data Quality, Enschede, Netherlands.
Strzalka, A., Bogdahn, J., Coors, V., Eicker, U., 2011. 3D City
modeling for urban scale heating energy demand forecasting.
In: HVAC&R Research, Volume 17, Issue 4, pp 526–539.
ACKNOWLEDGEMENTS