COMPARISON OF C-BAND AND X-BAND POLARIMETRIC SAR DATA FOR RIVER
ICE CLASSIFICATION ON THE PEACE RIVER
H. Łoś a, *, K. Osińska-Skotak a, J. Pluto-Kossakowska a, M. Bernier b, Y. Gauthier b, M. Jasek c, A. Roth d a
Dept. of Photogrammetry, Remote Sensing and GIS, Faculty of Geodesy and Cartography, Warsaw University of Technology, Poland - (h.los, k.osinska-skotak, j.pluto-kossakowska)@gik.pw.edu.pl
b Centre Eau, Terre et Environement, Institut National de la Recherche Scientifique, Quebec, Canada – (monique.bernier, yves.gauthier)@ete.inrs.ca
c
Bc Hydro, Burnaby, Canada – [email protected] d
Remote Sensing Data Center, DLR, Oberpfaffenhofen, Germany – [email protected]
Commission VII, WG VII/5
KEY WORDS: River ice dynamics, SAR, Polarimetry
ABSTRACT:
In this study, synthetic aperture radar (SAR) data from TerraSAR-X were compared with RADARSAT-2 data to evaluate their effectiveness for river ice monitoring on the Peace River. For several years RADARSAT-2 data have been successfully used for river ice observation. However, it is important to take into account data from other satellites as they may provide solutions when it is not possible to obtain images from the preferred system (e.g., in the case of acquisition priority conflicts). In this study we compared three TerraSAR-X (X-band) and three RADARSAT-2 (C-band) datasets acquired in December 2013 on a section of the Peace River, Canada. For selected classes (open water, skim ice, juxtaposed skim ice, agglomerated skim ice, frazil run and consolidated ice) we compared backscattering values in HH and VV polarisation and performed Wishart supervised classification. Covariance matrices that were previously filtered using a refined Lee filter were used as input data for classification. For all data sets the overall accuracy was higher than 80%. Similar errors associated with classification output were observed for data from both satellite systems.
* Corresponding author
1. INTRODUCTION
River ice is known to affect many of the world’s largest rivers. Approximately 60% of rivers in the Northern Hemisphere experience its significant seasonal effect (Prowse, 2005). The main hydrological consequence of river ice is its influence on river discharge. Ice-induced extreme flow events can result in serious economic issues such as floods or damages to water power plant infrastructure.
Satellite data have vast potential for river ice monitoring because they span large areas. Synthetic Aperture Radar (SAR) systems are particularly promising, they can acquire data during the day or night without regard to cloud cover. Application of earth observation data for river ice monitoring has been discussed since at least the 1980s (Hall, 1985).
For several years, research regarding the use of satellite SAR data for river ice monitoring has been conducted for various rivers (Gauthier, 2010; Geldsetzer, 2011; Jasek, 2013; Lindenschmidt, 2011; van der Sander, 2009). C-band data are most commonly used. However, due to satellite revisit time and tasks priority conflicts it is not always possible to acquire C-band data for a date of interest. In this case, other SAR systems may be used to collect required information regarding the ice cover stage.
Full polarimetric RADARSAT-2 and ALOS data were compared using the Middle Channel of the Mackenzie as a study area (van der Sanden, 2011). In that study,
RADARSAT-2 showed better river ice classification results than did ALOS data (especially in the case of frazil ice detection). Additionally, full polarimetric images from RADARSAT-2 and dual-pol data from TerraSAR-X were compared for the Saint-Francois River (Mermoz, 2009). In that case, both types of data yielded similar classification results for selected four classes.
The aim of this study is to compare TerraSAR-X data with RADARSAT-2 data to evaluate their usefulness for monitoring river ice on the Peace River. As the Saint Francois River and the Peace River differ in terms of hydraulic and ice regimes, resulting in different ice cover types, research dedicated to this specific area is needed.
2. STUDY AREA AND DATA
2.1 Study area
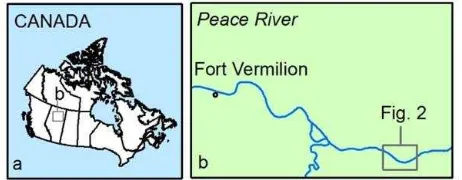
The study area covers a reach of the Peace River known as the Vermilion Chutes (from km 908 to km 919). The location of the test site is shown in the Figure 1 (a) and (b). A RADARSAT-2 false-coloured SAR image is presented in Figure 2.
Ice cover on the Peace River has been extensively monitored for many years to help manage flow releases from BC Hydro’s generation facilities in British Columbia. Monitoring during the winter is essential for efficient dam operation and to prevent undesired high water levels in the river, as they can influence the risk of ice jam-related flooding in the Town of Peace River
in Alberta, approximately 400 km downstream of the dams (Gauthier, 2006; Jasek, 2013). To help determine when control flow is likely to be implemented, BC Hydro forecasts ice front location on the Peace River with the CRISSP model (Chen, 2006). In the model one has to specify the lodgement date as a boundary condition. Then, model initialization occurs after the first ice front observation further upstream. So far little is understood about the freeze-up process from km 300 to km 500 downstream of the Town of Peace River, which includes the Fort Vermilion and the Vermilion Chutes area. Since the downstream domain of the numerical river ice model used by BC Hydro occurs within this reach, it is important to understand the ice process there.
Figure 1. Location of the study area within (a) Canada and (b) northern Alberta
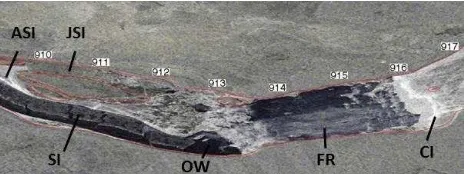
Figure 2. Vermilion Chutes on 08.12.2013. RADARSAT-2 band combination RGB HH HV VV (© MacDonald, Dettwiler and Associates Ltd. (2014) – All Rights Reserved)
Due to the remote location of the study, area aerial surveys are costly. Therefore, remote sensing-based analysis is of great interest in terms of identifying ice cover characteristics and detecting variations.
2.2 Data
During November and December 2013 eleven, TerraSAR-X and RADARSAT-2 images were acquired. Because the specified ice types were not present in all of the acquired scenes, six data sets (three TerraSAR-X and three RADARSAT-2) were selected.
TerraSAR-X uses microwaves of 3 cm wavelength (9.65 GHz frequency). The available polarisation modes include single polarization and dual polarization, depending on imaging mode. Fully polarimetric (quad) polarization imaging is available as an advanced mode for dedicated acquisition campaigns. Ground range resolution depends on the acquisition mode. In Spotlight mode, a spatial resolution of up to 1 m can be achieved. The incidence angle varies from 15° to 60°. In this study we used data acquired in dual polarization (HH-VV) Stripmap mode.
RADARSAT-2 is a follow-on to RADARSAT-1 which mission terminated in April 2013. It uses C-band at 5.405 GHz. In contrast to TerraSAR-X, RADARSAT-2 offers fully polarimetric data to all interested users. Ultra-fine mode provides the highest spatial resolution of up to 3 m. The incidence angle varies from 10° to 60° depending on the beam mode. In this study we used fully polarimetric data (HH-HV-VH-VV) acquired in Fine Quad and Standard Quad Polarization mode. Details of the selected SAR data are given in Table 1.
Because the study area is remote, it was not possible to collect ground samples. Instead, archival Landsat images from 1984 – 2005 were used to analyse ice cover development at the Vermilion Chutes. In addition, studies related to this river reach that had been previously performed were used as sources of
Table 1. List of SAR data used in this work. Abbreviations: RS-2 for RADARSAT-RS-2 and TS-X for TerraSAR-X
3. METHODOLOGY
3.1 Characteristic of river ice types
In the first part of the study, we computed backscattering coefficient (σ0) values for the main ice types. To obtain the σ0 value using original SLC data we applied terrain correction with radiometric normalisation. The following ice types were selected:
Skim ice (SI)
Juxtaposed skim ice (JSI) Agglomerated skim ice (ASI) Frazil run (FR)
Consolidated ice (frazil or skim ice) (CI)
Skim ice forms on the supercooled water surface in slow flowing areas. It is very smooth and its radar reflectance is very low. The ridges between skim ice sheets have a larger radar reflectance allowing for differentiation between open water and an ice cover consisting of skim ice pieces. Juxtaposed skim ice forms when a skim ice run encounters a channel constriction or a downstream ice cover. In these cases skim ice sheets lay end to end and form thicker ice cover with higher radar reflectance. When discharge sets juxtaposed skim ice cover to motion and fragment, it causes thicker fragmented ice cover to form once they stop moving. In this study we call this type of ice cover as agglomerated ice. Due to its surface roughness it has higher radar reflectance than juxtaposed skim ice has. When the river
section is turbulent enough to cause supercooling of the entire water column, it results in frazil crystal growth throughout its depth. The crystals rise to the water surface to form frazil pans. Radar reflectance of frazil ice rises with the ice pan surface concentration. Consolidated ice cover forms during compression process of ice cover formed previously from juxtaposed or agglomerated frazil ice and skim ice. The compression can be caused by downstream force of gravity or shear stress from water flowing underneath. Consolidated ice cover may have several meters of thickness. Its surface is very rough which provides much higher radar reflectance than in case of any other ice cover type.
Backscattering values were computed also for open water (OW). Figure 3 shows examples of the selected classes. These result are presented in section 4.1.
Figure 3. Examples of selected classes. Abbreviations: SI for skim ice, ASI for agglomerated skim ice, JSI for juxtaposed skim ice, FR for frazil run, CI for consolidated ice (frazil or skim ice) and OW for open water
3.2 Polarimetric covariance matrix
Most polarimetric SAR systems measure the relationship between the transmitted and received electromagnetic wave in two orthogonal polarisations in the form of a scattering matrix
In the case of coherent scattering, a complex Sinclair matrix can sufficiently describe a target. However, in the case of non-coherent or partially non-coherent scattering, such as in most microwave remote sensing applications, the complete target characterisation covariance matrix is required (Tragl, 1990; Lüneburg, 1991; Touzi, 2004; Lee, 2009). For linear, fully polarised data, the covariance matrix has dimensions of 4 x 4 and is represented as follows:
(2)
where indicates temporal or spatial ensemble averaging. For dual-pol data, the covariance matrix has dimensions of 2 x 2. The covariance matrix contains complete information regarding amplitude, phase variance and correlation for all complex elements of the scattering matrix. In this study, polarimetric covariance matrix (Lee, 1999). The kernel size was chosen based on an analysis of the result obtained after filtration with different settings. A large kernel yields better image smoothing. Alternately, a small kernel preserves texture details. Different kernel sizes were tested, and the 11 x 11 kernel was finally chosen.
3.4 Supervised classification of polarimetric data
The six classes presented in section 3.1 were used in the supervised classification of five data sets. For RADARSAT-2 data from 15.12.13, five classes were selected due to the lack of representative areas of open water. For each class, training field contained about 2000 pixels. Training and test sites identification was based on trend of ice types distribution in the reach, presented in literature and on archival Landsat images, in consultation with local experts. As an input to the classification we used filtered covariance matrix. A supervised classification was performed using a maximum likelihood algorithm. Remote sensing generally uses maximum likelihood classification with a Gaussian distribution in the discriminant function. In the case of SAR polarimetric data represented in the covariance matrix, another approach must be applied. The elements of the covariance matrix exhibit a Wishart distribution. Therefore, this type of distribution must be used in the discriminant function (Lee, 2009; Canty, 2014). Classification accuracy was calculated with test fields independent from training sites. Depending on class, 2000 – 5000 pixels were used for validation. The accuracy of classification is presented in section 4.2.
4. RESULTS AND DISCUSSION
4.1 Characteristics of river ice types
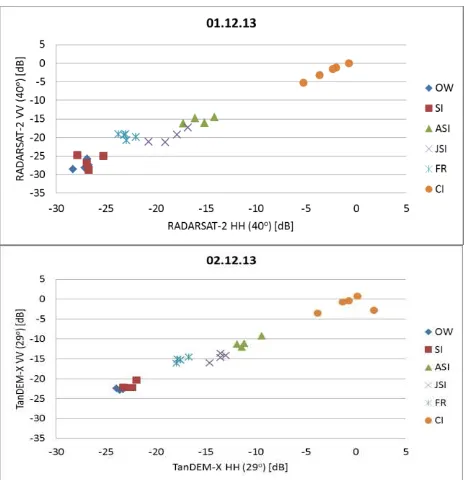
The range of backscattering values for selected classes was similar for HH and VV polarisation using each data set. Figure 4 shows backscattering values for RADARSAT-2 data from 01.12.13 and TerraSAR-X data from 02.12.13. The highest values are related to consolidated ice (CI) because of its surface roughness. They vary from approximately -5 dB to 0 dB. For all data sets this class is well isolated from the others. The lowest backscattering values are associated with open water (OW) and vary from -30 dB to -20 dB depending on the incidence angle and frequency. For the highest incidence angles at both frequencies (29o for TerraSAR-X and 40o for RADARSAT-2) skim ice (SI) exhibit values that are similar to those of the open water class (Figure 4). Other classes display values between -25 dB and -5 dB and, generally follow the order frazil ice, juxtaposed skim ice and agglomerated skim ice (from the darkest to the brightest).
Figure 4. Backscattering values (in dB) in HH and VV polarisations for RADARSAT-2 (upper image) and TerraSAR-X (lower image) acquired on 1st and 2nd December. Abbreviations: OW for open water, SI for skim ice, ASI for agglomerated skim ice, JSI for juxtaposed skim ice, FR for frazil run and CI for consolidated ice (frazil or skim ice)
Figure 5 Backscattering values (in dB) for TerraSAR-X and RADARSAT-2 data acquired on 08.12.13. Abbreviations: OW for open water, SI for skim ice, ASI for agglomerated skim ice, JSI for juxtaposed skim ice, FR for frazil run and CI for consolidated ice (frazil or ski ice)
An notable scenario was observed for frazil run (FR) and juxtaposed skim ice (JSI) which differ with backscattering values in only one polarisation and have similar values in the second polarisation. In case of data acquired on 01.12.13 and 02.12.13 it is HH polarisation (Figure 4.). For RADARSAT-2 data acquired on 08.12.13 these two classes have similar values in HH polarisation and varied in VV polarisation (Figure 5).
This could be an effect of high incidence angles. This situation was not observed on TerraSAR-X data with the lowest incidence angle value (23o). To confirm the hypothesis further research are recommended. So far, based on the observation we can conclude that data with dual polarisations are better for distinguishing ice types than are single-pol images. Single frequency dual polarisation data also seems more efficient than dual frequency dual polarisation data (Figure 5.).
4.2 Supervised classification
Figure 6. shows classification results for RADARSAT-2 and TerraSAR-X data acquired on 08.12.2013. The difference between acquisition times of both data sets was about 15 minutes. Therefore, we assumed that they presented the same ice cover stage. Using the TerraSAR-X image, borders of skim ice were misclassified as frazil run (km 910 to km 913). On the other hand, open water between skim ice sheets was correctly classified with this data (Figure 7.). Using RADARSAT-2 image these areas were misclassified. It may be a result of larger pixel. Additionally, borders of very thin skim ice (Figure 7.) were classified only with TerraSAR-X data. In this case, it may be a consequence of using higher frequency, resulting in shorter wavelength. Similar comparison of classification results for other data set pairs were not possible due to the differences between acquisition dates. Therefore, the overall accuracy values and the kappa coefficient were used to evaluate their effectiveness for river ice monitoring.
Open water (OW)
Skim ice (SI)
Juxtaposed skim ice (JSI)
Agglomerated skim ice (ASI)
Frazil run (FR)
Consolidate ice (CI)
Figure 6. River ice types on 08.12.2013 based on RADARSAT-2 (upper image) and TerraSAR-X (lower image)
Figure 7. River ice type on 08.12.2013 (km 210.5 - km 212.5) based on TerraSAR-X data
For all data sets, the overall accuracy was higher than 80%. classified data. Abbreviations: RS-2 for RADARSAT-2 and TS-X for TerraSAR-TS-X
For all images, the best results (the highest user’s and producer’s accuracies) were obtained for the consolidated ice (CI) class. For other classes, three main problems were observed during classification. The first is related to skim ice (SI) and open water (OW). It occurred using the RADARSAT-2 data from 01.12.13 and TerraSAR-X data from 02.12.13. The skim ice surface is smooth and does not contain air bubbles, resulting in low backscattering similar to that of open water. The second problem relates to distinguishing agglomerated skim ice (ASI) and juxtaposed skim ice (JSI). It was observed using three datasets (RADARSAT-2 01.12.13, TerraSAR-X 02.12.13 and TerraSAR-X 13.12.13). Both of these classes have the same origin, skim ice, and they differ in its concentration. Agglomerated ice is more packed than juxtaposed ice; however, there is no strict boundary between them. The last issue is related to skim ice (also juxtaposed skim ice) and frazil runs. This problem occurred for two data sets (RADARSAT-2 and TerraSAR-X) from the same day (08.12.13). At borders between skim ice sheets, the backscattering value is higher due to ice roughness. Therefore, these places may be classified as frazil ice, which is generally characterised by a higher backscattering value than is skim ice. This type of problem was also noted by Jasek (2013).
5. CONCLUSION
The aim of this study was to compare TerraSAR-X data with RADARSAT-2 data to evaluate their usefulness for river ice monitoring on the Peace River. For both frequencies similar backscattering values were observed for selected ice classes. In this study, we observed that the incidence angle, compared to the frequency, had a greater influence on the σ0 values of selected ice types. To evaluate only the impact of the frequency, it is recommended to use data that keep all other parameters (incidence angle, pixel size, etc.) invariable. Using data from both systems we obtained classifications presenting some differences but with similar overall accuracy. Additionally, the same main issues were observed for both TerraSAR-X and RADARSAT-2 data: misclassification between skim ice and open water and misclassification between skim ice and frazil run. Based on this study we conclude that TerraSAR-X data and RADARSAT-2 data exhibited similar abilities for ice cover monitoring at the Vermilion Chutes.
ACKNOWLEDGEMENTS
The authors would like to thank the Canadian Space Agency (CSA) and German Space Agency (DLR) for providing data.
REFERENCES
Canty, M. J., 2014. Image analysis, classification and change detection in remote sensing: with algorithms for ENVI/IDL and Python. CRC Press. Adaptation of a radar-based river ice mapping technology to the Nunavik context. Canadian Journal of Remote Sensing, 36(sup1), S168-S185.
Geldsetzer, T., van der Sanden, J. J., Drouin, H., 2011. Advanced SAR applications for Canada's river and lake ice. In 2011 IEEE International Geoscience and Remote Sensing Symposium; Vancouver; CA; July 24-29, 2011.
Hall, D. K., & Martinec, J., 1985. Lake and river ice. In Remote Sensing of Ice and Snow (pp. 82-108). Springer Netherlands.
Jasek, M., Gauthier, Y., Poulin, J., Bernier, M., 2013. Monitoring of Freeze-up on the Peace River at the Vermilion Rapids using RADARSAT-2 SAR data. In Proceedings of the 17th Workshop on River Ice, Edmonton, Alberta (pp. 21-24).
Lee, J. S., Grunes, M. R., De Grandi, G., 1999. Polarimetric SAR speckle filtering and its implication for classification. Geoscience and Remote Sensing, IEEE Transactions on, 37(5), 2363-2373.
Lee, J. S., Pottier, E., 2009. Polarimetric radar imaging: from basics to applications. CRC press.
Lindenschmidt, K. E., van der Sanden, J., Demski, A., Drouin, H., & Geldsetzer, T. (2011, September). Characterising river ice along the Lower Red River using RADARSAT-2 imagery. In
Proceedings of the 16th Workshop on River Ice, Winnipeg, MB
(pp. 18-22).
Lüneburg, E., Ziegler, V., Schroth, A., Tragl, K., 1991. Polarimetric covariance matrix analysis of random radar targets. AGAwRD, 15.
Mermoz, S., Allain, S., Bernier, M., Pottier, E., 2009. Investigation of Radarsat-2 and Terrasar-X data for river ice classification. In Geoscience and Remote Sensing Symposium, 2009 IEEE International, IGARSS 2009 (Vol. 2, pp. II-29). IEEE.
Prowse, T. D., 2005. River‐ice hydrology. Encyclopaedia of hydrological sciences
Touzi, R., Boerner, W. M., Lee, J. S., Lueneburg, E., 2004. A review of polarimetry in the context of synthetic aperture radar: concepts and information extraction. Canadian Journal of Remote Sensing, 30(3), 380-407.
Tragl, K., 1990. Polarimetric radar backscattering from reciprocal random targets. Geoscience and Remote Sensing, IEEE Transactions on, 28(5), 856-864.
Van der Sanden, J. J., Drouin, H., Hicks, F. E., Beltaos, S., 2009. Potential of RADARSAT-2 for the monitoring of river freeze-up processes. In Proceedings of the 15th Workshop on
River Ice, St. John’s, NL, Canada (pp. 14-17).
Van der Sanden, J. J., Drouin, H., 2011. Satellite SAR observations of river ice cover: A RADARSAT-2 (C-band) and ALOS PALSAR (L-band) comparison. In Proceedings of the 16th Workshop on River Ice, Winnipeg, MB (pp. 18-22).