THE CARTOGRAPHIC CONCEPT OF THE IMAGE MAP V. Vozenilek a*, L. Belkab
a
Palacky University Olomouc, Dept. of Geoinformatics, 17. listopadu 50, 776 41 Olomouc, Czech Republic – [email protected]
b Military Geographic and Hydrometeorological Office, Cs. odboje 676, 518 16 Dobruska, Czech Republic –
Special Session, SpS 4
KEY WORDS: Visualization, image, image map, map content, remote sensing.
ABSTRACT:
Image maps have become very popular and frequently produced cartographical outputs during recent years. However, the unambiguous terminology, definitions, content and appearance specification have not been widely researched. The paper deals with the new definition of image map, its components delineation, and basic classification. The authors understand the image map as a special map portraying geographic space in a particular cartographical projection and map scale, where its content consists of two basic components – image and symbol components. Image component is represented by remote sensing image(s), while symbol component is represented by cartographical symbols. An image map has to have three essential attributes: cartographical projection, map scale and symbol component by means of map language. The authors also present aspects of topographic and thematic image maps.
* Corresponding author
1. INTRODUCTION
Images captured by means of remote sensing are a very important source of geospatial information. Various cartographical visualization methods and forms (softcopy and hardcopy) are used in presentations of remote sensing images. In general, geospatial information extraction from remote sensing is a very advanced and complicated issue (Kudelka et. al. 2012). The authors have focused their research on situations when remote sensing images are used in cartography, not on information derived from the images, such as classified thematic rasters.
Maps as orthogonal projections of geographic reality on a plane, currently produced by modern geoinformation means, allow us to fuse (compose, combine) particular orthogonal and scale-synchronized layers into one image of a landscape. Orthogonal georeferenced aerial and satellite images have been chosen as one of these layers for the authors’ research described in this paper.
The idea of orthophotomap (image map) construction is not purely new. Some papers mentioning combination of (ortho)imagery and symbolized information have been published in the past. Aspects of orthophotomap creation briefly touched Petrie (1977). He outlined some design issues which the paper authors have had to deal with as well. He mentioned importance of cartographic enhancement (symbol component) represented mainly by contours. Lillesand et al. (2004) defined topographic orthophotomap as orthophotophotos superimposed with contours, topography is portrayed by orthophotographs and hypsometry by contours. Robinson et al. (1995) defined orthophotomap as orthophotographs mosaic overprinted by map symbols. Reiss (1997) mentioned orthophotomap production in Bavaria (Germany). There were grayscale orthophotograps overlayed by contours, cadastral map or other thematic
information. However, during studies of literature the authors have not come across any coherent basic research dealing with the cartographic concept, design and application of image maps.
Cartographers and remote sensing specialists have been, up to now, solving particular topics concerning image maps separately. Many authors present individual approaches for the creation of various thematic maps, as published in Vozenílek 2005, Kraak 1996, Slocum et al. 2005, Robinson et al. 1995, Pravda, Kusendová 2007. However, they have not dealt with the relationship between symbols and orthophotographs, especially orthoimages used as a topographic base. Similarly, remote sensing and digital image processing research is focused on information extraction (Alvarez et al. 2008, Baltsavias 1996, Longbotham et al. 2012, Sirmacek, Unsalan 2011) from images but orthoimage usage for cartographical purposes is rarely investigated.
The presentation of an innovative image map concept is the main aim of this paper. The contents of image maps and their appropriate classification have been outlined. The general concept has been verified through the authors’ image map examples..
2. CONCEPT OF IMAGE MAP
During the theoretical construction and definition of the term „image map“ it is necessary to point out that there is no homogenous understanding of this term and related terms, neither in the technical practice, nor among the academic community.
First, it is important to note that the authors tried to find appropriate term currently used in cartography. The term orthophotomap is quite well-known and widespread. Its various The International Archives of the Photogrammetry, Remote Sensing and Spatial Information Sciences, Volume XLI-B4, 2016
definitions have been constructed and presented in the past. They can be divided as follows:
definitions within national or international standards – for instance in ISO/TC211 (standard number ISO 19101-2) the term “image map” does not exist, only the term “orthoimage” is defined as „an image in which the displacement of image points has been removed by orthogonal projection to a reference surface due to sensor orientation and terrain relief“; definitions presented in specialized cartographical
literature;
non-cartographical definitions, for example the University of Texas Libraries (2011) define orthophotomap as „an orthophotographic map with contours and cartographical symbols, presented in a standard format and related to standard reference systems“ or Voigt (1998) as „a map made by assembling a number of orthophotographs into a single, composite picture".
Nevertheless, the authors have revealed that in literature the term orthophotomap and its applications are often questionable and even incorrect. The orthophotomap is often confused with a mosaic of georeferenced orthophotographs.
Finally, the authors have decided to use the term “image map”, which differs from the more common term “orthophotomap”, where the word “image” replaces the word “photograph”. These two terms are understood and used distinctly by the authors in Lillesand et al. (2004). Since the term “image” covers a wider range of remote sensing imagery than the term “photograph”, the authors have applied it during the definition of the theoretical concept. Therefore the authors prefer the term “image map” instead of “orthophotomap”. Even though the authors have been using already known term “image map”, they presume that images used for image component are currently orthorectified. It is obvious that using of orthorectified image ensures properly spatially synchronised both image and symbol components.
The authors understand the image map as a special map portraying geographic space in a particular cartographical projection and map scale, where its content consists of two basic components – image and symbol components. Image component is represented by remote sensing image(s), while symbol component is represented by cartographical symbols. An image map has to have three essential attributes: cartographical projection, map scale and symbol component by means of map language (Pravda 2003).
Map content consists of image component and symbol component. The design and mutual harmonization of these two components are influenced by image map goals and purposes.
2.1Image component of image map
Image component of image maps is commonly presented by orthogonal aerial or satellite photographs or orthophotographs. From a more general point of view, image component can be represented by any orthogonal image data as a result of capturing remote sensing image sensors data, for example radar images.
Photographs, which become orthophotographs after the orthorectification process, can be divided according to various viewpoints. The use of particular types of images influences their application in image map creation and is reflected in image
An optical image, captured by a sensor in the visible spectral range distinguishing blue, green and red electromagnetic wavelengths, is a real image of a landscape at the time of image capture. The image colour representation (radiometry) is identical with human-eye interpretation of the world. These images represent true capture of landscape and can be considered as an understandable representation of reality. The authors pay most attention to these images in their research.
However, there are situations when some objects cannot be readable from an image or the information extraction might be inaccurate or time-consuming, for instance:
one object is overlapped by another – radial displacement exists in the image due to central projection in which the image has been captured; objects are inclined in an off-centre direction, the larger the distance of the object from the centre and the taller the object, the bigger the object tilt; for example tilted objects such as tall building can hide smaller adjacent objects such as trees or bridges; the shift of the top of tilted objects is not usually carried out during the orthogonalisation process, only the foot of these objects is located correctly; only on a true-orthoimage we can state that the top of an object corresponds to its foot;
continuous vegetation coverage, such as canopy, hides objects underneath, for example trees hide tracks and streams in forest areas;
some phenomena cannot be captured, for example administrative boundaries or hypsometry (i.e. spot heights, contours);
objects lying in shadows of other objects are difficult to identify, for example a lake in the shadow of a mountain range;
when the size of the object is less than the image spatial resolution, the object cannot be identified (mainly point objects such as monuments, water tanks, etc.);
an image cannot display and provide object semantic meanings; semantic meaning can only be applied by a cartographical symbol, for example a building can be detected in an image but its type cannot be determined (hospital, school, church); in this case the object is portrayed twice on an image map: first, in the image as a reality capture and secondly by the cartographical symbol which provides additional object information; objects in an image do not have labels;
objects with the same semantic meaning and portrayed by the same cartographical symbol in conventional maps look different in an image; this circumstance slows down image readability.
Image content is the set of all images (objects and processes) caught at the time of image capture. These images can be read by the human eye or with the help of technical aids (magnifier glass, programme, etc.). Image content is influenced by photograph capture parameters, ortogonalisation parameters and methods of image map assembling.
Readability and object identification conditions related to image component determine image map content and saturation (Kudelka et al., 2012). Spatial resolution is the most important aspect. Spatial resolution determination has been studied in previous authors’ papers (Bělka, manuscript).
2.2Symbol component of image map
Image component does not contain everything which is required to meet the goals of an image map. Therefore image map content is complemented by the compilation of symbol component. The symbol component conveys information specified in accordance with the map goals.
Symbol component is represented by the set of vector layers (points, polylines, polygons and text). In this framework cartographical symbols chosen from predefined symbol keys are assigned to each feature and their properties. The symbol component contains common symbols of natural and human-made phenomena (Svobodová, Vozenílek 2010). Orthoimage map content and saturation are determined by goals of a map.
Vector layers are created in a similar way to conventional map composition (digitalisation on an image, terrain surveys, geospatial analyses, etc.). Both image and symbol components are harmonized during image map production. It is necessary to balance both components. Two situations can occur from a layers is generated from a different source and object locations do not correspond with those captured by the image, mutual harmonization is complicated.
The authors distinguish topographic image maps and thematic image maps.
3. TOPOGRAPHIC IMAGE MAPS
The term “topographic image map” is defined analogically as with the term topographic map. Topographic maps with their topographic and hypsometric content are one of the most important sources of geographic information. They are used both as reference large-scale maps and as a planning and topography (in some cases also hypsometry) of a mapping area, whereas image is the main source of information.
An image represents an image component, while a symbol component consists of symbols and labels of key features which cannot be captured by the image component or have to be highlighted. An image is either grayscale (monochrome) or true-colour which represents the best readability from the user’s point of view.
City plans can be mentioned as an example of topographic image map. They are compiled from aerial images complemented by a symbol component consisting of street labels. Image maps replacing conventional topographic maps but taking over scale and symbology, can be presented as another example (see topographic image map example below).
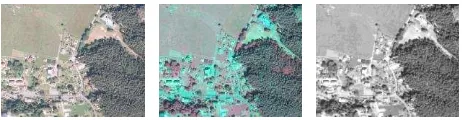
Figure 1. True colour (left), false colour (middle) and grayscale (monochrome) (right) image
With regards to the situation where the image component provides general information about a mapped area and identifies objects and their layout, it is recommended:
- image spatial resolution (level of detail) should correspond with the image map scale (see topographic image map example below),
- true-colour images are preferred as they provide a true view of an area (fig.1),
- grayscale image with full radiometric range exploitation can also be used, for example when true-colour is not available or there is a need for symbol component enhancement (see topographic image map example below).
4. THEMATIC IMAGE MAPS
The term “thematic image map” can also be defined analogically as with the term “thematic map”. A thematic map is a purpose-built cartographical product where a specified theme is preferred. One or more specific features are highlighted, whereas others are suppressed or even omitted.
A thematic image map is a cartographical product where one or a group of themes have priority over auxiliary ones, whereas image benefits are exploited to express thematic content or to use it as a topographic base. Thematic content can be expressed by either image or symbol component (fig. 2). New naming convention is introduced for the thematic image maps. The new terms have been generated to express image component function in thematic image maps. Image component carries theme whereas symbol component serves as topographic base in “front thematic image maps”. When image component serves as topographic base whereas symbol component carries theme the thematic image map is called “back/rear thematic image map”. In case that image component fulfils both functions the thematic image map is called “double thematic image map”.
Thematic content
Figure 2. A combination of image and symbol components in the thematic image map
True-colour or grayscale images are applied in thematic mapping for example to express visible objects and processes in a landscape, such as floods and occurrence of plant species, etc.
Multi-band images with near infrared, middle infrared and thermal bands are used in thematic image maps. False colour composites are also often preferred to true colour composites. The false colour composites are thought not to be user friendly, thus additional information about applied bands has to be provided.
As examples: thematic image maps with near infrared images are used to detect vegetation and its health; the thermal images are used to map thermal radiation of the Earth’s surface and to detect fire spots; the radar images can be used to portray soil moisture; near and middle infrared images can detect minerals and rocks, etc. In all these examples, thematic information is provided by the image in its original unclassified form (see chapter 4.3).
A symbol component can be applied to portray basic features (hydrography network, roads, settlement labels, etc.) to facilitate comfortable and fast location of their positions and general orientation. In this case, it is not necessary to use a symbol component to express all information which cannot be extracted from an image component.
The opposite situation occurs when a symbol component is an essential information source and an image component provides additional (mostly topographic) information and is suppressed. For example, tourist image maps have thematic features (such as tourist tracks, information offices, hotels, bus and train stations) overlapping the true colour image. It is assumed that true colour composite will be used in the image component of that thematic image map. It is not recommended to complicate the content and readability by using other false colour composites. Greyscale image application appears suitable. The topographic base can be suppressed in this case, whereas a symbol component will be enhanced and supported by appropriate colour application (see chapter 4.2).
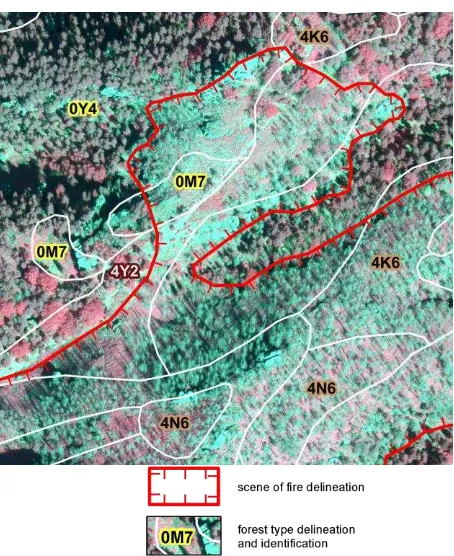
Similarly, as in the case of conventional thematic maps, it is often quite difficult to determine which component (either image or symbol) contains thematic content and which contains topographic base. Both image and symbol components can be used to express thematic information. For example, a false colour orthoimage in a near infrared band provides primary thematic information (forest health status), whereas a symbol component with text gives secondary thematic information (forest typology) (fig. 3).
In cases where an orthoimage is the main bearer of a theme, it is not necessary for a maximum spatial resolution to correspond to the image map scale. Qualitative thematic information is more important. For example, when portraying areal features, the spectral characteristic of an image is preferred, whereas the importance of spatial resolution diminishes (see chapter 4.3). In cases where image spatial resolution does not match image map scale, particular pixels of an orthoimage can be distinguished and are readable (see chapter 4.4). Bilinear interpolation or cubic convolution is applied to display and smooth the image.
Figure 3. Expression of thematic information by both image and symbol component
According to mapping themes and purposes of image map applications, the following image characteristics are preferred:
original image spatial resolution, which means spatial resolution of a captured image – the highest spatial resolution related to the image map scale is applied when the immediate state of a captured area is important and point features are the main subject of thematic mapping (i.e. cars locations),
number of spectral bands – a one-band image can only be expressed as a grayscale image, while multispectral images can be displayed as a three-band true (for red, green, blue bands) or false (for example for near infrared, red, blue bands) colour composite (Alvarez et al., 2008),
spectral characteristics – three-band composites are appropriate for mapping fires, geology and canopy mapping.
5. DISCUSSION
The authors aim to encourage cartographers to discuss the terms describing special cartographical products where remote sensing images are exploited for their compilation. Several terms can be considered to apply. Finally, the image map substituting the orthophotomap has been introduced. The term “image” instead of “photograph” has been used because of its wider meaning. Other remote sensing image data that does not have the attributes of photographs can also be considered for cartographical visualization.
During the compilation of the examples the authors could not cover and elaborate on all aspects of this issue. The four composed examples have been published in the paper. Moreover, additional four examples representing one topographic and three thematic image maps have been developed (see fig. 2). Nevertheless, these examples represent The International Archives of the Photogrammetry, Remote Sensing and Spatial Information Sciences, Volume XLI-B4, 2016
only part of a huge number of possible cartographical outputs exploiting remote sensing image data. The authors have developed more examples of thematic image maps (Belka, Vozenílek 2014), for example:
Health status of forest crop (1 : 2 500) with a health status of a forest crop (the primary thematic information) as an image component and a forest typology (the secondary thematic information) as a symbol component.
Planning the transfer of military units in vehicles on land (1 : 15 000) with a colour aerial orthoimagery with spatial resolution 1.5 m resampled from an original resolution of 0.25 m as an image component and thematic and topographically oriented features selected from Digital Terrain Model 25 (river network, railways etc.) with transparency 40% as a symbol component.
Urban plan (1 : 5 000) with an aerial orthoimagery (colour or grayscale) as an image component and functional areas (areas of an urban plan classified according to their function) as a symbol component.
Based on the practical tasks carried out with all the above introduced examples, it can be stated that all ones are readily applicable in cartographical and geographic practice (as in Marjanovic et al. 2011).
The resolution of many conceptual and technical issues is one benefit of the authors’ research. While resolving particular issues the authors often came across situations requiring more detailed investigation. Some authors’ results achieved in this field can be considered a starting point and should be developed through research.
Based on the experience gained through the example compilation, the authors have focused their research on the following topics:
the spectral information saturation of the image component,
the symbol component colour specification automation in relation to the image component, the creation of labelling, its automatic colouring and
placement,
the user issues in image map applications,
the compilation and application of the raster image legend,
the image component suppression by decreasing spatial resolution,
the cartographical use of other remote sensing images.
The authors have attempted to construct an objective definition of an image map. Their definition (see above) is based on the content of an image map being divided into two equal components which supplement each other – the image and symbol component. During the definition construction the authors focused on two basic aspects: its correctness from a cartographical view and its independence from current cartographical production using geoinformatics technology. The image component is a key aspect of the image map concept. The image map doesn’t exist without the image component. The authors have followed their theoretical concept when determining the image map content, classifying the image maps and designing particular examples.
The authors acknowledge that remote sensing image data, other than aerial and satellite orthoimages, can be a part of the image component, for example hyperspectral image data, thermal image data and image data captured by active sensors (see chapter 4.4).The authors consider that this extension of other image data applications shifts the significance of the term and its understanding from “orthophotomap” to “image map”. For example in case of the front thematic image map mentioned in chapter 4.4, the concept of orthophoto can be justly questioned, because although the image component consists of image data in orthogonal projection it cannot be considered as a photo according to Lillesand and Kiefer (2004).
It is necessary to state that the image map concept and all the examples meet all map application guidelines, including the requirements for advanced methods of map information content analysis (Tucek, Paszto, Vozenílek 2009; Dvorsky, Snasel, Vozenilek 2009; Dvorsky, Snasel, Vozenílek 2010).
6. CONCLUSIONS
The potential of remote sensing image data for cartographical visualisation is significant. The unclassified image immediately used in map compilation speeds up the transmission of the spatial information from the map to the user, although preprocessing of the image component and further conventional map making are often time-consuming. However, this potential of the image map has not been investigated enough. Due to the compilation of the examples the authors have indicated some trends and outlined ways to deal with them. However, they admit that further elaboration would be needed to prove the trends applicability.
In general, it can be stated that in image map compilation a cartographer treats two sources of information – image and vector dataset. The image portrays reality at the time of its capture. However, this source misses some information due to the objective reasons mentioned above. It is important that information volume and its localization correspond to reality. On the contrary, the symbol component is already a reality abstraction in which the features are simplified and selected according to predefined rules. Generalization methods then have to be applied. The proper harmonization of both components poses the main problem during the image map compilation.
The authors present a more accurate definition of an image map by introducing and specifying two terms: the image component and the symbol component. The authors have determined the basic concept of an image map. The concept should be followed in the design and compilation of image maps to maintain a high quality cartographical product. The new “topographic image map” and “thematic image map”, as specific maps made with remote sensing images, have been introduced via four presented examples whereas additional four examples have been developed. Many of the technical aspects and parameters necessary to achieve maximum ability to interpret geographical reality through the use of image maps have been described. The examples of topographic and selected thematic image maps can be used either as a basis for other specialized discussions or as a template for image map design and creation in the Czech Republic.
REFERENCES
Alvarez, L., Castano, C. A., Garcia, M. et al. (2008), Multi-channel satellite image analysis using a variational approach. Pure and Applied Geophysics, Vol. 165, Issue: 6, 1071-1093.
Baltsavias, E. (1996), Digital ortho-images - a powerful tool for the extraction of spatial- and geo-information, ISPRS Journal of Photogrammetry & Remote Sensing, 51, 63-77. Belka, L. (Manuscript), Carthographic Aspects of Remote
Sensing Materials.
Belka, L., Vozenilek, V. (2014): Prototypes of Orthoimage Maps as Tools for Geophysical Application. Pure and Applied Geophysics, Vol. 171, Issue 6, 1047-1059
Burian, J. (2009), Geoinformatics in urban planning. Rigorous thesis. [In Czech: Geoinformační technologie v územním plánování.] (Charles University, Prague 2009).
Dobrovolný, P. (1998), Remote sensing. Digital image processing. [In Czech: Dálkový průzkum Země. Digitální zpracování obrazu.] (Masaryk University, Brno 1998). Dvorsky, J., Snasel, V., Vozenilek, V. (2009), Map Similarity
Testing Using Matrix Decomposition, 2009 International Conference On Intelligent Networking And Collaborative Systems (INCOS 2009), 290-294.
Dvorsky, J., Snasel, V., Vozenilek, V. (2010), On maps comparison methods, 2010 International Conference on Computer Information Systems and Industrial Management Applications, CISIM 2010, art. no. 5643513, 557-562. Kraak, M. J., Ormeling F. J. (1996), Cartography - visualization
of spatial data (Harlow, Essex: Addison Wesley Longman Ltd. 1996).
Kráčmar, J. (2011), Meteorlological radars [In Czech: Meteorologické radiolokátory [online] [cit. 2011-8-21], http://www.chmi.cz/files/portal/docs/meteo/rad/info_radar/i ndex.html
Kudelka, M., Horak, Z., Vozenilek, V., Snasel, V. (2012): Orthophoto Feature Extraction and Clustering. Neural Network World, Vol. 22, No. 2, pp. 103-121.
Lillesand, T. M., Kiefer, R. W., Chipman, J. W. (2004), Remote Sensing and Image Interpretation, 5th edition (Wiley, New York 2004, ISBN 978-0-47-145152-5).
Longbotham, N., Chaapel, C., Bleiler, L. et al. (2012) Very High Resolution Multiangle Urban Classification Analysis. IEEE Transactions on Geoscience and Remote Sensing, Vol. 50, Issue 4, 1155-1170.
Marjanovic, M., Kovacevic, M., Bajat, B., Vozenilek, V. (2011), Landslide susceptibility assessment using SVM machine learning algorithm, Engineering Geology, Vol. 123, No.3, 225-234.
Poláček, J., Beneš, J., Poláčková, V. (2007), Minimum standard for digital processing of urban plans in GIS in the Pardubice Region in accordance with new Construction law [In Czech: Minimální standard pro digitální zpracování územních plánů v GIS v Pardubickém kraji v prostředí nového Stavebního zákona.] (Regional Authority of the Pardubice Region 2007).
Pravda, J. (2003), Map Language [In Slovak: Mapový jazyk] (Vydavateľstvo Univerzity Komenského, Bratislava 2003). Pravda, J., Kusendová, D. (2007), Applied Cartography [In
Slovak: Aplikovaná kartografia] (Geografika, Bratislava 2007).
Reiss, P. (1997), Production of Digital Orthophotos and Orthophotomaps at the Bavarian Land Survey Office, Photogrammetric Week 97, Wichmann Verlag, Heidelberg, 293-302.
Robinson, A. H., Sale, R. D., Morrison, J. L. et al. (1995), Elements of Cartography (John Wiley & Sons, New York 1995).
Rybanský, M., Čapek, J. (2007), Critical Transportation Spots on the Roads, EUGEO 2007 Conference, Amsterdam, Netherlands, 4.
Sirmacek, B., Unsalan, C. (2011), A Probabilistic Framework to Detect Buildings in Aerial and Satellite Images, IEEE Transactions on Geoscience and Remote Sensing, Vol. 49, Issue: 1, 211-221.
Slocum, T. A., Mcmaster, R. B., Kessler, F. C., Howard, H. H. (2005), Thematic Cartography and Geographic Visualization (Pearson/Prentice Hall, Upper Saddle River 2005).
Svobodova, J., Vozenílek, V., (2010), Relief for Models of Natural Phenomena, In: Anděl, J., Bičík, I., Dostál, P.,Shasneshin, S. (eds.): Landscape Modelling: Geographical Space, Transformation and Future Scenarios (Urban and Landscape Perspectives) (Dordrecht, Springer 2010) pp. 183-196.
Tolasz, R. et al. (2007), Atlas podnebí Česka / Climate Atlas of Czechia (ČHMÚ, Praha 2007).
Tucek, P., Paszto, V., Vozenilek, V. (2009), Regular use of entropy for studying dissimilar geographical phenomena, Geografie, Vol. 114, No. 2, 117-129.
University of Texas Libraries (2011), Glossary of Cartographic Terms, University Of Texas At Austin. [online] [cit. 2011-8-19], http://www.lib.utexas.edu/maps/glossary.html Voigt, B. (1998), Glossary of Coastal Terminology, Washington
State Department of Ecology, Coastal Monitoring & Analysis Program, Publication No. 98-105. [online] [cit. 2011-8-19],
http://www.coastalatlas.net/index.php?option=com_glossary &func=view&Itemid=37&catid=12&term=ORTHOPHOTO MAP
Vozenilek, V. (2005), Cartography for GIS – geovisualization and map communication (Palacky University, Olomouc 2005).