Evaluation of the livestock carrying capacity of land resources in the
Hills of Nepal based on total digestive nutrient analysis
Gopal B. Thapa
∗, Giridhari Sharma Paudel
School of Environment, Resources and Development, Asian Institute of Technology, P.O. Box 4, Klong Luang, Pathumthani 12120, Thailand
Received 26 February 1999; received in revised form 13 July 1999; accepted 23 September 1999
Abstract
Land degradation and poverty caused by traditional arable agriculture have been serious problems in the ecologically fragile and economically backward mountains of Nepal. There is a prospect to address both of these problems to some extent by promoting livestock raising. However, a large livestock population exceeding the carrying capacity of land resources will risk undermining the sustainability and productivity of these resources. On the basis of these concerns, this study analyzes the carrying capacity of land resources under on-going and improved management systems based on total digestive nutrient (TDN) demand and supply situation in the study area. Results of analyses revealed that under the current type of management system, land resources in Shyangja district could provide the required amount of TDN to 147,735 livestock standard units (LSU), whereas the total number of LSU had already reached 203,510 as of 1996/97. Provided improvements are made in forest and grazing-land management as well as in crop production and agroforestry systems in line with assumptions made, land resources in the study area will be able to accommodate additional 6408 LSU on top of existing stock by the year 2001/02 and 63,113 LSU by the year 2006/07. ©2000 Elsevier Science B.V. All rights reserved.
Keywords: Land resources; Land degradation; Carrying capacity; TDN demand and supply; Livestock; Nepal
1. Introduction
Roughly, two-fifths of Nepal’s population is below the poverty line (CBS, 1998). The situation is worse in the middle mountain region, normally referred to as the Hills. In the past, the hill people had adopted strategies of expansion of agricultural lands, cropping intensification, and out-migration in response to the ever-increasing demand for food and fiber. Specif-ically, the land use based strategies have inflicted serious damage on forest resources and accelerated soil erosion (MPE, 1998). The scope of expansion of
∗Corresponding author. fax:+66-2-5245631.
E-mail address: [email protected] (G.B. Thapa).
agricultural land has virtually vanished now as most agriculturally suitable lands have already been brought under cultivation (Bajracharya, 1983; Thapa and We-ber, 1990; Metz, 1994). There is also very limited prospect for cropping intensification due to unavail-ability of irrigation water and poor soil quality. The mountain environment, however, offers other opportu-nities to improve the local economy. Livestock raising is one of the important production potentials which can contribute to farm household economies, partic-ularly, in locations accessible to market centers. In favorable locations of the mountain regions of Nepal (Paudel, 1997), Laos (Pravongviengkham, 1998) and other Southeast Asian countries (Simaraks, 1998), farmers have economically benefited by integrating
livestock with field crop cultivation. Another major benefit is that a well managed livestock raising sys-tem helps to control land degradation, which has been a prominent characteristic of the current mountain agricultural systems.
Livestock raising is, in principle, both an environ-mentally and economically sound activity, but report-edly, the livestock population exceeds the carrying capacity of land resources in the Hills (ICIMOD, 1985; EPC, 1993). As a result, livestock cannot ob-tain required amounts of feed to mainob-tain their body weight which is detrimental to their productive ca-pability (Rajbhandari and Shah, 1981). Overgrazing of range-lands, degradation of forests, complete re-moval of vegetative cover, and compacting of the soil are other consequences which have threatened to un-dermine the sustainability of local economies, which very much depend on land and forest resources, and ecological balance (ICIMOD, 1985; Carson, 1992; EPC, 1993). Maintaining or ameliorating the existing stock of natural resources is a necessary condition to facilitate ecological processes (Pearce et al., 1990).
Nepal is one of a few countries in the Asia Pa-cific region with very high livestock population den-sity per unit of arable land (ICIMOD, 1985). In a very densely populated country like Bangladesh, for exam-ple, there are four livestock per hectare of arable land, while there are about seven livestock in Nepal (FAO, 1990). This cannot be considered as an indicator of over population for two reasons. Firstly, it does not explain anything about the carrying capacity of land resources that vary from one place to another depend-ing on biophysical conditions and management prac-tices. Secondly, livestock in the Hills of Nepal do not depend on arable lands only. A substantial proportion of their fodder and forage requirement is fulfilled by forests and range-lands (Metz, 1994; Fox, 1993).
Studies on fodder demand and consumption (Rajbhandari and Shah, 1981; Fox, 1993; Amatya et al., 1996) reflect fodder adequacy or inadequacy at farm household level. One cannot draw any conclusion about the carrying capacity from these studies which ignore the productive capacity of land resources. Nevertheless, they are very useful for validating the findings of a carrying capacity analysis.
To resolve the above mentioned uncertainties in regard to livestock population pressure on land resources, the primary objective of this article was
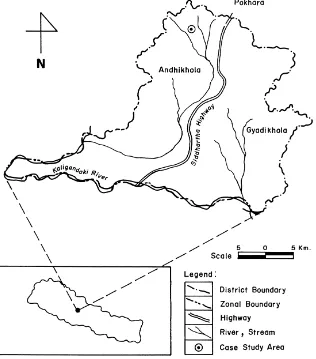
to analyze the carrying capacity of land resources under the current and improved management systems, specifically, with reference to Shyangja district of Nepal (Fig. 1). The ultimate objective is to find out the prospect of livestock development under alternative management regimes. It will also be useful to further application of carrying capacity as an analytical tool for natural resources management planning.
2. Research methods
2.1. Study area
Shyangja is a mountainous district of the Western Development Region of Nepal (Fig. 1), with a total area of 1036 km2 and population of 305,456. As a typical feature of the Hills, narrow river valleys are interspersed between mountain ranges and spurs. The average population density is 295 persons per km2, more than double compared with the average national density of 125. The average population density on agri-cultural land is 810 persons per km2, which is high-est among all districts in the Whigh-estern Development Region.
A warm temperate climate, with average tempera-ture of 15–20◦C, is found in areas with elevations
be-tween 1000 and 2000 m above the mean sea level. In areas below 1000 m, the climate is humid subtropical type, with annual average temperature of 20◦C. Areas
above 2000 m are characterized by cool temperate cli-mate. The district receives annual average rainfall of about 3000 mm. Species and type of vegetation are in-fluenced by climatic conditions and altitude. At rela-tively lower altitudes, deciduous forest is found, while the higher elevational zones are covered with alpine forests. This type of biophysical environment of the district offers good opportunity for commercial live-stock raising. But attention must be paid to ensure that this activity would not undermine the stocks of forests and grazing-land resources which have been playing a pivotal role in sustaining local economy and main-taining ecological balance.
Fig. 1. Location of Shyangia district in Nepal.
food crop residues, concentrates, fodder and grass. The range-lands account for about one-third of the area. Representing about one-fourth of the total area, forests are being utilized for livestock grazing as well as fodder collection.
Field crop cultivation and livestock raising are the two major components of the local subsistence econ-omy. Farmers raise cattle, buffaloes, sheep, pigs and goats for plowing and fertilizing lands, for dairy prod-ucts for both consumption and sale, and for meat (Table 1). Cattle are sources of milk, manure and draught power. Female buffaloes provide milk and ma-nure, and male buffaloes are sold to itinerant livestock traders. Selling of lactating buffaloes has been a good
source of income for a considerable number of farmers in locations relatively distant from the only all-weather road passing through Shyangja district (Paudel, 1997). Goats and pigs are primarily raised for sale. Cattle and buffaloes are the dominant type of livestock which are increasing at a very low rate (Table 1).
Table 1
Livestock population in Shyangja district
Livestock Livestock Livestock Growth Type head 1985/86a head 1995/96b rate
Cattle 114606 120344 0.50
Buffaloes 110917 111445 0.04
Goats 128991 115986 −1.00
Sheep 9356 11443 2.20
Pigs 17023 22746 3.40
aSource: Agricultural Statistics Division (ASD, 1990). bSource: Agricultural Statistics Division (ASD, 1996).
2.2. Research method
Carrying capacity is defined as the capacity of an ecosystem which could maintain its pro-ductivity, adaptability and capability of renewal (IUCN/UNEP/WWF, 1991). In this study, the number of livestock that land resources in the study area can support has been considered as the carrying capacity, which was determined using the following formula:
C=XTDNA
TDND
where C is the livestock carrying capacity of land resources; TDNA, the total digestive nutrient (TDN) available; TDND, the TDN demand per livestock stan-dard unit (LSU).
The TDN is a standard indicator of crude pro-tein, crude fiber, nitrogen-free extract, calcium and phosphorus content in forage, fodder and concentrate (Banerjee, 1988). Since livestock are fed with grass, fodder, crop residue and grain, with varying nutrient contents, conversion of all these materials into TDN is essential to determine the carrying capacity.
2.2.1. TDN demand estimation
The amount of TDN required to maintain livestock body weight and performance is considered as the standard fodder demand (Rajbhandari and Shah, 1981; Joshi, 1988). To writers knowledge, scientific studies on TDN requirement of livestock in the hills are still lacking. Lumle Agricultural Center (LAC, 1975) esti-mated an annual average requirement of 17 and 9.2 t of fresh fodder to maintain body weight of a lactating buffalo and cattle. Fox (1993) and Metz (1994) also an-alyzed fodder demand and supply in two hill villages of Nepal based on LAC’s estimates. Such estimates
are not useful for carrying capacity analysis as they ignore the variation in TDN contents of fodder/forage and discount the contribution of crop residues and con-centrates to fulfill dietary requirements of livestock.
TDN requirements of Nepalese livestock are nor-mally assumed to be equal to requirements of Indian livestock (Rajbhandari and Shah, 1981; Joshi, 1988). According to Sen et al. (1978), a standard Indian live-stock requires 1083 kg of TDN per annum. This rate is assumed to be applicable to the study area.
Information related to livestock was obtained from the Statistical Information on Nepalese Agriculture, 1995/96 (ASD, 1996). Then, buffaloes, cattle, goats and sheep were converted into LSU in accordance with the live weight method (Table 2). Finally, the total TDN demand was determined by multiplying per LSU TDN requirement by total LSU.
2.2.2. TDN supply estimation: Current situation
The amount of TDN available depends on the type and yield of fodder/forage in forests and grazing-lands accessible to livestock, and on amount of crop residues and fodder available from private lands. As required information on TDN supply could not be obtained from a specific source, it became necessary to relay on various sources including the primary information collected through household survey. In this vein, infor-mation on land use was obtained from the Land Use Report prepared by the LRMP (1984). Several discus-sion sesdiscus-sions and group meetings were held with forest and range-land management committees to determine the proportion of forests and scrub- and range-lands accessible to livestock. The consensus was that 60% of these resources were either under grazing or be-ing utilized for fodder collection. The total amount of TDN available from non-farm sources was estimated using the standard conversion method adopted by Ra-jbhandari and Shah (1981) and the Master Plan for the Forestry Sector of Nepal (HMGN//FINIDA/ADB, 1988).
Table 2
Livestock standard unit (LSU) and annual average TDN requirement by type and age group of livestocka
Livestock Adult-female Adult-male Young male/female
LSU TDN require- LSU TDN require- LSU TDN
require-ment (kg) ment (kg) ment (kg)
Buffalo 1.00 1083 0.91 986 0.71 770
Cattle local 0.69 748 0.95 1031 0.38 407
Cattle improved 0.95 1031 – – – –
Goat/sheep 0.22 239 0.25 274 0.07 73
aSource: Sen et al., 1978, LSU=Livestock standard unit, TDN=Total digestive nutrient.
household survey conducted in the Upper Andhikhola Watershed during January–February 1997. The supply of TDN from grain, grain byproducts and commer-cial feed was also determined using the information available from this survey.
Information on amount of fodder was obtained at the local scale of bhari or load for green fodder and
angalo or bundle for dry fodder and crop residues. The
weight of a bhari of fodder depends on the age and sex of the collector. Therefore, farm and forest fodder being carried by an adult, adolescent, and young male and female were weighed at four different locations. On average, a bhari of fodder weighed 35 kg, which also was assumed to be applicable to grass. The mean weight of an angalo of dry fodder was found to be 5.2 kg. These averages were used as conversion factors to estimate the total standard amount of green and dry fodder. In regard to grain and related by-products fed to livestock, information was obtained in metric units. Finally, farm fodder and feed were converted into TDN using the conversion factor adopted by Banerjee (1988).
3. Sources of fodder
Private lands, including fallow lands, forests and scrub- and grazing-lands are primary sources of fodder and forage. These sources can be broadly classified into two categories.
3.1. Farm sources
Agroforestry or growing woody perennials in asso-ciation with field crops has been a traditional practice in the Hills of Nepal. Assorted species of trees and
shrub formations grown on farms have been an inte-gral component of local economies as they are sources of fuelwood, fodder for livestock, which constitute a main component of the economy, fertilizer for land and fruits both for household consumption and sale, especially, where farmers have access to market cen-ters. Studies conducted in different parts of the Hills revealed that a considerable proportion of fuelwood and fodder requirements of farmers are fulfilled by trees grown on farms, though the actual percentage of supplies vary depending on landholding size of farmers (Fox, 1993; Metz, 1994).
In the micro-watershed where a field study was un-dertaken, on average, a farmer has grown about 39 trees, and four-fifths of farmers have less than 23 trees. Most trees are naturally grown on edges and bunds of plots cultivated with upland crops, locally called bari and on gullies and plots utilized for growing Typha
angustata used as thatching material and fodder.
As-suming that findings of the field study applicable to the entire district, farm trees and crop residues con-stitute the two most important sources of fodder, each accounting for about one-fourth of the total amount of TDN supply (see Table 3).
F. glaberiria is an evergreen tree, which provides
fodder in all seasons. Artocarpus lakoocha and Ficus
lacor are deciduous species, and are lopped during
the months of April through June. Litsea monopetala,
Celtis australis are minor species of fodder trees.
According to information obtained from a few se-lected farmers, a typical tree yields 85 kg of fresh fod-der per annum. F. lacor is the highest yielding species, with fodder production rate of 221 kg per annum per tree, and Garuga pinnata roxb is the lowest yield-ing species, with 21 kg per tree. Bambusa spp., A.
lakoocha and F. glaberiria are moderate yielding
vari-eties. The annual average fresh farm fodder production is estimated to be 4447 kg per household. The actual production ranges from 250 to 53,000 kg.
Farmers also provide small amounts of slurry lo-cally known as kudo, made from ground millet and corn mixed with water, to lactating buffaloes and cows. This constitutes around 9% of the TDN available. Grass-weed and hand-cut grasses are other on-farm sources of TDN. During the summer monsoon, ris-ers and bunds on the entire terrace are covered with several varieties of grasses. Grass cutting begins in early June and ends by December. The availability of grass diminishes gradually from October. T. angustata, grown on upland plots unsuitable for field crop culti-vation, is also used as fodder. Grass grown on a plot is normally harvested at least three times a year. In relatively fertile lands, located on stream banks, grass is harvested every 3 weeks during the rainy season. Hand-cut grass and grass-weed constitute 5% of total TDN supply (Table 3).
3.2. Non-farm sources
Farmers with small landholdings collect the major proportion of fodder from forests and range-lands. Ap-proximately, two-thirds of farmers in the case study area collect forest fodder and range-land grass, ac-counting for 21% of the total TDN supply (Table 3). Forest fodder and range-land grass are collected in all seasons, though the amount and type of fodder and grass vary by season. In the dry summer season, most farmers collect range-land and forest grasses as they run out of the stock of crop residues, and tree fodder is not yet ready for lopping. The availability of grass de-clines after November, and then farmers switch over to
forest tree fodder. This practice continues until early June when new on-farm and off-farm grasses become ready for harvest. Forest and range-land grasses are harvested mainly in the monsoon season. Farmers are relatively less dependent on off-farm sources in the winter season as livestock are fed on stocked crop residues.
Grazing in forest and scrub- and range-lands has been a supplementary source of fodder supply. Most ruminants in valley floors are stall-fed as grazing-lands are very limited. However, they graze on agricultural lands during the fallow period. With the exception of some prohibited areas, ruminants on hill slopes ex-tensively graze in communal scrub- and grazing-lands throughout the year. Grazing in communal lands con-tributes about 7% of the total TDN supply (Table 3).
Raising improved dairy cattle has been increasingly popular, especially, in villages relatively adjacent to the highway in Shyangja district. Farmers are feeding commercial feed to dairy cows purchased from the re-gional towns of Pokhara and Butwal to increase milk yield. This type of feed accounts for 6% of the to-tal TDN available in villages adjacent to the highway where household survey was conducted. It is assumed that this is applicable to 23,000 households of the 24 village development committee (VDC) areas located around the highway in Shyangja district. Owing to un-availability of information on livestock by VDC, LSU for the VDC area is determined based on the aver-age LSU size, 4.85 per household, of the field survey area. Thus, a total of 7215 t of TDN is estimated to be available from market sources.
4. Carrying capacity of land resources: Present situation
Table 4
Amount of TDN requirement for livestock in Shyangja district
Livestock type 1996/97 2001/02 2006/07
Total LSUa TDN demand (Mg) Total LSU TDN demand (Mg) Total LSU TDN demand (Mg)
Buffaloes 101963 110426 104358 113010 107177 116073
Cattle 83702 90649 85389 92476 87111 94341
Goats 15272 16540 14523 15728 13811 14957
Sheep 2573 2787 2869 3107 3199 3465
Total 203510 220402 207139 224321 211298 228836
aSource: Agricultural Statistics Division, (ASD, 1996).
Under the existing situation, a hectare of land could support about two LSU. However, the actual stocking rate was nearly three LSU (Table 5), implying that livestock were underfed and land resources were under high livestock population pressure. On average, a LSU was provided with 786 kg of TDN per annum against the effective demand for 1083 kg.
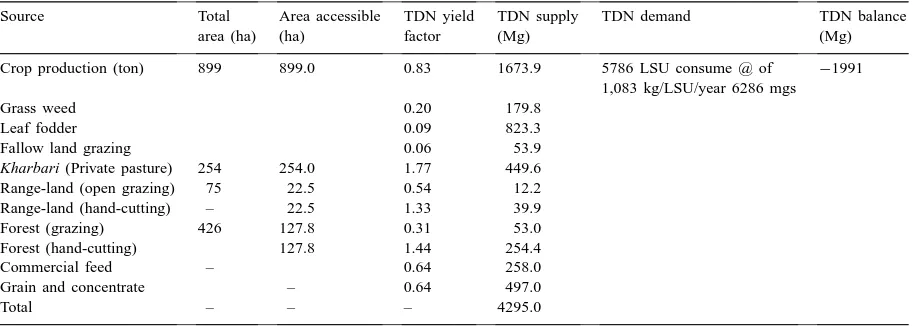
Findings of the above macro-level analysis are strongly corroborated by findings of the field sur-vey conducted in the Upper Andhikhola Watershed (Table 6), where the total amount of TDN available from all sources was found to be 4295 t. This amount was adequate for 3966 LSU, but the actual number of LSU was 5786, meaning nearly one-third of the LSU were above the carrying capacity of land resources. Consistent with the findings of the macro-level anal-ysis, a LSU could get 742 kg of TDN per annum.
5. Carrying capacity: The future scenario
Currently, livestock populations in the study area exceed the carrying capacity of land resources, which is detrimental to the environment and economy. Rem-edying this problem entails bringing livestock popula-tions under the carrying capacity of resources, either
Table 5
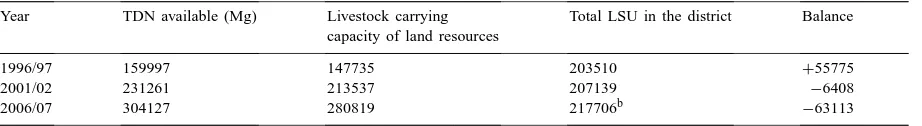
Livestock carrying capacity of land resources in Shyangja districta
Year TDN available (Mg) Livestock carrying Total LSU in the district Balance capacity of land resources
1996/97 159997 147735 203510 +55775
2001/02 231261 213537 207139 −6408
2006/07 304127 280819 217706b −63113
aSource: Field survey, 1997.
bThis includes 9408 LSU added on the top of 211,298 LSU to take advantage of surplus TDN supply.
through reducing TDN demand by controlling live-stock population or through enhancing the supply of TDN by increasing fodder, forage and feed produc-tion, or through a combination of both. The first mea-sure would curtail livestock’s contribution to the local economy, which is not desirable, as long as alterna-tive options are available. Moreover, a typical farm household in the study area raises about five cattle and buffaloes to meet requirements of draught power, manure and dairy products (Paudel, 1997). Under the prevailing situation, farmers will face serious problem to maintain the household economy with less than five large livestock. Therefore, a pragmatic socially accept-able approach would seek the prospect of increasing fodder and forage supply.
5.1. TDN demand
Fig. 2. Livestock carrying capacity of land resources in Shyangja district.
Between 1985/86 and 1995/96, the annual average growth rate of different types of livestock ranged from 3.4 to 1.0% (Table 1). Assuming that livestock will continue growing at the same rate, the total number of LSU in the study area will reach 207,139 in 2001/02 and 211,298 in 2006/07 (Table 4). Corresponding to this growth, the demand for TDN is expected to be 224,321 and 228,836 t, respectively.
5.2. TDN supply
Table 6
TDN demand and supply in the Upper Andhikhola Watersheda
Source Total Area accessible TDN yield TDN supply TDN demand TDN balance
area (ha) (ha) factor (Mg) (Mg)
Crop production (ton) 899 899.0 0.83 1673.9 5786 LSU consume @ of −1991 1,083 kg/LSU/year 6286 mgs
Grass weed 0.20 179.8
Leaf fodder 0.09 823.3
Fallow land grazing 0.06 53.9
Kharbari (Private pasture) 254 254.0 1.77 449.6 Range-land (open grazing) 75 22.5 0.54 12.2 Range-land (hand-cutting) – 22.5 1.33 39.9
Forest (grazing) 426 127.8 0.31 53.0
Forest (hand-cutting) 127.8 1.44 254.4
Commercial feed – 0.64 258.0
Grain and concentrate – 0.64 497.0
Total – – – 4295.0
aNB: Information on land use was provided by the Andhikhola Watershed Management Project implemented by CARE/Nepal. TDN
supply has been estimated based on data collected through the household survey.
extension as well as research activities. Assuming that the production of crop residues will also follow the same trend, the yield of TDN available from this source will increase from 1.12 t ha−1 in 1996/97 to
2.42 t ha−1 in 2001/02 and 3.12 t ha−1 in 2006/07
(Table 3). Thus, crop residues will contribute 91,175 t of TDN by 2001/02 and 120,286 t by 2006/07.
Corresponding to the growth in agricultural produc-tion, the supply of grain and by-products to livestock is expected to increase at an annual average rate of 5%, eventually raising the level of TDN supply from 13,808 t in 1996/97 to 17,260 t in 2001/02 and 20,712 t in 2006/07 (Table 3).
While no change is expected in the amount of TDN available from fallow land grazing, a substantial increment is expected from enhanced farm fodder pro-duction. Farmers are keenly interested in plantation of additional fodder trees to cope with the problem of dwindling non-farm fodder supply. Provided an addi-tional tree is added every year in the existing stock of tress, TDN yield from farm fodder will rise from 1.29 t ha−1in 2001/02 to 1.97 t ha−1in 2006/07,
indi-cating that the total amount of TDN available would be 48,389 t during the first reference year and 74,089 t during the second reference year (Table 3). It should be noted that this is a very conservative estimate. Given suitable climatic condition and a considerable proportion of private marginal lands being left, be-cause of their unsuitability for field crop cultivation,
there is ample scope to increase farm fodder and for-age supply substantially by promoting agroforestry.
Regarding TDN available from grazing-lands, the ever-increasing livestock pressure and regular grazing have led to defoliation of forage plants and destruc-tion of root systems. Half of all grazing-lands are under open grazing systems, and livestock frequently trample young plants, preventing their healthy growth. That is why range-lands are covered with sparse grasses and TDN yield under such conditions is esti-mated to be 0.54 t ha−1(Rajbhandari and Shah, 1981).
In the future, the yield rate is expected to increase as the Department of Forest and Soil Conservation and CARE/Nepal have jointly implemented watershed management projects in 16 VDCs of the district since 1993. This project will gradually expand into other areas and promote appropriate forest and range-land management practices. Rotational grazing alone can contribute to increase TDN yield from 0.54 t ha−1
to 0.89 t ha−1 (HMGN//FINIDA/ADB, 1988). As a
result, nearly 9000 t of TDN will be available from grazing-lands under open grazing systems (Table 3).
About half of range-lands are under enclosed hand-cutting systems and yield TDN at the rate of 1.33 t ha−1. This rate can go up to 1.77 t ha−1
17,500 t of TDN. Further improvement of the man-agement system, meaning complete reseeding, would enhance TDN yield up to 2.22 t ha−1. Assuming this
applicable to 2006/07, about 22,000 t of TDN is ex-pected to be available from enclosed range-lands (Table 3).
Shrub-lands are under open grazing systems, and no initiative has been taken so far to enhance their productivity. Currently, the annual average TDN yield of these lands is estimated to be 0.77 t ha−1. With the
partial reseeding and rotational grazing, TDN yield would be 0.89 t ha−1 by the year 2001/02. Under an
effective reseeding and rotational grazing system, TDN yield would be up to 1.77 t ha−1during 2006/07
(HMGN//FINIDA/ADB, 1988). Overall, there is a possibility to obtain about 3300 t of TDN during the first reference year and 6700 t during the second reference year (Table 3).
Grazing control and reseeding of leguminous grasses on wastelands can help to enhance TDN yield from 0.22 to 1.77 t ha−1 (HMGN//FINIDA/ADB,
1988). With the improved system, TDN obtained from this source is expected to be about 1800 t during both reference years.
Grazing livestock in forests has been a tradition in Shyangja district. An estimated 30% of forestland is under an open grazing system. The fodder yield under such a system is estimated to be 0.31 t ha−1
(HMGN//FINIDA/ADB, 1988). Owing to open access to most forests, complete grazing control seems al-most impossible until the near future. Thus, no change is envisaged in the amount of TDN to be obtained from forest grazing until 2001/02. With the promotion of the rotational grazing system, about 6300 t of TDN would be available from this source by 2006/07 (Ta-ble 3). There will not be any change in the amount of TDN obtained through fodder collection.
The government of Nepal has been promoting dairy cattle raising in areas with transportation facilities by providing milk collection services and offering credit for purchasing improved dairy cows. The num-ber of improved cattle is, thus, expected to increase steadily, particularly in 24 VDC areas, comprising about 23,000 households, located relatively adjacent to the highway. In view of this, it is envisaged that the supply of commercial feed will increase by 50% during 1996/97–2001/02 and by further 25% during 2001/02–2006/07. Corresponding to this increment,
this source will contribute 10,877 t of TDN in the first reference year and 13,596 t in the second reference year (Table 3).
5.3. Livestock carrying capacity
Under the improved situation in 2001/02, 231,261 t of TDN will be available from all sources against the demand for 224,321 t (Tables 3 and 4). The surplus 6940 t of TDN will offer an opportunity to add an addi-tional 6408 LSU on top of existing stock (Fig. 2). With continued improvements in resource use and manage-ment, TDN supply is estimated to be 304,127 t by 2006/07 which is adequate for 280,819 LSU (Table 5). Following the normal growth rate, the total number of LSU is expected to be 211,298 by 2006/07 (Table 4). Assuming that additional 6408 LSU are added on top of this to take advantage of the surplus supply of TDN achieved through improved resource use and manage-ment systems, there will be 217,706 LSU. This will provide an opportunity to adjust an additional 63,113 LSU (Fig. 2).
6. Conclusions
Despite being a traditional practice, agroforestry has not been able to flourish in the Hills due partly to open access to forests and grazing-lands. As long as this problems persists, there is not much scope to promote this practice effectively. In some of the vil-lages in the upper Pokhara valley where community forests were very effectively managed, farmers were found practicing agroforestry, considerably better than those villages where forests were virtually open for all (Thapa and Weber, 1990). A strategic agro-forestry promotion program should, therefore, build and strengthen local institutions, governing the use and management of forest and grazing-land resources. Besides rotational grazing of livestock, reseeding of grasses, and rotational fodder collection offer oppor-tunities to increase the supply of fodder and forage and conserve natural resources sustainably.
Acknowledgements
This research was facilitated by a faculty research grant provided by the Asian Institute of Technology (AIT), Bangkok. Being a person with very rich knowl-edge about Nepal’s hill eco-systems, Dr. Ganesh P. Shivakoti, Visiting Faculty, School of Environment, Resources and Development, AIT provided very con-structive comments on the draft paper. We take this opportunity to extend our sincere thanks to Dr. Shiv-akoti. We appreciate two anonymous referees whose very useful comments and suggestions contributed to consolidate this article.
References
Amatya, P., Shivakoti, G., Amatya, P., 1996. Indigenous multipurpose tree species (MPTS) production practices followed by farmers of Chitwan Valley, Nepal. IAAS research report 1994–1995. Institute of Agriculture and Animal Science, Rampur, pp. 137–154.
Arya, S.L., Agnihotri, Y., Samra, J.S., 1994. Watershed management: changes in animal population structure, income, and cattle migration, Shiwaliks, India. Ambio 23, 446–450. ASD, 1996. Statistical Information on Nepalese Agriculture
1994/95. Agricultural Statistic Division, Ministry of Agriculture, Kathmandu.
ASD, 1990. Agricultural Statistics of Nepal 1990. Agricultural Statistic Division, Ministry of Agriculture, Kathmandu. Banerjee, G.C., 1988. Feeds and Principles of Animal Nutrition.
Oxford and IBH Publishing Co Ltd., Calcutta.
Bajracharya, D., 1983. Fuel, food or forest? Dilemmas in a Nepali village. World Dev. 12, 1057–1074.
CBS, 1998. A Compendium on Environment Statistics 1998 Nepal. Central Bureau of Statistics, Kathmandu, Nepal.
Carson, B., 1992. The land, the farmer, and the future, a soil fertility management strategy for Nepal. ICIMOD Occasional Paper No 21, Kathmandu, Nepal.
EPC, 1993. Nepal Environmental Policy and Action Plan: Integrating Environment and Development. National Planning Commission, Environmental Protection Council, Kathmandu. Fox, J., 1993. Forest resources in a Nepali village in 1980–1990:
The positive influence of population growth. Mountain Res. Dev. 13, 89–98.
FAO, 1990. Selected indicators of food and agriculture development in Asia Pacific region, 1979–1989, Bangkok. HMGN//FINIDA/ADB, 1988. Master plan for the forestry sector
Nepal: main report. Department of Forestry, Kathmandu. ICIMOD, 1985. Managing mountain watersheds. Report of the
international workshop on watershed management in the Hindu Kush–Himalayan region, Chengdu, 14–19 October 1985. International Center for Integrated Mountain Development, Kathmandu.
IUCN/UNEP/WWF, 1991. Caring for the Earth: A Strategy for Sustainable Living, Gland, Switzerland.
Joshi, N.P., 1988. Feed availability requirement for animals and current pattern of utilization in Nepal. In: Devendra, C. (Ed.), Non Conventional Feed Residues and Fibrous Agricultural Residues Strategy for Expanded Utilization. International Development Research Center, Indian Council of Agricultural Research, India, New Delhi, pp. 147–157.
LAC, 1975. Feed requirement and manure production by buffaloes and cows at Lumle Agriculture Center, Lumle, Nepal. LRMP, 1984. Land use: main report. Land Resources Mapping
Project. Ministry of Forest and Soil Conservation, Kathmandu. Metz, J.F., 1994. Forest product at an upper elevation village in
Nepal. J. Environ. Manage. 18, 371–390.
MPE, 1998. State of the Environment. Nepal Ministry of Population and Environment, Kathmandu.
MA, 1995. Nepal agriculture perspective plan: final report. Agricultural Projects Services Center and John Mellor Associates, Kathmandu.
Paudel, G.S., 1997. Integration of livestock development with forest and range-land management for sustainable development in Shyangja district, Nepal. M.Sc. Thesis, Asian Institute of Technology, Bangkok.
Pearce, D., Barbier, E., Markandya, A., 1990. Sustainable Development: Economics and Environment in the Third World. Earthscan, London.
Pravongviengkham, P.P., 1998. The role of animal husbandry and aquaculture in improvements of swidden based livelihood systems in the Lao PDR. Ph.D. dissertation. Asian Institute of Technology, Bangkok.
Sen, K.C., Ray, S.N., Ranjhan, S.K., 1978. Nutritive values of Indian cattle feed and the feeding animals. ICAR, New Delhi, pp. 12–19. Cited by Joshi, N.P. 1988. Feed availability requirement for animals and current pattern of utilization in Nepal. In: Devendra, C. (Ed.), Non Conventional Feed Residues and Fibrous Agricultural Residues Strategy for Expanded Utilization. International Development Research Center, Indian Council of Agricultural Research, New Delhi, pp. 147–157. Sharma, P., 1989. Urbanization in Nepal. East-West Population
Institute, Honolulu.
Simaraks, S., 1998. Roles and limitation of animals in the farming
systems in Southeast Asia: field observations and experiences. In: Chapman, E.C., Bouahom, B., Hansen, P.K. (Eds.), Upland Farming Systems in the Lao PDR—Problems and Opportunities for Livestock. Australian Center for International Agricultural Research, Canberra, pp. 19–26.
Thapa, G.B., Weber, K.E., 1994. Prospects of private forestry around urban centers: a study in upland Nepal. Environ. Conserv. 21, 297–307.