LAND USE / LAND COVER CHANGES IN SEMI-ARID MOUNTAIN LANDSCAPE IN
SOUTHERN INDIA: A GEOINFORMATICS BASED MARKOV CHAIN APPROACH
S. Abdul Rahaman a, *, S. Aruchamy b, K. Balasubramani c, R. Jegankumar d a
Department of Geography, Bharathidasan University, Tiruchirappalli, India. [email protected] b,c,d Department of Geography, Bharathidasan University, Tiruchirappalli, India.
[email protected], [email protected], [email protected]
Commission VI, WG VI/4
KEY WORDS: Land cover, Markov, Kallar, NDVI, Drought, Geoinformatics
ABSTRACT:
Nowadays land use/ land cover in mountain landscape is in critical condition; it leads to high risky and uncertain environments. These areas are facing multiple stresses including degradation of land resources; vagaries of climate and depletion of water resources continuously affect land use practices and livelihoods. To understand the Land use/Land cover (Lu/Lc) changes in a semi-arid mountain landscape, Kallar watershed of Bhavani basin, in southern India has been chosen. Most of the hilly part in the study area covers with forest, plantation, orchards and vegetables and which are highly affected by severe soil erosion, landslide, frequent rainfall failures and associated drought. The foothill regions are mainly utilized for agriculture practices; due to water scarcity and meagre income, the productive agriculture lands are converted into settlement plots and wasteland. Hence, land use/land cover change deduction; a stochastic processed based method is indispensable for future prediction. For identification of land use/land cover, and vegetation changes, Landsat TM, ETM (1995, 2005) and IRS P6- LISS IV (2015) images were used. Through CA-Markov chain analysis, Lu/Lc changes in past three decades (1995, 2005, and 2015) were identified and projected for (2020 and 2025); Normalized Difference Vegetation Index (NDVI) were used to find the vegetation changes. The result shows that, maximum changes occur in the plantation and slight changes found in forest cover in the hilly terrain. In foothill areas, agriculture lands were decreased while wastelands and settlement plots were increased. The outcome of the results helps to farmer and policy makers to draw optimal lands use planning and better management strategies for sustainable development of natural resources.
* Corresponding author
1. INTRODUCTION
1.1 General Instructions
Globally, land use change impacts biodiversity, water and radiation budgets, emission of greenhouse gasses, carbon cycling, and livelihoods. The study of Land Use and Cover Change (LUCC) and its dynamics is crucial for environmental management, especially with regard to sustainable agriculture and forestry. Today, there is increased recognition that land use and land cover change (LULCC) is a major driver of global change, through its interaction with climate, ecosystem processes, biogeochemical cycles, biodiversity and even more importantly the human activities (NRC 1999). Changes in land
cover (biophysical attributes of the earth’s surface) and land use
(human modified earth’s surface) has been accelerating as a
result of socio-economic and biophysical drivers (Turner et al. 1995; Lambin et al. 1999).
The analysis and modeling of LULC dynamics in a hydrological unit of a watershed provide understanding in totality. It is a two-way process when LULCC in watershed changes the performance characteristics of the watershed which includes the water infiltration rate, soil erosion rate, runoff, etc., and vice versa (Zhang et al. 2007). Improper practices of LULC including deforestation, uncontrolled and excessive grazing, expansion of agriculture, and infrastructure development are deteriorating watershed conditions (Bishaw 2001), at various temporal and spatial scales (Bisht and Tiwari 1996).
There are a lot of methods for land cover change detection such as image rationing, image difference, change vector analysis, image regression, composite analysis and post classification (Coppin et al., 2004). There are several methods for land cover and land use change modelling that includes mathematical equation based, system dynamic, statistical, expert system, evolutionary, cellular, and hybrid models. Cellular models (CM) include cellular automata (CA) and Markov models. In CA, each cell exists in one of a finite set of states, and future states depend on transition rules based on a local spatiotemporal neighbourhood (Parker, 2002).
Markov chain analysis is a convenient tool for modelling land cover and land use changes when changes and processes in the landscape are difficult to describe. Markov chains model is able to predict land use and land cover changes from one period to another and uses this as the basis to project future changes (Estmen, 1995). CA-Markov has the ability to simulate land use changes among multiple categories and combines the CA and Markov chain procedures (Estmen, 2003). Cellular Automata (CA) incorporates the spatial component (Soe and Le 2006) and thereby adds direction to modeling.
2. MATERIALS AND METHODS
2.1 Study Area
The study area is located between 11˚17′0′′ N to 11˚31′0′′ N latitudes and 76˚ 39′ 0′′ E to 77˚ 8′ 45′′ E longitudes with an area
of about 1,283 sq.km. Covering three districts, namely, The Nilgiris, Coimbatore, and Erode. It altogether covers 7 taluks such as Coonoor, Kothagiri, Udhagamandalam, Mettupalayam, Coimbatore north, Annur, and Sathyamangalam with 79 Revenue villages, (Figure 1). The maximum and minimum elevation of the study area ranges from 177m to 2,615m above MSL, (Figure 2). About 50% of areas are mountains, covered with diverse plant communities that form various types of forest and hill farming like tea, coffee, vegetables, and orchards. The climate of this area is temperate and salubrious for more than half of the year. The average day temperature of the sub watershed fluctuates between 20°C and 30°C. The average rainfall is about more than 1,400 mm. The maximum rainfall is during the month of October and November. The winter is relatively cool. The Kallar streams flow from Southwest to Northeast and it connects the Bhavani River at Mettupalayam, which finally empties into Bhavanisagar Dam which lies in the north-eastern part of the watershed. Bhavanisagar Dam primarily serves as a source of irrigation and hydroelectric power generation. The area covered by clay soil, loamy soil and rock outcrop on steep to narrow sloping grounds. Geologically, the area is made up of granite and fissile hornblende-biotite gneiss. Geomorphologically, the watershed is characterized by structural hills, denudational hills, narrow gorges, and intermountain valleys.
Figure 1. Study Area
Figure 2. Physiography
2.2 Data Sets
Remote sensing data sets are playing a major role in the land use/land cover change deduction. In this study, following imageries were used to identify and predict the land use changes. Landsat TM and ETM (1995, 2005) images were collected from Global Land Cover Facility of the University of Maryland (USA). IRS P6- LISS IV (2015) image were purchased from the National Remote Sensing Centre (NRSC) under the aegis of Indian Space Research Organisation (ISRO).
Characteristics / Sensor
Date Spatial
Resolution Landsat TM 23 Feb 1995 30m Landsat ETM+ 10 Feb 2005 30m IRS P6 -LISS IV 16 Feb 2015 5.8m
Table 1. Satellite images used in this study
2.3 Methodology
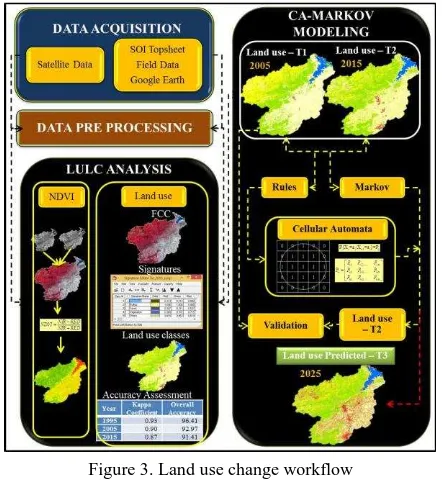
The method involved in understanding the land use change and dynamics is as presented in Figure 3.
2.3.1 Pre-processing: The remote data obtained was geo-referenced, rectified and cropped according to the study area. The 1995 and 2005 images were previously geometrically and radiometrically corrected by USGS Earth Resource Observation Systems Data Centre (EROS) to a quality level of 1G. The 2015 IRS LISS IV image were geometrically and radiometrically corrected by NRSC to level 2 qualities.
Figure 3. Land use change workflow
Land use analysis was carried out using supervised classification method based on Gaussian maximum likelihood algorithm. This has been proved superior classifier as it uses various classification decisions using probability and cost functions (Ramachandra et al 2012). The mean and covariance matrix are computed using an estimate of maximum likelihood estimator. Wang, 1986; Stewart, 1994). One basic assumption is to regard land use and land cover change as a stochastic process, and different categories are the states of a chain. A chain is defined as a stochastic process having the property that the value of the process at time t, Xt, depends only on its value at time t-1, Xt-1,
Moreover, it is convenient to regard the change process as one which is discrete in time (t=0, 1, 2….).
The P {Xt=aj|X0=a1,….Xt-1=ai} known as the one-step transitional probability gives the probability that the process makes the transition from state ai to state aj in one time period. is said to be homogeneous. The treatment of Markov chains in this study will be limited to first order homogeneous Markov chains. In this event:
t j t -1 i ij
P{X =a |X =a }=P (2)
where Pij can be estimated from observed data by tabulating the number of times the observed data went from state i to j, nij, and by summing the number of times that state ai occurred, ni. Then modelling land cover change. Markov analysis considers only the temporal changes occurred in the landscape. In order to obtain the spatial dynamics of the landscape, CA is integrated with Markov Chain.
Cellular Automata is a cell-based approach to model processes in a two-dimensional space. In CA, the state of a cell can
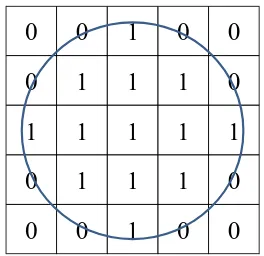
change only based on the transition rules and it gives the result of spatial modelling based on the transition rules. These rules control the transformation of a cell state to another cell state over the specific period of time depending on the neighborhood of the cells. A simple transition rule in a cellular automaton cell, which acts as inputs for the transition rules. The function f defines the transition rules from time period t to t + 1. A cellular automaton is a cellular entity that independently varies its condition based on its previous state (according to a Markov transition rule) and adjacent neighbours (Eastman J.R, 2003 ). The following 5 × 5 contiguity filter was utilized in this work:
0
0
1
0
0
0
1
1
1
0
1
1
1
1
1
0
1
1
1
0
0
0
1
0
0
Figure 4: Circular CA Filter of 5 x 5 neighbourhoods
Thus CA-Markov model was used to visualize the land use changes for the year 2020, 2025.
4. RESULT AND DISCUSSION
CA- Markov based land use land cover change and dynamic analysis was carried out in the Kallar watershed.
4.1 Land cover analysis
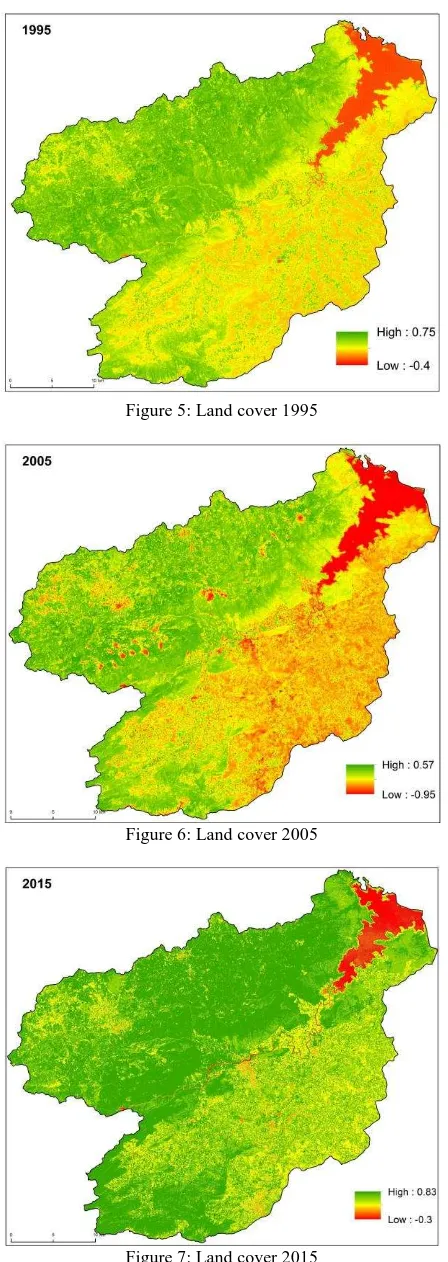
In this study vegetation cover (land cover) were calculated through Normalized Differential Vegetation Index (NDVI) from 1995 to 2015. In the year 1995, NDVI ranges from -0.4 to 0.75, 67 % of the areas fall under the vegetation and 33% of the area in non-vegetation (Figure 5).
Followed by the year 2005, NDVI value from -0.95 to 0.57; it occupies 55.6% of vegetation covered areas and 44.4% non-vegetation areas (Figure 6), particularly 2004-05 is the driest (Drought) year in the southeastern part of the study area, based on the meteorological record; Periyanayakanpalaym receives a 00 mm of rainfall from June 2004 to 2005.
Figure 5: Land cover 1995
Figure 6: Land cover 2005
Figure 7: Land cover 2015
In the year 2015, NDVI range from -0.3 to 0.83, the vegetation area covers in 62.9% and non-vegetation covered in 37.1% (Figure 7). NDVI values (Table 2) Indicates that there is a sudden change in the year 2005 and a gradual increase in the
land cover non-vegetation area in the year 2015, compared to 1995.
4.2 Land use analysis
Land use analysis for the period 1995 to 2015 was carried out using supervised classification method based on Gaussian maximum likelihood algorithm. The satellite images were classified into five major types of land use classes; it includes Build up (urban, rural area, industrial area, and road), Forest (evergreen, deciduous), Vegetation (plantation, cropland), Water body (river, lake, and reservoir) and Others (fallow land, barren rock, quarry, and mining).
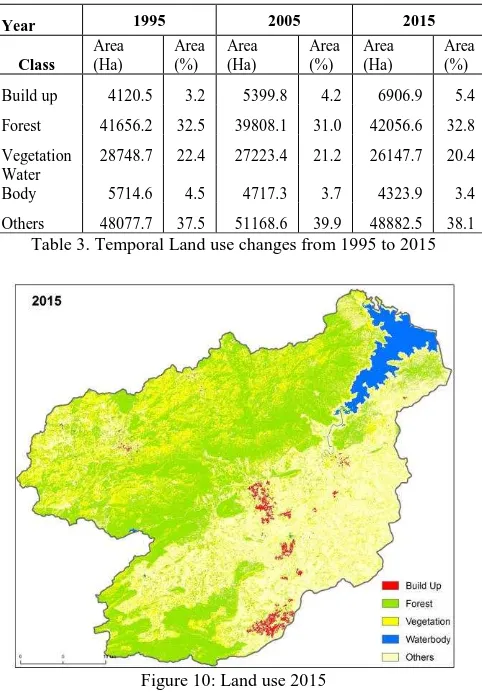
The temporal land use dynamics are given in Table 3. The build-up area has been increased from 3.2% in 1995 to 5.4% in 2015. Slight changes are seen in the forest cover area, 32.5% in 1995, 31.0 % in 2005 and 32.8% in 2015. The vegetation and water bodies shows a declined trend; vegetation area have decreased from 22.4 % in 1995 to 20.4 in 2015 and water bodies also have gradually decreased from 4.5% in 1995 and 3.4% in 2015. The decrease in vegetation and water bodies can be related to the increase in the wasteland (others). The others area classes have increased from 37.5% in 1995 to 38.15% in 2015. (Figure 8, 9, 10)
Figure 8: Land use 1995
Year 1995 2005 2015 Table 3. Temporal Land use changes from 1995 to 2015
Figure 10: Land use 2015
The accuracy assessment of the classified information was performed using Kappa statistics and error matrix. The overall accuracy obtained for the classified images were 96.41%, 92.97%, and 91.41% in the year 1995, 2005, and 2015 respectively. Table 4 provides the overall accuracy and Kappa statistics of the classified data.
Year Kappa Coefficient Overall Accuracy
1995 0.93 96.41
2005 0.90 92.97
2015 0.87 91.41
Table 4. Kappa values and overall accuracy
Further, 2015 image was classified through hybrid method to know the detailed land use type in the study area (Table 4, Figure 11).
Figure 11: Land use (Hybrid) 2015
Land use Class Area (Ha) Area (%)
Barren Rock 1414.3 1.1
Build up Rural 2626.4 2.0
Build up Urban 2726.0 2.1
Crop Land 15580.4 12.1
Current Fallow 15630.5 12.2
Deciduous Forest 6170.3 4.8
Dense Scrub 3984.2 3.1
Evergreen / Sem. Forest 33117.9 25.8
Forest Scrub 7001.0 5.5
Industries 383.4 0.3
Mining 199.3 0.2
Mixed Plantations 807.5 0.6
Open scrub 7254.5 5.7
Permanent Fallow 3136.9 2.4
Plantation 5721.6 4.5
River / Stream 422.5 0.3
Stony Waste 50.3 0.0
Tea Plantation 15655.5 12.2
Water body 6434.9 5.0
128317.3 100.0 Table 5. Land use 2015
4.3 Land use modeling through CA-Markov
The CA-Markov modelling was performed using IDRISI Selva software. Markov chains were used to develop transition probability. The transition probability matrices indicate the probable change in area between the land use classes provides the transformation area maps for each land use classes. This transition probability for the future state is based on the previous state and current state of the cell. Equal intervals are used in order to calibrate and simulate the model. The calibrated model is further used for predicting future land use state.
4.3.1 Modelling and Simulation: Land use data for the year 2015 and 2025 were used to develop transition probability area/matrix, the transition areas were calibrated based on the allowable error and iterations. Allowable errors such as 0.15, 0.1, 0.05, and 0.01 were used to calibrate the model. Error of 1% (0.01) during calibration simulated land use closer to the actual. Rules and neighbourhood were defined to calibrate cellular automation. Various land use change rules are described in Table 6 and the circular neighbourhood of 2 pixels radii that was considered for the analysis is depicted in Figure 3.
LAND USE CLASS CHANGES Table 6. Land use change rules
Land use Build up Forest Vegetation Water Others Table 7. Markov transition probability matrix (2015-2025)
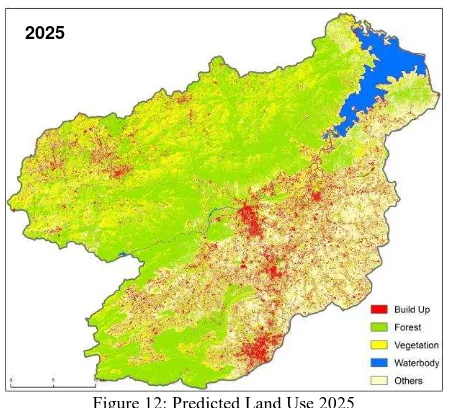
the forest cover, vegetation areas are decreased 22.4% (1995) to 21.9% (2025). Further, no changes in the water body and other class areas are increased by 2.3%.The result of simulated land use for the year 2025 has been given in the Figure 12.
Figure 12: Predicted Land Use 2025
4.4 Validation and Comparisons
The results were validated through hybrid classification (2015), Google earth and field checks.
Figure 13: Settlement Plots in (a) Google Earth, (b) IRS P6 LISS – IV (2015)
The classified results, mostly matches with the Google earth images and field. Build up (urban area) are rapidly increasing and most of the agricultural (cultivable) lands were converted to settlement plots. In entire watershed, 92 settlement plots were identified (Figure 13) and these plot areas falls under the build-up area in the predicted 2025 map.
5. CONCLUSION
This paper describes an integrated approach of remote sensing and stochastic modelling techniques in explaining the land use and land cover changes in Kallar watershed of Tamil Nadu. The CA-Markov based approach was used to predict the land
use/land cover changes 1995 to 2025. Build-up and other areas are increased, forest and vegetation cover are decreased due to continuous deforestation and population explosion were the main driving forces. This study helps us to find the land use changes in the particular and which land use will be affected by changes in future by prediction. Also, biodiversity loss and ecological problems can be identified. The outcome of the results helps the farmer and policy makers to draw optimal lands use planning and better management strategies for sustainable development of natural resources.
ACKNOWLEDGEMENTS
I would like to acknowledge the Department of Geography, Bharathidasan University, and UGC - Basic Scientific Research Fellowship scheme for aiding me in carrying out my research work. I express my sincere gratitude to faculties Dr. K. Kumaraswamy, Mr. P. Masilamani, and Ms. Revathi, Mr. A. Balasundareshwaran, Department of Geography, Bharathidasan University for their valuable suggestions, ideas and support throughout this work.
REFERENCES
Bishaw, B., 2001. Deforestation and land degradation in the Ethiopian highlands: A strategy for physical recovery; Northeast African Studies, 8, pp. 7–25.
Bisht, B.S., and Tiwari P.C., 1996. Land-use planning for sustainable resource development in Kumaun Lesser Himlalaya
– a study of the Gomli watershed; Int. Sustain. Dev. World Ecol. 3, pp. 23–34.
Coppin, P., Jonckheere I., Nackaerts K., and Muys B, 2004. Digital change detection methods in ecosystem monitoring: a review, International Journal Remote Sensing, 25, pp. 1565-1596.
Estmen, J.R., 1995. IDRISI for windows user guide version 1/0. Clark University.
Estmen, J.R., 2003. IDRISI Kilimanjaro, Guide to GIS and Image Processing, Clark Lab, Clark University, Worcester.
Lambin, E F, Baulies X, Bockstael N, Fischer G, Krug T, Leemans R, Moran E F, Rindfuss R R, Sato Y, Skole D, Turner B L and Vogel C., 1999. The change of land use in upriver regions of Yellow River, Land-use and land-cover change (LUCC): Implementation strategy, IGBP Report 48 IHDP Report No. 10, Stockholm, Bonn. development by the integration of constrained cellular automata and GIS. International Journal of Geographical Information Science, 14, pp. 131- 152.
National Research Council (NRC) Board on Sustainable Development, Policy Division, Committee on Global Change
Research., 1999. Global Environmental Change: Research Pathways for the Next Decade (Washington DC: National Academy Press).
Parker, D.C., Manson S.M., Janssen M.A., Hoffmann M.J., and Deadman, P., 2002. Multi-agent systems for the simulation of land use and land cover change: a review, 43.
Ramachandra T.V., Bharath H. Aithal., 2012. Spatio-Temporal Pattern of Landscape Dynamics in Shimoga, Tier II City, Karnataka State, India. International Journal of Emerging Technology and Advanced Engineering, 2(9), pp. 563-576.
Turner, II B L., Skole, D., Sanderson, S., Fischer, G., Fresco, L., and Leemans, R., 1995. Land use land cover change science/research plan (IGBP Report No. 35 and HDP Report No. 7).