www.elsevier.com / locate / econbase
Applications, grants and the value of patent
a ,
*
bDominique Guellec
, Bruno van Pottelsberghe de la Potterie
a
´
OECD, DSTI-EASD, 2 rue Andre Pascal, 75775 Paris Cedex 16, France
b
´
Universite Libre de Bruxelles, Solvay Business School, Solvay Chair of Innovation, Centre Emile Bernheim CP 145-01, 21 av. F.D. Roosevelt, B-1050, Bruxelles, Belgium
Received 13 September 1999; accepted 7 March 2000
Abstract
Patenting strategy, technological diversity, domestic and international R&D collaborations and / or co-applications, and the mix of designated states for protection ‘also’ affect the value of patents. 2000 Elsevier Science S.A. All rights reserved.
Keywords: Patents; Invention value; Intellectual property rights
JEL classification: O31; O34; O50
1. Introduction
The economic literature on the measurement of the value of patents takes as an assumption that the value of any patent is reflected in the number of times the patent is cited, or the length of its renewal, or the number of countries where it is taken. Most studies use this available information on patents and assume some functional form for its relationship with the value in order to estimate it. The present paper tackles this issue the other way round, by trying to assess the extent to which some attributes of a patent are related or not to its value. The assumption we make is that patents granted are of higher value than patents refused or withdrawn. We analyse in an econometric framework the determinants of the probability that a patent application at the European Patent Office (EPO) is granted. Those variables that are significant can be seen as closely related to the value of patents. The explanatory variables are: the country of the inventor, the technological field, local and international co-operation in the invention process, ownership of the patent by a foreign multinational firm, the administrative
*Corresponding author. Tel.: 133-145-249-384; fax: 133-145-241-848.
E-mail addresses: [email protected] (D. Guellec), [email protected] (B. van Pottelsberghe de la Potterie).
path followed by the patent (strategy of the patentee), and the number of designated states (countries where the invention is protected). This last variable allows to test one of the aforementioned assumptions of the literature.
2. Value concepts
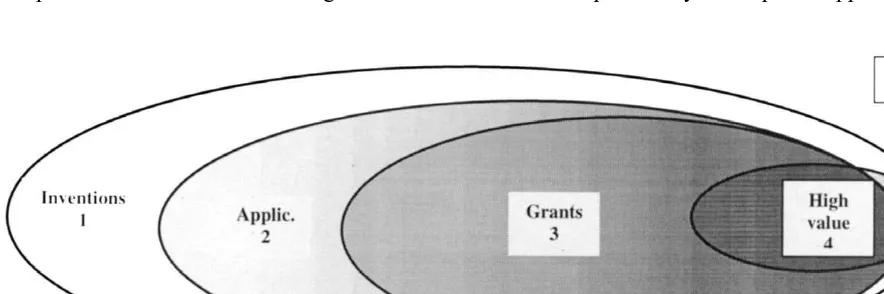
Fig. 1 presents a value scale within the universe of inventions; the darker the area, the higher the value of inventions. Hall et al. (1999) and Lanjouw et al. (1998) survey the existing literature attempting to identify the determinants of the value of granted patents. The three types of information (citations, renewal, family) are considered as reflecting the value of the patent. These analyses consist in comparing patents from zone 4 and from zone 3 in Fig. 1, under the assumption that among granted patents those that are often cited, renewed for a longer period, and / or filed in several countries, are more valuable. Harhoff et al. (1997) examine the issue at a higher level of the value scale, through interviews of assignees of German patents that have been renewed during 17 years. The authors find a highly skewed value distribution; a tail within the tail.
In the present paper the attention is placed upstream on the value scale of patent. It translates in Fig. 1 in comparing inventions of zone 3 with those of zone 2. Two factors suggest that the patents granted have a higher private value than the ones that are withdrawn or refused. The first one is related to the technological value and is intrinsic to the granting process. The search and examination procedures have to confirm that the invention is novel with respect to the state of the art, industrially applicable and inventive in character – i.e. it surpasses the skills of a professional confronting the problem concerned (grant reflects value). The second factor is related to the legal rights conferred to the patentee. The exclusive exploitation of the invention induces a potentially higher return (grant generates value).
3. The data
A probit model is used to investigate the determinants of the probability that a patent application at
EPO is granted. The dependent variable takes the value 1 if the patent is granted and zero otherwise. The database is composed of patent applications between 1985 and 1992 (391,440 patents). For the sake of computational capacities, 100 random samples are selected within the total number of applications. These stratified ‘grant-application’ samples account for 6% of all patent applications and contain 23,487 observations each. The applications that are not associated to any information regarding a grant, refusal or withdrawal (575 on average) are deleted, reducing the random samples to 22,911 observations.
The first set of variables reflects the adopted patenting strategy, and is closely related to the legal features of EPO patenting. ‘National priority’ takes the value 1 (0 otherwise) if the patent has first been filed in a national patent office, and then transferred to EPO after the priority year. ‘EPO priority’ is equal to 1 if the applicant goes directly at EPO, without filing a national priority application before (most applicants prefer the former possibility). Two other dummies characterise the patents that have taken an international option under the Patent Co-operation Treaty (PCT) before being transferred to the EPO, either after Chapter 1 or Chapter 2. PCT is basically an option for possible future patenting, that provides the applicant with a further delay before deciding to apply or not. The delay is 6 months (Chapter 1) or 12 months (Chapter 2). As shown in Grupp and Schmoch (1999), the effect of these dummies is not predictable. The PCT process provides the advantage of a longer investigation of the technological potential of the invention, and in case of a negative assessment, the application can be withdrawn before entering into expensive regional (EPO) phase. Having passed this test, the PCT application that we have in the data base – which have been transferred to the EPO – should be of high value. However, the argument can be reversed in the way that inventions with unclear market potential are passed through the PCT route, whereas those with an unquestionable potential are directly applied at EPO, since the direct path is cheaper.
The next variable reflects technological diversity embodied in the invention. Invention is seen by many authors as resulting from a process of combination of existing ideas and devices. It has been argued that the more these underlying ideas are diverse, the higher is the value of the invention. We built a discrete variable reflecting the number of 8 digits IPC (International Patent Classification, which is made of more than 60,000 technological categories) technical classes listed.
Other variables reflect the international dimension of the invention that is patented. Cross-border ownership is characterised by a binary variable equal to 1 if the country of residence of the applicant is different from the one of the inventor. Two dummies take alternatively the value 1 if there is more than one inventor or more than one applicant residing in the same country. Two other variables indicate that there is more than one inventor or more than one applicant with residence in different countries.
The last two variables aim at describing the international scope of the protection (or size of the family). It will allow to test whether the probability of a grant increases with the size of the family: as the cost of patenting increases with the number of designated countries, the value also should be increasing. The first variable takes the value 1 if Germany, France, the United Kingdom (G3) and zero to two other countries are designated for protection. The second one is equal to 1 if all EPO member
1 countries are designated.
1
4. Empirical results
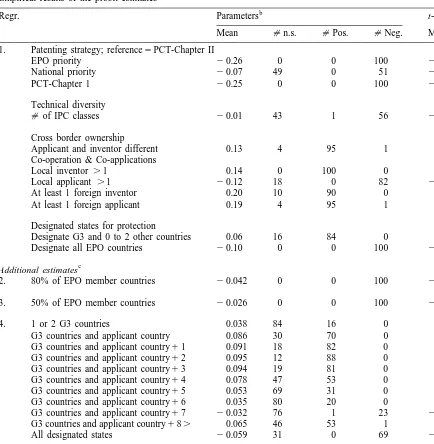
Regression 1 in Table 1 shows that the strategic choices regarding the patenting procedure provide useful information about the grant probability. The grant of a patent is more likely to occur if the application is filed at EPO through the PCT-Chapter 2 process. Then come the applications first filed in a national patent office before being transferred at EPO. The direct EPO applications and those transferred after PCT-Chapter 1 are less likely to be granted. The second stage of the PCT procedure extends the legal delay for international extension by about 2.5 years and provides the patentee with more in-depth information contained in a preliminary examination report. After this deadline, the applicant has to decide whether or not transferring the application at EPO. In the event of a positive reply, the EPO takes into account the preliminary examination, although the latter is not legally binding (cf. Grupp and Schmoch, 1999). These results suggest that if the PCT procedure is started, it is worth waiting for the information provided thanks to Chapter 2, and possibly dropping the application. This idea that haste is harmful concerns also the direct applications at EPO, which have a much weaker grant rate than regular applications.
The technical diversity has a negative impact on the probability of grant. The higher the number of IPC classes listed in an application, the lower the chance to get a grant. It is possible that a high number of classes may reflect not only the technological diversity of the invention, but also the perplexity of the examiner facing a somewhat unclear technology.
Inventions made under a cross border ownership structure have a higher average quality, as shown by the positive and significant coefficient associated with the variable. The two dummies characteris-ing patents invented by at least two inventors have significant and positive parameters. International co-operation seems even more fruitful than domestic co-operation. The success rate of the applications that are filed by more than one domestic applicant is significantly lower than for the applications filed by one applicant, but if the co-applicants are from different countries, the probability is higher.
The applications designating altogether Germany, France, the United Kingdom and zero to two other countries have a much higher grant rate than others. Those designating all EPO member countries have a lower grant rate. Regressions 2 and 3 show that the applications designating more than 80 per cent or more than 50 per cent of EPO member countries have a much lower probability to be granted. These results deserve particular attention because they contradict the assumption made in
2 other studies on patent value.
The effect of family size can be more thoroughly investigated with a set of dummy variables that progressively include an additional designated state. The first one characterises the applications designating only one or two G3 countries. The second one takes the value 1 for the applications designating the G3 countries exclusively, plus the country of the applicant. The third one concerns the G3 countries, plus one country and the country of the applicant . . . and the last one (tenth) takes the value 1 for the applications designating the G3 countries exclusively, plus the country of the applicant, plus eight other countries. The last dummy takes the value 1 if the applicant designates all EPO member countries for protection. These exclusive dummies are further used to compute a polytomic variable that takes the value of one for the patents not accounted for in the previous 11 dummies, a
2
Table 1
1. Patenting strategy; reference5PCT-Chapter II
EPO priority 20.26 0 0 100 24.94*
National priority 20.07 49 0 51 21.96*
PCT-Chapter 1 20.25 0 0 100 25.68*
Technical diversity
[ of IPC classes 20.01 43 1 56 21.66*
Cross border ownership
Applicant and inventor different 0.13 4 95 1 3.30*
Co-operation & Co-applications
Local inventor .1 0.14 0 100 0 7.34*
Local applicant .1 20.12 18 0 82 22.77*
At least 1 foreign inventor 0.20 10 90 0 3.03*
At least 1 foreign applicant 0.19 4 95 1 2.97*
Designated states for protection
Designate G3 and 0 to 2 other countries 0.06 16 84 0 2.61*
Designate all EPO countries 20.10 0 0 100 24.22*
c
Additional estimates
2. 80% of EPO member countries 20.042 0 0 100 26.79*
3. 50% of EPO member countries 20.026 0 0 100 24.29*
4. 1 or 2 G3 countries 0.038 84 16 0 0.70
G3 countries and applicant country 0.086 30 70 0 2.22*
G3 countries and applicant country11 0.091 18 82 0 2.65* G3 countries and applicant country12 0.095 12 88 0 2.60* G3 countries and applicant country13 0.094 19 81 0 2.36* G3 countries and applicant country14 0.078 47 53 0 1.75* G3 countries and applicant country15 0.053 69 31 0 1.13 G3 countries and applicant country16 0.035 80 20 0 0.82 G3 countries and applicant country17 20.032 76 1 23 20.93 G3 countries and applicant country18. 0.065 46 53 1 1.46
All designated states 20.059 31 0 69 22.09*
5. Polytomic 0.051 0 100 0 4.66*
Squared polytomic 20.004 0 0 100 25.47*
a
Probit estimates over 100 random samples of 23,487 EPO patents with application years between 1985 and 1992. Observations with no information on grant / refusal / withdrawal are dropped before the estimates, reducing the random samples to 22,911 observations on average. All estimates include 11 country dummies, 11 sectoral dummies, and a time trend. G2 stands for Germany and France; G35G21the UK; G45G31Italy.
b
The columns under the heading ‘parameters’ are first the average of the 100 estimated parameters; second the number of non-significant parameters ([n.s.); third the number of positive and significant parameters ([Pos.) and fourth the number of negative and significant parameters ([ Neg.). The last column presents the average t-stat, computed as the average parameter divided by the average standard error. * indicates the parameters that are significant at a 10% threshold.
c
value of 2 for the application designating 1 or 2 G3 countries, and so on. It takes a value of 12 for the patent designating all EPO countries.
Regression 4 shows that designating the G3 countries and up to 4 other EPO member countries increases significantly the grant probability. The patents designating all EPO countries are associated with a negative and significant coefficient. This non-linear relationship is tested in regression 5 with the polytomic variable and its square. The positive and significant effect of the variable and the negative effect of its square confirm that the grant rate increases gradually with the number of designated states (in addition to the G3) up to a threshold of 3–4 additional countries and decreases afterward.
There are two possible explanations to this result. First, the present analysis focuses on the value of patent applications, the value being associated to the grant, whereas the existing studies focus on the tail of the value distribution. Second, the assumption that patent value increases with its ‘family’ size might be sometimes wrong. Informal interviews with managers of small high-tech companies suggest that patenting in a large number of countries may reflect a lack of maturity of the applicant. For many technologies, protection in the largest markets along with economies of scale is enough to get world wide protection, without incurring the cost of patenting in smaller countries.
5. Concluding remarks
Information on the value of a patent is contained not only in citations, renewal, and family size, as recognised in previous studies, but also in other variables such as the patenting strategy and the extent of local and international co-operation between researcher and international networking. The link, assumed in the existing literature, between patent value and family size is not so clear-cut. It seems that protection in a few countries, mainly big ones, is enough for many valuable patents. This does not contradict the view that the few patents with a huge private value designate a large number of countries for protection, but suggests that the size of the patent family does not reflect linearly the value of patents.
References
Grupp, H., Schmoch, U., 1999. Patent statistics in the age of globalisation: new legal procedures, new analytical methods, new economic interpretation. Research Policy 28, 377–396.
Hall, B.H., Jaffe A., Trajtenberg, M., 1999. Market value and patent citations: A first look. Collection Cahiers de l’Innovation, 99004, CNRS.
Harhoff, D., Scherer, F.M., Vopel, K., 1997. Exploring the tail of patent value distributions. Mimeo, Harvard University. Lanjouw, J.O., Pakes, A., Putnam, J., 1998. How to count patents and value intellectual property: the uses of patent renewal