Marine Pigneur,1Tarik Berrada,1Marie Bonneau,1Thorsten Schumm,1Eugene Demler,2and J¨org Schmiedmayer1,∗ 1
Vienna Center for Quantum Science and Technology, Atominstitut, TU Wien, Stadionallee 2, 1020 Vienna, Austria 2Department of Physics, Harvard University, Cambridge, Massachusetts 02138, USA
(Dated: November 20, 2017)
We present an experimental study on the non-equilibrium tunnel dynamics of two coupled one-dimensional Bose-Einstein quasi-condensates deep in the Josephson regime. Josephson oscillations are initiated by splitting a single one-dimensional condensate and imprinting a relative phase between the superfluids. Regardless of the initial state and experimental parameters, the dynamics of the relative phase and atom number imbalance shows a relaxation to a phase-locked steady state. The latter is characterized by a high phase coherence and reduced fluctuations with respect to the initial state. We propose an empirical model based on the analogy with the anharmonic oscillator to describe the effect of various experimental parameters. A microscopic theory compatible with our observations is still missing.
All quantum evolution is in principle unitary, and thus iso-lated quantum systems should never relax to a steady state. However, both theoretical and experimental works [1–4] show that non-integrable systems reach a relaxed state resembling a Gibbs ensemble [5, 6]. In contrast, integrable systems gener-ally relax to pre-thermal steady states, for which a description by a generalized Gibbs ensemble reflects the conserved quan-tities in the system. It is especially interesting to study the thermalization in systems that are close to being integrable.
The recent experimental advances in manipulating and probing ultracold atomic gases established them as ideal model system to study the non-equilibrium dynamics and re-laxation of isolated quantum systems [1]. In this context, an interesting model system is a bosonic Josephson junction con-sisting of two coupled superfluids [7, 8]. Its dynamics in the three-dimensional case has been investigated experimentally [9–11]. The physics in reduced dimensions (1D) can be essen-tially described by the quantum Sine-Gordon model [12–17], as recently verified for systems in thermal equilibrium [18]. The integrability of this model implies rich dynamics. In par-ticular, the dynamics occurring after a quench of the tunnel coupling was recently studied in a series of theoretical pa-pers [19–21] and showed a slow and incomplete relaxation. In this letter, we present an experimental study of the dynamics of two tunnel-coupled 1D-superfluids initialized with equal numbers and a uniform relative phase0 < φ0 < π. The sys-tem relaxes to a phase-locked equilibrium state.
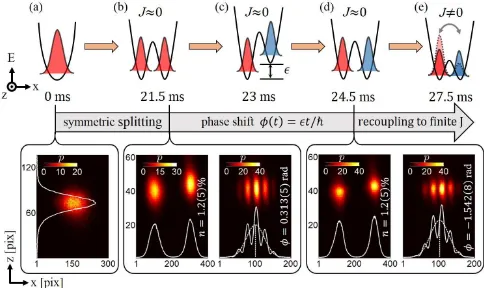
Our experimental system consists of two one-dimensional quasi-condensates (1D-BEC) of87Rb magnetically trapped in a double-well potential with tunable barrier height. The prepa-ration protocol, illustrated by Fig. 1, relies on an atom chip [22] to coherently manipulate the wave-packets [23]. The sequence can be interrupted at any stage to perform fluores-cence imaging [24] after a time-of-flight of46 ms. Fluores-cence pictures of the main stages are displayed in Fig. 1. We start the sequence with a single 1D-BEC obtained by evaporative cooling in an trap elongated along the z-axis (Fig. 1(a)). The initial condensate contains750to4500atoms. The trap frequencies areωx,y= 2π×3 kHztransversely and
FIG. 1. Schematic of the preparation sequence consisting in a split-ting(a,b)of the original wave-packet to a trap of negligible coupling, a phase imprinting between the wave-packets(c,d)and a recoupling to initiate a tunneling dynamics(e). The captions display the fluores-cence pictures (averaged over 10 repetitions) of the atomic density after46 mstime-of-flight and the corresponding integrated profiles.
ωz= 2π×22 Hz longitudinally, corresponding to a
conden-sate length between 20µm (for 750atoms) and 33µm (for 4500atoms) [25]. Yang-Yang thermometry [26] gives an esti-mate of the initial temperature ofT = 18(3) nK.
Using radiofrequency-dressing [27, 28], we deform the trap in 21.5 ms by continuously raising a barrier and obtain a double-well potential elongated along thez-axis and symmet-ric with respect to the barrier (Fig. 1(b)). Along thex-axis, it results in a splitting of the wave-function during the last5 ms of the ramp. The barrier is made high enough to neglect tun-neling, such that the two 1D-BECs are considered decoupled. We define the relative phase
φ(t) =φL(t)−φR(t), (1)
withφL,R(t)the phase of the left and right component,
re-spectively. The phase is experimentally extracted from the interference pattern resulting from the overlap of the wave-functions after time-of-flight (cf. pictures of Fig.1(b,d)). The conjugated variable is the normalized atom number imbalance
defined by:
n(t) =NL(t)−NR(t)
NL(t) +NR(t)
, (2)
withNL,R(t)the atom number of the left and right
compo-nent, respectively. The imbalance measurement requires to move the clouds further apart by raising the barrier height. This prevents their overlap in time-of-flight. At this stage, the averaged values of both the imbalance and the phase are close to zero (cf. pictures of Fig. 1(b,d)) due to the trap symmetry.
We then imprint a initial relative phaseφ0by shifting one site of the double-well along the vertical y-axis in 1.5 ms (Fig. 1(c)). This introduces an energy differenceǫ between the two sites and results in a phase accumulationφ(t) =ǫt/~. The trap symmetry is then re-established in1.5 ms(Fig. 1(d)). We prepare a relative phase between0 andπby varying the value of the vertical shift. The phase appears as a shift be-tween the integrated profile maximum and the center of the envelope, as displayed in the fluorescence pictures of Fig. 1(d) and Fig. 3(a)). The straightness of the fringes shows that the relative phase is uniformly imprinted along the elongated direction of the condensate with negligible fluctuations at the scale of the imaging resolution (4µm in object space) [24]. In the decoupled trap, the relative phase randomizes under the effect of interaction-induced phase diffusion [29– 31]. In our case, this effect is strongly reduced by a large number-squeezing factor obtained by the splitting of the ini-tial BEC [23, 32]. We define the number-squeezing factor by ξN = ∆n/
√
N with ∆n the standard deviation of the imbalance distribution and N the total atom number. For our typical atom number N = 2500(200)atoms, we ob-tain ξN = 0.57(6). The corresponding phase diffusion rate
is 0.05(2) rad/ms. In circular statistics, the phase coher-ence is indicated by the phasor Rof the phase distribution, which varies between 0 for a random distribution and1 for a perfectly narrow one. The phasor degrades fromRsplit = 0.94(2)after splitting toR0= 0.91(2)at the end of the prepa-ration sequence, indicating that a high phase coherence is pre-served (Fig. 3(a)) and that the initial phaseφ0is well defined. The imbalance is not affected by the phase shift such that its value isn0≈0.
Finally, the barrier is lowered in 3 ms to reconnect the wave-packets (Fig. 1(e)). This initiates the tunneling dynam-ics with a single particle tunnel-coupling strength varying be-tweenJ/h= 2(1) HzandJ/h= 32(3) Hz. The correspond-ing transverse frequencies vary between ωx= 2π×1.2 kHz
and ωx= 2π×1.5 kHz. The smallest barrier height
hB/h= 3.2 kHzis higher than the largest chemical
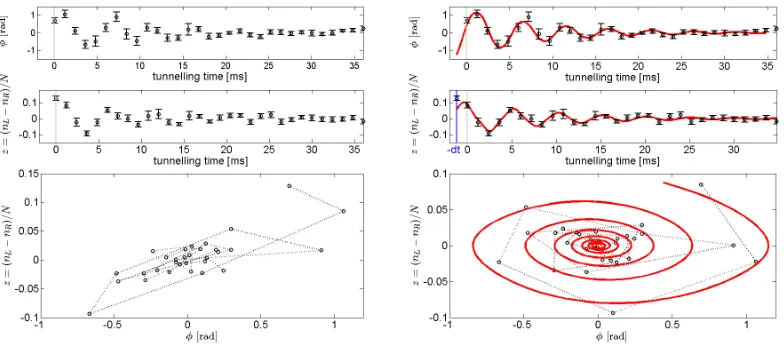
poten-tial µ/h= 1.9 kHz obtained for4500atoms [25]. It shows that the observed dynamics primarily results from tunnel-ing. The relative phase and imbalance evolve during a given tunneling time after which one of them is measured destructively. The preparation is repeated for increasingly long tunneling times to reconstruct the entire dynamics, al-ternating between phase and imbalance measurement. A typical example of the oscillating dynamics is displayed in Fig. 2 for N = 3300(600)atoms, φ0=−1.3(4) rad and
n0=−0.004(13). The oscillations of the mean phase and
im-FIG. 2. Damped Josephson oscillations of the relative phase(a) and imbalance (b) for N = 3300(600)atoms, φ0=−1.3(4) rad andn0=−0.004(13). Red line: Fit result giving a damping time
τ= 9.8(2) ms,U/h= 0.71(15) HzandJ/h= 8(2) Hz. Red dots: residuals (shifted for clarity). Dashed line: corresponding predic-tions of the mean-field two-mode Bose-Hubbard model. (c) Evolu-tion in the phase portrait representaEvolu-tion.
balance present a damping on a timescale of15 mstoward an equilibrium state (neq ≈0, φeq ≈0) without decrease of the
total atom number. While the oscillations are expected from a two-mode Bose-Hubbard model [33], such a damping goes beyond the existing microscopic descriptions [19, 20, 34].
The analysis of the individual fluorescence images shows that the fringe patterns after damping are straight and cen-tered on the envelope maximum, as displayed in Fig. 3(b). We deduce that the relative phase reaches the value of zero uniformly along the condensate. Furthermore, the contrast of the integrated fringes barely degrades fromC0= 0.56(7)to
Ceq= 0.49(8). This indicates that the longitudinal phase fluc-tuations do not increase at the timescale of the damping.
The phase distribution, obtained from 50 repetitions of an experimental sequence, shows that the phase locking is very reproducible (Fig. 3(b)). After relaxation, the phasor value reaches Req= 0.96(2), such that the relaxation increases the phase coherence. The corresponding coherence factor is
hcos(φeq)i= 0.95(2). The phase-locking toward an equilib-rium state dominates over dephasing phenomena expected in such a system [35].
experimen-FIG. 3. (a) Top:Single fluorescence picture of interference fringes of the initial state and corresponding integrated profile. Bottom: Phase distribution (50 realizations) showing a high phase coherence. (b) Top:Single fluorescence picture of interference fringes obtained after relaxation and showing a uniform phase-locking. We observe an expansion of the cloud due to a slow breathing mode (see sup-plementary materials). Bottom:Phase distribution (50 realizations) showing an increase of phase coherence.
tal parameters. In order to analyze the damped oscillations obtained under various conditions, we develop a phenomeno-logical model adapted from the mean-field two-mode Bose-Hubbard model [8]. We callU the on-site interaction energy andJ the single particle tunnel coupling energy. The ratio
N U/2Jis in the order of 100, placing our experiment deeply into the Josephson regime [36]. The derivation of the Hamil-tonian for a symmetric trap gives the following undamped time evolution of the phase and imbalance:
˙ The interplay between the inter-atomic interactionN Uand the tunneling 2J leads to different dynamical modes. As demonstrated in [33], every initial state (n(0), φ(0)) obeying
N U
4J n(0)
2
−p1−n(0)2cos(φ(0))≤1 (5)
results in Josephson oscillations of the phase and imbalance characterized by the plasma frequencyωp≈
√
N U2J/~. Our experimental protocol preparesn(0)≈0such that Eq. (5) is always verified. The system presents an analogy with a classi-cal momentum-shortened pendulum [37] in which the relative
phaseφis analogous to the pendulum angle and the imbalance
nis proportional to its momentumφ˙. In [37], the length of the pendulum is defined byl(t) =p
1−n2(t). DefiningN 0 as the amplitude of then−oscillations, it follows from Eq. (5) that N0≤2
p
2J/N U in the limit of N U ≫ 2J. Conse-quently, the momentum-shortening is negligible in our case and the analytical solution of a rigid pendulum expressed in terms of the sn-Jacobi elliptic function is a good approxima-tion [38, 39]. To account for the damping of the oscillaapproxima-tions, we follow the approach of [37] and add a dissipative term to Eq. (3):
˙
n(t)≈ −2~Jp
1−n2(t) sin (φ(t))− η
Nφ˙(t), (6)
whereηis an empirical dimensionless viscosity.ηnormalized byN has the physical meaning of the shunting conductance in the Resistively and Capacitively Shunted Junction (RCSJ) model, in which a damping appears as in Eq. (6) [40, 41]. The viscosity results in an exponential decay with the characteris-tic timeτ. In the harmonic regime and in the limitN U ≫2J,
τreads:
τ(U)≈U η2~. (7)
Assuming that Eq. (7) holds true for large amplitude oscilla-tions, we empirically modify the analytical solutions to ac-count for a damping. The phaseφ(t)and the imbalancen(t)
Φ0andN0are the amplitudes of the phase and imbalance os-cillations.ωis the damped harmonic frequency, which differs from the plasma frequencyωp byω=
q ω2
p−1/τ2.
How-ever, the correction introduced by τ is negligible. φ′ is a temporal shift of the oscillations to compensate that the sn-function conventionally starts atφ(0) = Φ0. The argument sin Φ0
2
e−t/τ in the sn-function describes the
anharmonic-ity of the oscillation, initially set byΦ0 and exponentially decreasing over time under the effect of η. We establish a connection betweenU, J andη of the two-mode model and
N0,Φ0,ωandτof the pendulum analogy. It relies on the ap-proximationω ≈ωp, on the definition ofτgiven by Eq. (7)
and by comparing Eq. (9) with the linearized Eq. (4).
J≈ ~4ωsin(Φ0N0/2), (10)
U ≈2~ωsin(Φ0/2)
N×N0
, (11)
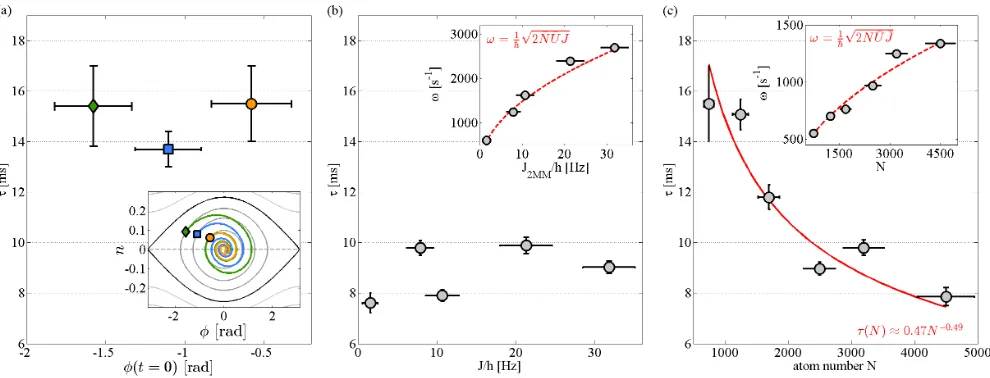
FIG. 4. Relaxation dependence on parameters (a)Variation ofτwith the initial phase forN= 750(100)atoms andJ/h= 6(1) Hz. The damping time remains constant within the error bars, excluding a dependence on the oscillation amplitudes. Inset: Fit results for the various prepared phases showing the self-consistency of the trajectories. (b)Variation ofτ with the tunnel coupling forN = 3500(500)atoms and
φ0 = 1.93(35) rad. τdoes not present a dependence on the tunnel couplingJ/hbetween2(1) Hzand32(3) Hz. Inset: Fit results for the plasma frequencyωand prediction of the 2-mode model for constant values ofN¯ = 3500atoms andU /h¯ = 0.85 Hz(red dashed line).(c) Variation ofτ with the atom numberNforJ/h= 7(2) Hzandφ0=−1.48(98) rad.τpresents a dependence in1/
√
N(red line). Inset:ω
versus N and prediction of the 2-mode model (dashed red line) for the averaged valuesU /h¯ = 0.71 HzandJ/h¯ = 7 Hzdeduced from the fit parameters.
We use Eqs. (8),(9) as a fit model. The small amplitude of then-oscillations makes it difficult to estimateN0. Asη depends onN0 through Eq. (12), fitting the dynamics with Eqs. (4),(6) is unreliable. In contrast, τ shows no correla-tions withN0 and indicates clearly the effect of the experi-mental parameters on the relaxation mechanism. We recover the values ofU andJusing Eqs. (10),(11) and insert them in Eqs. (3),(4) to build the phase portrait presented in Fig. 2(c) and in the inset of Fig. 4(a).
Eqs. (8),(9) reproduce the decay of the oscillations ampli-tude. Also, as the system gets closer to the harmonic regime, the oscillation frequency increases. It shows in Fig. 2(a),(b) when comparing the data and fit (red line) with the undamped prediction (dashed gray line) of the 2-mode model. The ab-sence of structure in the residuals shows that it is justified to fit the dynamics with a unique damping time, similarly to a pendulum evolving in a medium of fixed viscosity. This im-plies that the relaxation does not depend on the amplitude of the oscillation.
A more systematic check of the dependence of τ on the oscillation amplitude is performed by preparing oscillations of initial phase φ0 varied between −0.2π and −0.8π. J andN are kept constant withJ/h= 6(1) Hz(fit result) and
N = 750(100)atoms. Fig. 4(a) displays the values ofτ for the different initial phases and the inset shows the trajectories deduced from the fit in the phase portrait representation. We observe a constant damping timeτ= 15(1) ms, correspond-ing toη= 26(7). Since a larger initial phase also implies a larger amplitude of the imbalance oscillation, we can state that the relaxation is independent of then−oscillation amplitude.
We also check the influence of the tunnel coupling strength
between J/h= 2(1) Hz and J/h= 32(3) Hz (fit result). The initial state is characterized by N = 3500(500)atoms,
n0=−0.004(13), φ0=−1.93(35) rad, C0= 0.53(7) and
R0= 0.94(3). The fit results for the plasma frequency ω are displayed in the inset of Fig. 4(b) and follows the predic-tion of the 2-mode model. Fig. 4(b) shows that the damping does not present an obvious dependence onJ. This implies that the damping does not result from the tunneling dynamics of the wave-functions, nor from excitations to higher trans-verse modes. Additionally, the absence of dependence ofτon Φ0,N0 andJ shows that the relaxation does not depend on the plasma frequency, that we can write asω= 4J
~N0sin( Φ0
2 ). This excludes a friction between the atoms and a thermal background gas as a cause for the damping.
In the following, we measure the dynamics for a total atom number varied between750and4500atoms to investigate the effect on the relaxation. The barrier height is kept identical and the change of atom number has a negligible impact on the tunnel coupling which remainsJ/h= 7(2) Hz. The pre-pared phase isφ0 =−1.48(98) rad, associated to a contrast
C0= 0.55(7) and a phasor R0= 0.81(3). The typical ini-tial imbalance for the largest atom number isn0= 0.006(47). The variation of τ with the atom number is displayed in Fig. 4(c). We fitτ by the functionαNβ, with αandβ the
fit parameters and obtainα = 0.47(2)andβ = −0.49(3). According to Eq. (7),τ ∝1/U η, leading toU η∝√N. The dependence of the viscosityηwith the atom number depends on the variation ofUwithN.
re-mains unaffected by the amplitude and frequency of the os-cillations. It is unchanged for a tunnel couplingJ/hbetween 2 Hzand32 Hzand presents a dependence in approximately 1/√N with the atom number. The observed phase-locking is much faster than predicted in [19–21] and leads to an equi-librium state with small fluctuations in phase and atom num-ber imbalance. This questions the suitability of the quantum Sine-Gordon model to describe the out-of-equilibrium tunnel-ing dynamics of two 1D superfluids confined in a harmonic potential. Ongoing work aims at determining the microscopic origin of the relaxation. This requires a deeper understanding of the relaxed state and an estimation of its energy. While this could in principle be deduced fromJhcosφiand from the
fi-nal phase fluctuations, the latter are dominated by our imaging resolution and imaging shot noise in the current experiment.
We are grateful to I. Mazets, T. Schweigler, G. Zar´and I. Lovas and E. Dalla Torre for helpful discussions and the-oretical support. This research was supported by the ERC advanced grant QuantumRelax and by the Austrian Science Fund (FWF) through the project SFB FoQuS (SFB F40). M.P. and T.B. acknowledge the support of the Vienna Doctoral Pro-gram CoQuS. M.B. was supported by MC fellowship ETAB under grant agreement no.656530. E.D. acknowledges the support of the Harvard-MIT CUA, NSF Grant No. DMR-1308435 and of the AFOSR Quantum Simulation MURI, AFOSR Grant No. FA9550-16-1-0323.
[1] T. Langen, R. Geiger, and J. Schmiedmayer, Annual Review of Condensed Matter Physics6, 201 (2015).
[2] A. Polkovnikov and A. Silva, Rev. Mod. Phys.83, 863 (2011). [3] P. Calabrese, EPJ Web of Conferences90, 08001 (2015). [4] J. Eisert, M. Friesdorf, and C. Gogolin, Nat. Phys.11, 124
(2015).
[5] M. Srednicki, Phys. Rev. E50(1994).
[6] M. Rigol, V. Dunjko, and M. Olshanii, Nature452, 854 (2008). [7] S. Levy, E. Lahoud, I. Shomroni, and J. Steinhauer, Nat. Lett.
449, 579 (2007).
[8] R.Gati and M. Oberthaler, J. Phys. B40(2007).
[9] M. Albiez, R. Gati, F. Jonas, S. Hunsmann, M. Cristiani, and M. K. Oberthaler, Phys. Rev. Lett.95, 010402 (2005). [10] L. J. Leblanc, A. B. Bardon, J. Mckeever, M. H. T. Extavour,
D. Jervis, and J. H. Thywissen, Phys. Rev. Lett.106, 025302 (2011).
[11] G. Spagnolli, G. Semeghini, L. Masi, G. Ferioli, A. Trenkwalder, S. Coop, M. Landini, and L. Pezz`e, Phys. Rev. L118, 230403 (2017).
[12] V. Gritsev, A. Polkovnikov, and E. Demler, Phys. Rev. B75, 174511 (2007).
[13] W. E. Thirring, Ann. Phys.3, 91 (1958). [14] S. Coleman, Phys. Rev. D11, 2088 (1975). [15] S. Mandelstam, Phys. Rev. D11, 3026 (1975).
[16] L. D. Faddeev and V. E. Korepin, Phys. Rep.42, 1 (1978). [17] E. K. Sklyanin, L. A. Takhtadzhyan, and L. D. Faddeev,
Theo-retical and Mathematical Physics40, 688 (1979).
[18] T. Schweigler, V. Kasper, S. Erne, I. E. Mazets, B. Rauer, F. Cataldini, T. Langen, T. Gasenzer, J. Berges, and J. Schmied-mayer, Nature545, 323 (2017).
[19] E. G. D. Torre, E. Demler, and A. Polkovnikov, Phys. Rev. Lett. 110, 090404 (2013).
[20] L. Foini and T. Giamarchi, Phys. Rev. A91, 023627 (2015). [21] L. Foini and T. Giamarchi, EPJ - st226, 2763 (2017).
[22] M. Trinker, S. Groth, S. Haslinger, S. Manz, T. Betz, S. Schnei-der, I. Bar-Joseph, T. Schumm, and J. Schmiedmayer, Appl. Phys. Lett.92, 254102 (2008).
[23] T. Berrada, S. van Frank, R. B¨ucker, T. Schumm, J.-F. Schaff, and J. Schmiedmayer, Nat. Com.4, 2077 (2013).
[24] R. B¨ucker, a. Perrin, S. Manz, T. Betz, C. Koller, T. Plisson, J. Rottmann, T. Schumm, and J. Schmiedmayer, New Journal of Physics11, 103039 (2009).
[25] F. Gerbier, EPL66, 771 (2004).
[26] M. J. Davis, P. B. Blakie, A. H. V. Amerongen, N. J. V. Druten, and K. V. Kheruntsyan, Phys. Rev. A85, 031604 (2012).
[27] I. Lesanovsky, T. Schumm, S. Hofferberth, L. Andersson, P. Kr¨uger, and J. Schmiedmayer, Phys. Rev. A73, 033619 (2006).
[28] S. Hofferberth, I. Lesanovsky, B. Fischer, J. Verdu, and J. Schmiedmayer, Nat. Phys.2, 710 (2006).
[29] M. Lewenstein and L. You, Phy. Rev. Lett.77, 3489 (1996). [30] J. Javanainen and M. Wilkens, Phy. Rev. Lett.78, 23 (1997). [31] F. Leggett, A. J.and Sols, Phy. Rev. Lett.81, 9007 (1998). [32] G. Jo, Y. Shin, S. Will, T. A. Pasquini, M. Saba, W. Ketterle,
and D. E. Pritchard, Phy. Rev. Lett.98, 030407 (2007). [33] S. Raghavan, A. Smerzi, S. Fantoni, and S. R. Shenoy, Phy.
Rev. A59, 620 (1999).
[34] K. Sakmann, A. I. Streltsov, O. E. Alon, and L. S. Cederbaum, 220601, 2 (2009).
[35] I. Bouchoule, EPJD35, 147 (2005).
[36] A. J. Leggett, Rev. of Mod. Phys.73, 307 (2001).
[37] I. Marino, S. Raghavan, S. Fantoni, S. Shenoy, and a. Smerzi, Phys. Rev. A60, 487 (1999).
[38] K. Ochs, EJP32, 479 (2011).
[39] L. Milne-Thomson, M. Abramowitz, and I. Stegun,Handbook of Mathematical Functions(1972).
[40] M. Tinkham,Introduction to Superconductivity(McGraw-Hill, New York, 1975).
Supplementary Materials
I. EXPERIMENTAL PREPARATION OF THE TUNNELING DYNAMICS
Generation of a 1D-BEC.
An atom chip is used to trap87Rb atoms in theF = 1, mF =−1state of a magnetic trap elongated along thez-axis. The
trap is characterized by the transverse frequenciesωx,y = 2π×3 kHzand the longitudinal frequencyωz= 2π×22 Hz. In this
trap, the atoms are cooled down to degeneracy by radio-frequency evaporative cooling. The typical atom number at this stage is 4500atoms, associated to a chemical potentialµ/h=5 kHz. The atom number was decreased in a set of data to investigate the effect of the atom number on the relaxation. In order to vary the atom number with limited change of temperature, we maintain a radio-frequency field of14 kHzabove the trap bottom for a duration varying between0 msand60 msand evaporate the atoms heated by collisions. With this method, we vary the atom number by a factor of6with negligible change of the temperature.
Splitting.
The atom chip enables the generation of radio-frequency fields of tunable amplitude and orientation. We use this feature to perform a radio-frequency dressing of our trap and obtain an elongated double-well potential. The symmetry of the trap, controlled by the field orientation, presents negligible fluctuations and a drift below 1◦at the timescale required to obtain a data set. The barrier height is tuned by the field amplitude. The maximal current isImax= 80.25 mA−pp. To perform the splitting of the wave-functions, the dressing amplitude is 0.65×Imax, corresponding to a trap of frequencies ωx= 2π×1.7 kHz,
ωy = 2π×1.7 kHz and ωz= 2π×13 Hz. We perform a linear splitting ramp in 21.5 ms. This duration gives the best
number-squeezing factor (ξN = 0.57(6)), relevant to slow down phase diffusion at best during the phase preparation. The
typical phase diffusion rate we measured for N ≈ 2500atoms is 0.05(2) rad/ms such that the phase coherence remains high after our state preparation. Another effect resulting from the splitting in a breathing mode excited by the change of trap geometry. When raising the tunnel barrier by RF-dressing, the longitudinal trap frequencyωzfirst decreases, resulting in a trap
decompression, before increasing again. This, associated to the splitting in two components of the original condensate, results in a slow breathing motion at a typical frequency of30 Hz. The timescale of the breathing is slow compared to the decay time of the oscillations but clearly appears on the fluorescence pictures as an increase of the length of the interference patterns along thez−axis (Fig. 3).
Phase imprinting.
In the trap of negligible coupling, we imprint a global phase difference between the two wave-functions, named
φ0 = φL(0)−φR(0). For this, we realize a vertical displacement of one of the sites with respect to the other to induce an
energy difference. This stage takes 3 ms, during which the the energy difference is ramped up from≈0to a final valueǫand down again to≈0to recover a symmetric trap. We prepare initial phases between−0.2πand−0.8π.
Recoupling to the tunneling trap.
After the phase preparation, the barrier height is linearly decreased in3 mstoward the trap of study to perform a recoupling between the wave-functions. In the scope of this study, the dressing amplitude of the final trap was varied between0.525×Imax and0.6×Imax. The corresponding transverse frequency varies fromωx = 2π×1.2 kHztoωx = 2π×1.5 kHzand ωy
varies from ωy = 2π×1.6 kHztoωy = 2π×1.7 kHz. This corresponds to a well spacing between w = 1.18µm and
w= 1.78µm. The longitudinal frequency varies betweenωz = 2π×12 Hzandωz = 2π×13 Hz. During the recoupling, the
tunnel coupling valueJis not instantaneously turned from≈0to its final value, but ramps up. Hence, the system undergoes a tunneling dynamics in a continuously changing trap. This is one reason why the data at timet = 0 mspresented in Fig. 2 do not correspond to the prepared state: the imbalance is not zero and the initial phase is not the maximal amplitude of the phase oscillation. In addition, the measurement procedure constrains us to lose approximately0.75 msof the dynamics, due to a time offset detailed in the following part.
II. CORRECTION OF TECHNICAL OFFSETS
The oscillations in phase and imbalance presented in the paper are corrected from three technical offsets that we take into account as additional fit parameters. This section presents the nature and origin of these offsets as well as their typical values.
Temporal offset.
realize a time-of-flight imaging. The clouds fall and expand under the effect of inter-atomic interactions, primarily along the transverse direction. After46 msof free expansion, the wave-packets fully overlap and interference fringes are visible. We then measure the density profiles using a light-sheet fluorescence detection system. The imbalance measurement relies on the same principle but requires an additional separation stage to prevent the overlap of the wave-packets. Before switching off the trap, the barrier height is raised to its highest value in1 ms, which is much faster than the inverse Josephson frequency. It gives a momentum to the atoms in the direction opposite to the barrier and excites a dipolar oscillation. After0.2 ms, the atoms reach the maximum amplitude of the oscillation and we rapidly switch off the dressing amplitude (≈360µs). The atom clouds suddenly experience a single trap and acquire some additional velocity toward each other. After a quarter of one oscillation, this velocity is maximal and the trap is switched off to perform a time-of-flight measurement. In this process, the clouds cross each other, but the number of collisions is negligible.
The duration of the measurement sequence before switching off the trap is the same for both the phase and the imbalance. However, while the imbalance measurement involves a quasi-instantaneous decoupling by raising the tunnel barrier, the phase measurement keeps the atoms in the coupled trap. It results in a systematic time shiftdtbetween the phase oscillations and the imbalance oscillations. The time shift is evaluated using the fit model presented in the paper, which requires to fit the phase and imbalance simultaneously. An interpolation of the imbalance data is required as the time shift is not necessarily a multiple of the experimental time step. We evaluate the time shift for each data set and the value is displayed in the TABLE I. The imbalance data presented in the paper are measured. The fit is performed on the measured phase data and on the interpolated imbalance data shifted by−dt. The data in the phase portrait representation are the measured phase values and the interpolated imbalance values.
FIG. S1. Time shift correction. Left: Time evolution of the phase and imbalance before time shift correction. The fit is not possible and the pairs (n,φ) in the phase portrait present a tilt characteristic of a time shift. Right:Time evolution of the phase and imbalance where the imbalance oscillation is shifted by−dt. The time shift in this case isdt= 0.75 ms.
Phase offset
The measured phase is extracted for each experimental realization from the interference profiles integrated along the longitu-dinal axis. We assume that the interference signal is a generic envelopeg(x)modulated by an interference term, such that the transverse density reads:
ρ(x)≈g(x)[1 +Ccos(k0(x−x0) +φ)] (13)
x0is determined, the most general approach to determine the phase consists in taking the Fourier transform of Eq. (13):
F(k) =√2πG(k)∗
δ(k) +C 2 e
iφδ(k
−k0) +e−iφδ(k+k0)
. (14)
whereG(k)is the Fourier transform of the generic envelope,δ(k)the Dirac distribution and∗the convolution product. The modulus ofG(k)consists in a middle peak corresponding to the envelope and two side bands centered onk0 and−k0. The phase is computed by averaging the complex argument ofG(k)over one side band:
φF T = arg
"
Z k0+∆k/2
k0−∆k/2
G(k)
#
. (15)
Despite the careful evaluation ofx0, a small residual offset on the phase oscillations can still be present, for instance because of the finite pixel size, which limits our precision. This offset is extracted from the fit parameterφ¯
φ(t) = 2 arcsin
sin
Φ0
2
e−t/τ
×sn
ωt+φ′
sin
Φ0
2
e−t/τ
+ ¯φ. (16)
The value of the phase offset is of the order of0.2 radwhich typically corresponds to a fringe displacement of one pixel.
Imbalance offset
A small asymmetry between the two sites of the double-well can be present as we do not calibrate the trap symmetry before each measurement. This goes beyond the pendulum analogy and must be corrected to present the oscillations in the phase portrait representation as in Fig. 2. We can show that an energy differenceǫbetween the two sites of the double-well results in an offset of the atomic imbalancen¯defined by:
¯
n=−~ǫω1 N0
2 sin Φ0 2
, (17)
withωthe plasma frequency andN0,Φ0the amplitudes of the oscillations in imbalance and phase. We take it onto account as an additional fit parametern¯such that the fit function of the imbalance reads:
n(t) = N0
ω×2 sin(Φ0 2 )
˙
φ(t) + ¯n. (18)
Typically,n¯is below 0.03. When comparing the damping in a symmetric and slightly asymmetric trap (n¯ ≈0.1), we observe no significant effect of the asymmetry on the damping time.
III. FIT RESULTS
For each set of data, we display in TABLE I the values of the atom number deduced from the fluorescence pictures, the values of the technical offsets, the fit parameters extracted from Eqs. (8)(9) and the corresponding parameters of the 2-mode model deduced from Eqs. (10)(11)(12). The amplitude of the imbalance oscillationsN0is hard to determine as it is very small and depends strongly ondt. AsN0impacts stronglyU/h, we constrainedN0(within the error bars ofn) to maintain a value of U consistent between the various data sets. The impact of this constrains on the fit residuals is negligible. The constrained values are indicated in bold.
Uncertainties and error bars:
Scan ref Atom Technical offsets Fit parameters 2-mode model Figures number dt [ms] n¯ Φ0[rad] N0 τ[ms] ω[Hz] U/h[Hz] J/h[Hz] η ǫ/h[Hz]
150216 22 3400 0.5 0.032(5) 1.14(2) 0.16(2) 9.0(2) 2697(5) 0.86(9) 32(3) 41(5) 93(18) Fig. 4(b) 150216 6667 3200 0.9 -0.016(7) 1.24(2) 0.13(2) 9.9(3) 2394(5) 0.86(13) 21(3) 37(6) 54(24) Fig. 4(b) 150216 24 3400 1.0 -0.025(7) 1.59(3) 0.12(3) 7.9(2) 1626(6) 0.94(19) 11(2) 43(8) 79(27) Fig. 4(b) 150216 6165 3200 1.1 -0.009(5) 1.32(3) 0.11(2) 9.8(2) 1248(4) 0.71(15) 8(2) 46(10) 14(13) Fig. 4(b),(c) 150216 23 3300 1.8 -0.007(3) 1.53(7) 0.07(3) 7.6(4) 607(6) 0.68(32) 2(1) 62(30) 16(19) Fig. 4(b) 150306 380 4500 1.3 0.008(3) 1.89(7) 0.12(4) 7.9(4) 1337(8) 0.67(25) 8(3) 61(23) -24(24) Fig. 4(c) 150304 170 2500 1.5 0.036(4) 1.49(4) 0.12(2) 9.0(2) 965(3) 0.71(11) 7(1) 50(8) -65(12) Fig. 4(c) 150304 1730 1700 1.5 0.048(8) 1.58(5) 0.14(2) 11.8(5) 761(3) 0.72(12) 6(1) 37(7) -58(15) Fig. 4(c) 150304 1760 1250 1.1 0.055(6) 1.26(6) 0.14(2) 15.1(6) 701(3) 0.76(11) 7(1) 28(4) -52(10) Fig. 4(c) 150307 4701 750 1.5 -0.003(8) 0.66(4) 0.09(2) 15.5(1.5) 548(6) 0.80(20) 6(2) 26(7) 2(4) Fig. 4(a),(c) 150307 4700 750 1.7 0.001(9) 1.30(5) 0.17(3) 13.7(7) 554(4) 0.86(13) 6(1) 27(4) -1(5) Fig. 4(a) 150307 4710 750 1.6 -0.002(23) 1.77(16) 0.19(6) 15.4(1.6) 502(7) 0.88(30) 5(2) 23(8) 1(15) Fig. 4(a)