Effect of Planting Distance on Nitrogen Uptake and Productivity of Paddy
Var. Rojolele Irradiated with Gamma Rays in Inceptisol
Amri Amanah*, Sri Nuryani Hidayah Utami, Makruf Nurudin
Department of Soil Science, Faculty of Agriculture, Universitas Gadjah MadaJln. Flora no. 1, Bulaksumur, Sleman, Yogyakarta 5528, Indonesia
*Corresponding email: [email protected]
ABSTRACT
The objective of this study was to examine the effect of planting distance of paddy var. Rojolele planted in conventional legowo system and dosage of gamma rays irradiated on nitrogen uptake and productivity of paddy. The experiment was arranged in a randomized complete block design (RCBD) with twelve treatments and three replications. The first factor was gamma ray radiation, consisted of three levels, namely control seed (B0), seed irradiated with gamma rays of 200 gray (B2), and seed irradiated with gamma ray of 300 gray (B3). The second factor was planting distance, consisted of four levels, namely distance of 25 x 25 (J1), distance of 30 x 30 (J2), legowo system of 2 : 1 (J3), and legowo system of 4 : 1 (J4). The results showed that jajar legowo system with planting distance of 2 : 1 significantly affected the nutrient content of nitrogen in shoot, nitrogen uptake of plant, and yield per hectare. Paddy var. Rojolele irradiated by 300 gray produced higher nitrogen content in shoot, nitrogen uptake of plant, and yield per hectare than those in control seeds and seeds irradiated with 200 gray. There was a tendency that planting distance with jajar legowo system resulted in higher grain (yield), on the contrary, the narrow row spacing impacted on lower grain (yield).
Received: 20
thDecember 2016 ; Revised: 20
thApril 2017 ; Accepted: 28
thAugust 2017
INTRODUCTION
Rice is a strategic commodity for Indonesia. As a staple food for most people in Indonesia, rice is also a staple crop for most farmers and has historically been a part of Indonesian culture. Therefore, most leaders in Indonesia use rice production as benchmarks to measure their success in governing. Thereby, people interpret food self-sufficiency as rice self-sufficiency.
Rice production during 2010-2014 increased on average by 1.63% year-1. The rate of rice production
was triggered by the increase in harvested area of 540 thousand ha and productivity of 1.20 kwintal ha-1.
The growth of rice harvested area in Java was only about 0.20% year-1, while it was approximately
1.76% year-1in other island. Similarly, the increasing
of rice productivity in Java was about 0.08% year-1,
while in those other island was about 1.45% year-1
(Kementerian Pertanian Republik Indonesia, 2015). Considering the level of rice demand which is likely to increase with the increase of population, the government has conducted two development strategies.
The first strategy is intensification of the existing rice field through technology improvement, the application of new rice varieties, the integration of resource management, as well as more intensive strategy to utilise all inputs, including fertilizers. The main purpose of intensification is to increase planting index and productivity per hectare. The second strategy is extension of new land through rice field establishment which is generally found outside Java Island.
Nitrogen (N) is the most important nutrient. The crop needs N higher than any other nutrient. Besides, N is the limiting factor for crop productivity, as N deficiency will cause nonoptimal growth in plants, while excessive N will inhibit plant growth and pollute the environment (Duan et al., 2007). The efficiency of N fertiliser used in the rice field can be maximised by planting varieties which are responsive to N application and improving cultivation techniques which includes the setting of plant density, proper irrigation and appropriate application of N fertiliser regarding the dose, technique, and application. Time setting of plant distance can be
Keywords: Jajar Legowo, Nitrogen Uptake, Paddy Var.Rojolele, Planting Distance
Ilmu Pertanian (Agricultural Science)
Vol. 2 No. 2 August, 2017 : 070-078
carried out through planting distance (Hatta, 2011). Proper planting distance impacts on the distribution of nutrient substances, uniform distribution of sunlight, the number of optimal and productive tillers, an even fruit set and fruit ripening, preventing lodging, reducing the growth of weeds, pests, and diseases, efficient in the use of seed and creating optimal number of panicle with uniform length.
Department of Agriculture of Klaten District cooperated with the National Nuclear Atomic Energy Agency of Indonesia (BATAN) to produce high quality rice seeds through radiation for genetic modification. Until now, the duration from planting season to harvest has already been shortened from five months to three and a half month. Public demand for rice var. Rojolele is increasing. There is scarcity of this rice production due to the obstacles in the cultivation of this local rice originating from Delanggu, Klaten. These constraints include the long lifespan of the plant which is approximately 155 days. The plant height which can reach 146-155 cm makes this plant prones to fall over. Thus, the Government of Klaten District makes an effort to increase the local rice production by utilising gamma rays irradiation technology to create new superior varieties. Gamma ray irradiation on rice seed is expected to improve the less desirable properties of this paddy that is its height, thus the new created varieties is not prone to fall over. This research purpose was to investigate the effect of planting distance system to plant height, nitrogen content and nitrogen uptake, and productivity of paddy var. Rojolele irradiated with gamma rays radiation.
The study was done in paddy field area in Glagahwangi, Polanharjo, Klaten district. The soil was classified as Inceptisol, a moderate degree of soil development and lack significant clay accumulation in the soil. They occurred over a wide range of parent materials and climatic conditions, and thus had a wide range of characteristic (Soil Science Society of America, 2016).
The experiment had been carried out during May to October 2014. A preliminary field survey was conducted in May to understand the field condition. The experiment was arranged in a randomized complete block design (RCBD), with dose of gamma rays radiation and planting distance as the factors. There were twelve plot treatments with 4 x 3 m2size
and three replications. Soil samples were collected for original chemical properties analysis. The materials used in this study were paddy var. Rojolele, organic fertilizer with a dose of 700 kg ha-1, Urea of
114 kg.ha-1, and NPK compound of 227 kg.ha-1. One
week before planting time, organic fertiliser of 0.8 kg was added for each plot in all treatments. The dose of gamma rays radiation used for this experiment were 0 dose (control), 200 Gray, and 300 Gray. Planting distance treatment consisted of 25 x 25 cm2,
30 x 30 cm2, jajar legowo 2 : 1, and jajar legowo 4 :
1. Jajar legowo planting system was a transplanting system of rice by creating empty row between 2-4 rows of rice plants, while plant spacing within rows was half of the normal spacing.
Application of fertilizer was done in several stages: 700 kg.ha-1of organic fertilizer was applied
before planting; 114 kg.ha-1Urea was given in several
stages: half dose (7 days after planting), 1/4 dose (21 days after planting), and 1/4 dose (35 days after planting); and 227 kg ha-1NPK fertiliser was given
in several stages: 1/2 dose (7 days after planting) and 1/2 dose (21 days after planting). The treatments details were stated below: B0J1 = Control + planting distance 25 x 25 cm; B0J2 = Control + planting distance 30 x 30 cm; B0J3 = Control + planting distance with
jajar legowosystem 2 : 1; B0J4 = Control + planting distance with jajar legowo system 4 : 1; B2J1 = 200 gray + planting distance 25 x 25 cm; B2J2 = 200 gray + planting distance 30 x 30 cm; B2J3 = 200 gray + planting distance with jajar legowosystem 2 : 1; B2J4 = 200 gray + planting distance with jajar legowosystem 4 : 1; B3J1 = 300 gray + planting distance 25 x 25 cm; B3J2 = 300 gray + planting distance 30 x 30 cm; B3J3 = 300 gray + planting distance with
jajar legowosystem 2 : 1; B3J4 = 300 gray + planting distance with jajar legowosystem 4 : 1.
Plant and soil sampling
Plant growth was assessed by measuring the height of three plant from each plot, from the ground level to the tip of the largest leaf stretched, and was measured on 21 DAT (days after planting), vegetatif maximum stage, and harvest stage. These samples were air-dried and then oven dried at 80°C for 48 hour to chopped into pieces, was dried and ground into fine powder, and was used for chemical analysis. Grains harvested from each plot area were dried and weighed and expressed as kg ha-1. Analysis of variance
was used to test the significance (α <0.05) of treatments effects.
Plant tissue and soil chemical analysis
Organic nitrogen of plant tissue was oxidized in acid condition and mixed with (NH4)2SO4, followed
by distillation process with adding NaOH solution and titration of the excessive ammonia in the receiving solution by 0.01 H2SO4. Ammonium ion content was
determined as the total nitrogen/nitrogen content in plant tissue (Balittanah, 2009). Nitrogen uptake was calculated by the following equation = Plant dry weight (g) x percentage (%) nitrogen content on plant tissue. Soil pH was measured both in water and 1 N KCl suspension in a 1 : 2.5 soil solution ratio for air-dried sample by the glass electrode method (Balittanah, 2009). Carbon organic was measured with Walkley and Black titration method: oxidation of organic matter by potassium dichromate (K2Cr2O7)-sulfuric acid mixture followed by back
titration of the excessive dichromate by ferrous ammonium sulfate (Fe(NH4)2(SO4)2.6H2O) (Balit
tanah, 2009). Total N was measured with Kjeldahl method: soil samples boiled in 0.01 N H2SO4solution
to obtain ammonium sulfate solution, followed by distillation process which is adding excess base to the acid digestion mixture to convert NH4+to NH3
followed by boiling and condensation of the NH3
gas in receiving solution and titration of the excessive ammonia in the receiving soltion by 0.01 HCl (Balittanah, 2009). Total P was extracted using Bray No. 1 solution as extractant. The extracted phosporus was measured colourimetrically, based on the reaction with (NH4)6Mo7O24.4H2O and the
development of “molybdenum blue” colour. The absorbance of the compound was measured at 882 nm in a spectrophotometer (Balittanah, 2009). Exchangeable Kalium cation was extracted with NH4Ac at pH 7, followed by reciprocal shaking and
filtration. The cation in the extract was measured by flamephotometer (Balittanah, 2009). Then, the pellet
was washed with 96% ethanol to remove the excess salt. The ammonium was extracted with 10% NaCl solution. The ammonium ion content was determined as cation exchange capacity (CEC) by distillation process with Kjeldahl method (Balittanah, 2009).
Statistical analysis
Plant growth and soil chemical data were statistically analysed for correlation to detect any significant relationship among them with α = 0.05. If the result of analysis of variance showed significant differences among treatments, then the Duncan Multiple Range Test would be performed. All statistical test were performed with SAS 9.1.3 version for windows.
RESULTS AND DISCUSSION
Soil chemical characteristics
The original soil chemical analysis was conducted to determine the level of fertility of the soil before experiment. The results were assessed based on the guidelines of ISRI and described below:
Chemical properties of experiment soil were shown in Table 1. It showed that the actual level of soil acidity was 5.6 and categorized as slightly acid. Soil organic carbon was low, amounted to 1.84%, and the value of soil organic matter was 3.18%. Total nitrogen was low, 0.16%. Carbon/nitrogen (C/N) ratio was 11.5 and categorized as moderate level. Available phosphorus was very low, which was 2.29 mg kg-1. Exchangeable potassium was very low,
i.e. 0.43 cmolc kg-1. Soil cation exchange capacity
scored high, i.e. 27.78 cmolc kg-1.
Plant growth and chemical properties
The plant height was observed to understand the growth of paddy. Three crucial growth stages were selected to observe the pattern of plant height among treatments (Figure 1).
Plant height ranged from 140.56 to 156.94 cm
Table 1.Chemical properties of the soil of the experiment field
Remarks: * Score was based on Balittanah (2009), w/w = weight per weight.
Type of Analysis Unit Value Score
pH H2O - 5.6 Slightly acid
pH KCl - 4.4
-Organic carbon % (w/w) 1.8 Low
Organic matter % (w/w) 3.2
-Nitrogen % (w/w) 0.16 Low
Phosphorus mg kg-1 2 Very low
Potassium cmolc kg-1 0.43 Very low
Cation Exchange Capacity cmolc kg-1 28 High
(mean 47.92 cm). The highest plant height recorded in control (B0) and gamma ray radiation 300 gray (B3) with jajar legowo2:1 planting system while at 200 gray (B2) recorded at 25x25 cm planting distance system.
Gamma ray radiation effect on plant height The variety doses of gamma rays radiation were irradiated to paddy var. Rojolele to understand its
effect on plant height.
Plant height ranged from 140.6 to 156.9 cm (mean 147.9 cm) and increased by the increasing of gamma ray radiation (Figure 2). The highest plant height was 149.8 cm in gamma radiation 300 gray treatment, but there was no significant difference found with other treatments.
Nitrogen content in plant
Figure 1.Plant growth at various growth stage.
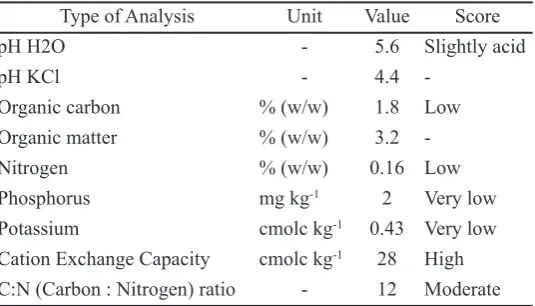
Nitrogen concentration in plant was observed to understand the effectiveness of plant to absorb nutrients. There was no interaction found between tested factors to improved nitrogen concentration in plant (Table 2).
Nitrogen content in plant shoot was ranged from 0.13 to 0.25% (mean 0.18%). This value tended to be higher in jajar legowo2:1 planting distance system. The highest value was 0.22% and the lowest was 0.15%. Planting distance and gamma ray radiation treatment did not affect nitrogen content in plant.
Nitrogen uptake by plants
There was interaction between the tested factors in the improvement of nitrogen absorption by plant. The details were described on Table 3.
Nitrogen uptake by plant was ranged from 11.15 to 24.14 g plant-1(mean 16.76 g plant-1). Gamma ray
radiation 300 gray with jajar legowo 2:1 planting distance system (B2J3) provided the highest nitrogen uptake by plant (24.14 g plant-1), while the lowest
was found in control seed with 25 x 25 cm (B0J1) planting distance (11.15 g plant-1). Gamma ray radiation
and planting distance system gave significant effect for nitrogen uptake by plant.
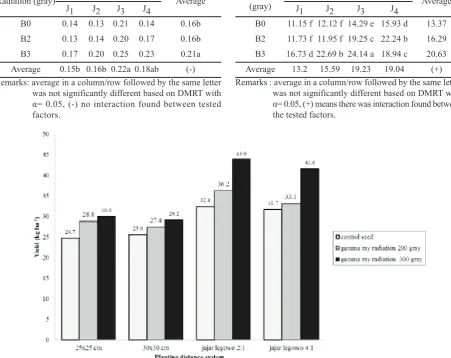
Grain yields
The grain yields ranged from 24.7 to 43.9 kg ha-1
(Figure 3). There was a tendency that gamma ray radiation 300 gray with jajar legowo 2 : 1 planting distance system produced higher grain production. The highest yields recorded was 43.9 kg ha-1and the lowest was 24.7
kg ha-1in 25 x 25 cm planting distance system.
Soil chemical properties
The investigated soils were ‘non calcic brown soils’, according to Thorp et al. (1949). These corresponded to the Inceptisols of the USDA Soil Taxonomy (1994). Inceptisols, as contrasted to many other soil orders, included soils from a wide range of environments. These were found from the arctic to tropics. However, the central concept of Inceptisols included soils from ustic and udic regions which had altered horizons, resulting from translocation of loss of iron, aluminum, or bases (Aydinalp et al., 2003).
Remarks: average in a column/row followed by the same letter was not significantly different based on DMRT with α= 0.05, (-) no interaction found between tested factors.
Table 2.Nitrogen content (%) in plant’s shoot
Radiation (gray) Planting distance (cm) Average
J1 J2 J3 J4
B0 0.14 0.13 0.21 0.14 0.16b
B2 0.13 0.14 0.20 0.17 0.16b
B3 0.17 0.20 0.25 0.23 0.21a
Average 0.15b 0.16b 0.22a 0.18ab (-)
Table 3.Nitrogen uptake (g plant-1) by plant’s shoot
Remarks : average in a column/row followed by the same letter was not significantly different based on DMRT with α= 0.05, (+) means there was interaction found between the tested factors.
Radiation (gray)
Planting distance (cm)
Average
J1 J2 J3 J4
B0 11.15 f 12.12 f 14.29 e 15.93 d 13.37
B2 11.73 f 11.95 f 19.25 c 22.24 b 16.29
B3 16.73 d 22.69 b 24.14 a 18.94 c 20.63
Average 13.2 15.59 19.23 19.04 (+)
Soil pH referred to a soil’s acidity or alkalinity and was the measure of hydrogen ion (H+) in the soil.
A high amount of H+ corresponded to a low pH
value, and vice versa. The pH scale ranged from approximately 0 to 14; 7 being neutral, below 7 was acidic, and above 7 was alkaline (basic). Soil pH (H2O) values for these soil samples ranged from
5.6 to 5.6, with an average of 5.6. On average, KCl pH values were 1.13 units lower than those in H2O,
indicating a net negative charge for all horizons (Ping et al., 1988). Soil pH increases substantially during the first 3 weeks after submergences (Yoshida, 1981), it tended to become 6.5 to 6.7 (Ponnamperuma, 1965) caused by the change of Fe3+to Fe2+, accumulation
of ammonium, change of sulfate to sulfite, and change of CO2into methane (Ponnamperuma, 1976).
Most chemical interactions in the soil occurred on colloid sufaces because of their changed surfaces. Due to their chemical make-up and large surface area, colloids which were able to sorb ions within soil solutions. Depending on the ion’s charge, size and concentration in the soil, it could be sorbed and held to the colloid surface or exchanged with other ions and released to the soil solution. The soil’s ability to sorb and exchange ions was defined as exchange capacity’. The CEC values ranged between 25 to 30 cmolc kg-1with an average of 28 cmolc kg-1.
Soil texture was sandy clay loam, grouped into fine-textured soils which usually had a greater cation exchange capacity than course soils because of higher proportion of colloids (McCauley et al., 2005). Soil pH also affected CEC by altering the surface charge of colloids. A higher concentration of H+
(lower pH) will neutralise the negative charge on colloids, thereby decreasing CEC and vice versa.
Soil organic carbon from the site was relatively low, ranged from 1.8 to 1.9 %, thus organic materials in the form of organic fertiliser was added to the rice field before treatment. This effort was made to meet the energy source for soil microorganisms which would serve in the decomposition process of soil organic matter into simpler compounds, thus would be available to be absorbed by plants. While soil organic matter was primarily carbon, it also contained nutrients essential for plant growth, such as nitrogen, phosphorus, sulphur, and micronutrients. Organism in the soil food web docomposed soil organic matter and make these nutrients available (Brussard et al., 2007).
Soil total nitrogen was low, ranged from 0.14 to 0.17 % with an average 0.16 %. Therefore, the addition of nitrogen through fertilisation was needed to support
the plant growth. Low content of nitrogen was caused by the lost from the field through three principal pathways: denitrification, leaching, and surface volatilisation. Denitrification occurred when nitrate N (NO3-) was present in the soil and not
enough oxygen was present to supply the needs of the bacteria and microorganism in the soil (Vitosh et al., 2005). This usually happened in flooded soil, such as paddy field. If oxygen levels were low, microorganism stripped oxygen from nitrate, producing N gas (N2) or nitrous oxide (N2O) which volatilised
from the soil. Leaching losses of N occurred when soils had more incoming water (rain or irrigation) than soil capacity to hold.
Carbon to Nitrogen ratio ranged from 11 to 12 with an average of 12. It was a ratio of the mass of carbon to the mass of nitrogen in a substance. This ratio was an important factor in determining how easily bacteria were able to decompose an organic material. The microorganism used carbon for energy and nitrogen for protein synthesis. C : N ratio in the soil could have significant effect on crop residue decomposition, particularly residue cover on the soil and crop nutrient cycling predominantly nitrogen. Soil microorganism had a C : N ratio near 8 : 1, they must acquired enough carbon and nitrogen to maintain that C : N ratio in their bodies (Anonim, 2011).
Soil phosporus content was very low, ranged from 2.01 to 2.49 with an average of 2.29 mg kg-1.
Thus, the addition of nutrient phosphorus in the form of NPK fertiliser and organic fertiliser was required. The primary role of P in plants was storage and transfer of energy produced by photosynthesis for growth and reproductive processes. Even tough plant assimilates inorganic P, organic P was an important source of inorganic P in most soils. This organic pool was affected by weathering and soil age, parent geochemistry, management practices and cultivation, and organic matter dynamics (Walker and Syers 1976; Tiessen et al. 1983; Stewart and Tiessen 1987). Organic P was potentially available to plants or microbes, or soil sorption sites after mineralisation.
Soil potassium level was very low, ranged from 0.39 to 0.50 cmolc.kg-1 with an average of 0.43
cmolc.kg-1. This was because potassium was a
on the surface of soil particles and potassium on the surface of soil particles and potassium dissolved in the soil water. Large quantities of potassium were removed with harvestest, such as alfalfa, certain vegetables, other forages, and corn silage.
Plant growth, chemical properties, and grain yield
The growth of plant reflected the nutrients availability in soil solution. Plant height was related to the productivity and growth rate of a plant. Plants tended to grow to a certain height in each of its growth state (Sritarapipat et al., 2014). However, plants dropped growth rate when plants had diseases or lacked in water, which resulted in lower yield rates. In rice crops, more tillers would generally mean more yield (Li et al., 2003). If the condition was growing well, the height of paddy rice crops usually reaches 80-120 cm (Makarim and Suhartatik, 2009). Gamma ray radiation 200 gray with planting distance 25 x 25 resulted in the highest plant height, which was 156.95 cm. But this result was not significantly different from other treatments.
Gamma rays was a part of electromagnetic spectrum belonged to ionizing radiation can be energetically charged particles, such as electrons, or high-energy photons. The biological effect of gamma rays was based on the interaction with atoms or molecules in the cell, particularly with water to produce free radicals in cells. These radicals could damage or modify important components of plant cells and had been reported to affect differentially the morphology, anatomy, biochemistry, and physiology of plants, depending on the irradiation level (Wi et al., 2007; Kovacs et al., 2002). These effects included changes in the plant cellular structure and metabolism, e.g. dilation of thylakoid membranes, alteration in photosynthesis, modulation of the antioxidative system, and accumulation of phenolic compounds (Minisi et al., 2013). The experiment resulted that gamma ray did not have significant impact on plant height. The tallest plant was observed in high doses of gamma rays (300 gray) compared with control and low doses, but it was not greatly significant. By increasing radiation dose up to 0, 200, and 300 gray, plant height could be increased.
Leaf nitrogen concentration was one of the most important plant N variables which determined the photosynthetic C fixation and plant productivity (Yuan et al., 2005). High nitrogen concentration in leaf indicated that plant absorbed nutrient effectively.
The results showed that leaf nitrogen concentration was significantly different among the planting distance or gamma ray radiation treatments, but was not significantly different between treatment combination. Jajar legowo2:1 system resulted in the highest leaf N concentration (0.22%) and the lowest was found at 25 x 25 cm planting distance system ( 0.13%). According to Sohel et al. (2009), the optimum distance would provide growth in the upper part of the plant, thus it could utilise more sunlight. Moreover, it would improve root development, so it would effectively absorb nutrients. Narrow planting distance would result in great competition between plants in terms of sunlight, water, and nutrients. Consequently, there would be stunted growth and low crop yield
Nitrogen uptake by plants ranged from 11.15 to 24.14 g plant-1with an average of 16.76 g plant-1and
jajar legowo2 : 1 planting distance resulted in the highest nitrogen uptake. Nitrogen availability in the soil determined the amount of nitrogen which could be absorbed by plants. Ogbodo et al. (2010) reported that wider feeding area provided opportunity for greater root growth, increased availability of nutrients, and greater accessibility of nutrients to plant. This was because plants grown with wider spacing had more area to draw the nutrition and compensate for the low nutrient level in the soil. The plants were also moer exposed to solar radiation which encouraged superior photosynthetic process. This situation definitely increased plants uptake of nutrients and growth. Moreover, the amount of nitrogen absorbed by plants was affected by dry weight matter of plant and nitrogen concentration in the plant tissue. According to Syekhfani (1997), nitrogen played an important component in the preparation of plant organs, as the elements involved in the process of photosynthesis, element of plant cell life, and also the constituent of chlorophyll and other important organic compounds.
Grain yield of plants showed no significant difference among treatments with significant level α= 0.05. The result range from 24.7 to 43.9 kg ha-1with an average of 32.1 kg ha-1. The highest
grain yield was shown in jajar legowo of 2:1 system, and the lowest was found in 25 x 25 cm planting distance. There was a tendency that jajar legowo
to produce greater results.
The number of panicles and full grain, the total weight of dry grain and the weight of 1000 dry grains in jajar legowo system were expected due to an increase in photosynthetic activity in the two rows of paddy plant alongside the rice field caused by emptying one row in every four rows. This was in accordance with the opinion of Erythrina et al. (2014) which stated that in principle, the use of legowo system was aimed to gain the border effect and to increase the plant population as well. Ogbodo
et al. (2010) reported that the more vigorous plants, with particularly higher tillering ability produced more photosynthate than the less vigorous plants of the closer spacing. Wider spaced plants were more effective in mobilising photosynthate and in grain filling, compared with the closely spaced plants. Yoshida (1981) showed that grain filling process involved remobilisation from stored reserves, and also from current photosynthesis. Plant with wider spacing might also have produced higher number of productive tillers, which might lead to superior grain yield. These results corroborated the report from Romasany and Babu (1997), which showed more productive tillers due to the reduce in plant density, and also increased filled grains per panicle with reduced plant density. Baloch et al. (2003) also reported that increased planting distance considerably resulted in vigorous plant growth and caused a significant increase in number of panicles per hill, grain yield per hill, filled grains per panicle and 1000 grain weight.
CONCLUSION
The effects of planting distance system on nitrogen concentration in leaf, nitrogen uptake by plants, and grain yield per hectare were varied, depended on the rice seeds. Paddy var. Rojolele irradiated with gamma ray radiation 300 gray in jajar legowo2:1 system significantly affected by increasing nitrogen uptake and grain yield per hectare. There was no significant interaction between the planting distance and gamma ray radiation treatment and the level of nitrogen concentration in leaf. Effect of planting distance system on potential yield per hectare was consistent on all varieties. Jajar legowo
2:1 system provided higher grain yield per hectare than other treatments.
ACKNOWLEDGMENT
I thank to Department of Agriculture of Klaten District, National Nuclear Atomic Energy Agency of Indonesia (BATAN) for funding this research. We
are deeply indebted to member of Laboratory of Soil Science, Universitas Gadjah Mada for their help during field and laboratory works.
REFERENCES
Anonim. 2011. Carbon to Nitrogen Ratios in Cropping Systems. [online] Available at: www.nrcs. usda.gov. [Accessed on 9 December 2016]. Aydinalp, C., and A. F. Ewart. 2003. Genesis And
Classification Inceptisols Formed On The Slate Paren Material Under Forest Vegetation.
Journal of Central European Agriculture,(4) 4: 281-288.
Balittanah. 2009. Analisis Kimia Tanah, Tanaman, Air, dan Pupuk. Bogor: Balai Penelitian Tanah.
Baloch, A. W., A. M. Soomro, M. A. Javed, M. Ahmed, H. R. Bughio,M. S. Bughio, and N. N. Mastol. 2003. Optimum Plant Density For High Yield In Rice Oryza sativa L. Asian Journal of Plant Sciences,1(1): 25-27. Brussaard, L., P. C. Ruiter, and G. G. Brown. 2007.
Soil Biodiversity For Agricultural Sustainability.
Agriculture, Ecosystems & Environment, 121: 233-244.
Duan, Y. H., Y. L. Zhang, L. Y. Ye, .X. R. Fan, G. H. Xu, and Q. R. Shen. 2007. Responses Of Rice Cultivars With Different Nitrogen Use Efficiency To Partial Nitrate Nutrition. Ann Bot, 99: 1153–1160.
Erythrina, and Z. Zulkifli. 2014. Rice Cultivation With Double Row Planting System: Review Of Methodology To Obtain Optimal Yield. Jurnal Litbang Pertanian, 33(2): 79-86.
Foth, H. D. and B. G. Ellis. 1988. Soil Fertility. New York: John Wiley & Sons.
Hatta, M. 2011. Pengaruh Tipe Jarak Tanam Terhadap Anakan, Komponen Hasil, Dan Hasil Dua Varietas Padi Pada Metode SRI. Jurnal Floratek,6(2): 104–113.
Hatta, M. 2012. Uji Jarak Tanam Sistem Legowo Terhadap Pertumbuhan dan Hasil Beberapa Varietas Padi Pada Metode SRI. Jurnal Agrista, 16(2): 87-93.
Kementrian Pertanian Republik Indonesia. 2015.
Rencana Strategis Kementrian Pertanian Tahun 2015-2019. Jakarta: Biro Perencanaan Sekretariat Jenderal.
Kovacs, A. and A. Keresztes. 2002. Effect Of Gamma And UV-B/C Radiation On Plant Cells. Micron,33(2): 199-210.
Li, X., Q. Qian, Z. Fu, Y. Wang, G. Xiong, and D. Zeng. 2003. Control Of Tillering In Rice. Nature,
422(6932): 618–621.
Fisiologi Tanaman Padi. Subang: Balai Besar Penelitian Tanaman Padi.
McCauley, A., J. Clain, and J. Jeff. 2005. Soil and Water Management Module I: Basic Soil Properties.USA: Montana State University. Minisi, F. A., M. E. El-mahrouk, M. E. F. Rida, and
M. N. Nasr. (2013). Effects of Gamma Radiation on Germination, Growth Characteristics and Morphological Variations of Moluccella laevis
L. American-Eurasian J. Agric. & Enciron. Sci., 13(5): 696-704.
Ogbodo, E. N., I. I. Ekpe, E. B. Utobo, and E. O. Ogah. 2010. Effect Of Planting Distance and N Rates On The Growth and Yields of Rice at Abakaliki Ebonyi State, Southeast Nigeria.
Research Journal of Agriculture and Biological Science,6(5): 635-658.
Ping, C. L., S. Shoji, and T. Ito. 1988. Properties and Classification Of Three Volcanic Ash-Derived Pedons From Aleutian Islands And Alaska Peninsula, Alaska. Soil Sci. Soc. Am. J.,52: 455–462.
Ponnamperuma, F. N. 1965. Dynamic Aspects of Flooded Soils and The Nutrition of The Rice Plant. Maryland, USA: The Johns Hopkins Press, pp. 295-328.
Ponnamperuma, F. N. 1976. Temperature and The Chemical Kinetics of Flooded Soils. Climate and Rice.Los Baños, Philippines: International Rice Research Institute, pp. 249–263 Romasany, S. and R. Babu. 1997. Effect Of Plant
Density, Number Of Seedings And Nitrogen On The Productivity Of Aged Rice Seedlings.
Oryza, 34(4): 310-313.
Schulte, E. E. and K. A. Kelling. 1999.Understanding Plant Nutrients : Soil and Applied Potassium. USA: Cooperative Extension Publications, University of Wisconsin.
Sohel, M. A. T., M. A. B. Siddique, M. Asaduzzaman, M. N. Alam, and M. M. Karim. 2009. Varietal Performance Of Transplant Aman Rice Under Different Hill Densities. Bangladesh J. Agril. Res.,34(1): 33–39.
Sritarapipat, T., P. Rakwatin, and T. Kasetkasem. 2014. Automatic Rice Crop Height Measurement Using A Field Server And Digital Image Processing.
Sensors,14(1): 900-926.
Stewart, J. W. B., H. and Tiessen. 1987. Dynamics Of Soil Organic Phosphorus. Biogeochemistry,
4: 41-60.
Syekhfani. 1997. Hara Air Tanah dan Tanaman.
Malang: Jurusan Tanah Fakultas Pertanian Universitas Brawijaya.
Thorp, J., and G. D. Smith. 1949. Higher Categories Of Soil Classifications: Order, Suborder, And
Great Soil Group. Soil Science, 67: 117-126. Tiessen, H., J. W. B. Stewart and J. O. Moir. 1983.
Changes In Organic And Inorganic PhosPhorus Composition Of Two Grassland Soils And Their Particle Size Fractions During 60-90 Years Of Cultivation. Journal Of Soil Science, 34: 815-823.
USDA. 1994. Soil Taxonomy: Keys to Soil Taxonomy. 6th Ed., Washington DC: USDA-Natural Resources Conservation Service, pp. 177.
Vitosh, M. L. and J. W. Johnson. 1995. Nitrogen Losses from Soil. In: D. B. Mengel (Co-ed.).
Tri-state Fertilizer Recommendations for Corn, Soybean, Wheat and Alfalfa.Michigan: Extension Bulletin E-2567.
Walker, T. W. and J. K. Syers. 1976. The Fate Of Phosphorus During Pedogenesis. Geoderma
15: 1-19.
Wi, S. G., B. Y. Chung, J. S. Kim, J. H. Kim, M. H. Baek, J. W. Lee, and Y. S. Kim. 2007. Effects Of Gamma Irradiation On Morphological Changes and Biological Responses In Plants.
Micron, 38(6): 553-564.
Yoshida, S. 1981. Fundamentals Of Rice Crop Science. Los Banos, Manila, Philipines: Inter Rice Res. Inst.