Molatudi
et al.
RESEARCH PAPER
OPEN ACCESS
Effect of switchgrass plantation on soil moisture and nitrogen
availability and microbial biomass carbon in a semi-arid
ecosystem
R.L. Molatudi
1,2,4, Y. Steinberger
3, F.Y. Meng
1,4, G.H. Xie
1,4,*1
College of Agronomy and Biotechnology, China Agricultural University, Beijing, P. R. China
2
School of Agricultural and Environmental Sciences, University of Limpopo, Limpopo, South Africa
3
The Mina and Everard Goodman Faculty of Life Sciences, Bar-Ilan University, Ramat-Gan,
Israel
4
National Energy R&D Center for Biomass, China Agricultural University, Beijing, P. R. China
Article published on August 16, 2015
Key words: Panicum virgatum L., Energy plants, Mineral nitrogen
Abstract
The crop canopy was reported to have a strong influence on soil moisture and nutrient availability. The aim of
this study was to determine the effect of switchgrass (Panicum virgatum L.) plantations on soil moisture and the
levels of mineral nitrogen and microbial biomass carbon. Soil samples were collected from six soil layers to a
depth of 90 cm under switchgrass stands established in 2006 (SG2006), 2008 (SG2008), and 2009 (SG2009),
and under native grasses as a control, during 2012 and 2013. Soil moisture was significantly higher (P < 0.05)
under native grasses than under all switchgrass stands. Soil ammonium nitrogen (NH4+-N) levels were
significantly higher under all switchgrass stands than under native grasses. The nitrate nitrogen (NO3- -N)
concentration was significantly lower in soil under native grasses than under all switchgrass stands and averaged
2.74 mg kg-1 for the two seasons. Among all the treatments, the 2009 switchgrass plantation soil had a
significantly lower (P < 0.05) microbial biomass carbon (MBC) (160 mg kg-1 and 121 mg kg-1 in 2012 and 2013,
respectively) during both growing seasons. Ammonium-nitrogen, NO3- -N and MBC were significantly higher in
the upper soil layers than in deeper layers in all treatments studied. Soil moisture was significantly higher in the
deeper layers than in the upper layers, regardless of treatment. These findings confirm that switchgrass
plantations exhibit beneficial impacts on soil fertility in semi-arid regions, through alleviation of NO3--N leaching
and enhancement of soil microbial carbon.
* Corresponding Author: G.H. Xie [email protected]
International Journal of Agronomy and Agricultural Research (IJAAR)
ISSN: 2223-7054 (Print) 2225-3610 (Online)
http://www.innspub.net
Molatudi
et al.
absorbed by plants. Plants could increase soil organic
matter through accumulation of organic residues and
acceleration in soil water-holding capacity (Garcia et
al., 1994) to improve nitrogen availability. Crop
canopy has a strong positive influence on soil
moisture and nutrient availability in many arid and
semi-arid ecosystems (Schade and Hobbie, 2005; Su
et al., 2005). It is established that crop plantations
can significantly influence the spatial distribution of
soil nutrients (Cao et al., 2011).
Due to the concerns regarding negative
environmental consequences and declining energy
supplies of fossil fuels, there has been a worldwide
increase in interest to develop biomass crops which
will be grown in marginal lands for biofuel
production. Switchgrass (Panicum virgatum L.), a
perennial warm-season grass, is one of the sources of
lignocellulose that is currently being considered as
the second generation for production of ethanol
improve soil conservation and increase energy
production compared with row-crop production on
the same land (Vogel, 1996; McLaughlin and Kszos,
2005; Lee et al., 2007). Additional studies on
switchgrass are necessary in order to compare and
evaluate the ecological consequences after energy
cropping on marginal land. Thus the main aim of this
study was to compare the soil moisture, mineral
nitrogen and microbial biomass carbon under
different switchgrass plantations on a sandy waste
land in semi-arid regions of China.
Materials and methods
Study site
A field experiment was set up in a marginal land in
Ganqika (42°58'N, 122°21'E), Inner Mongolia, China.
Switchgrass has been introduced and planted as a
potential energy crop at this site since 2006 (Xiong et
al., 2008). The land was not cultivated and was
populated primarily with short, native grasses prior to
the switchgrass. The soil at the site was classified as a
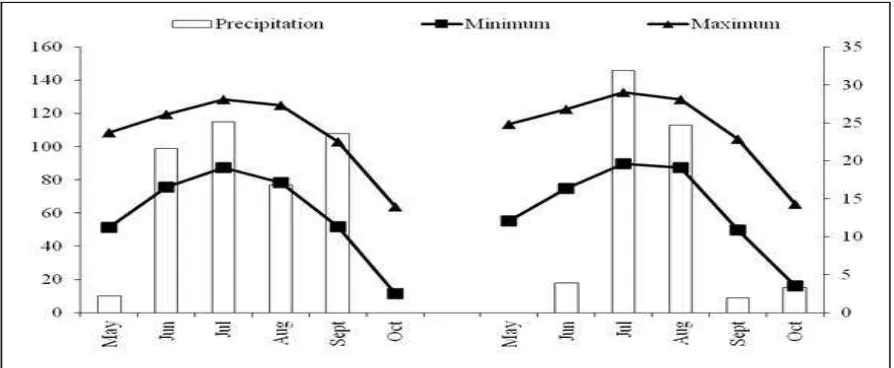
loamy sand. The area has a temperate continental
monsoon-type climate, with an annual average
sunshine period of 2888.9 hours per year and an
average annual temperature of 5.8 C. The annual
mean precipitation is 451 mm, falling mostly between
June and August. The monthly precipitation and
temperature at the study site, as well as the main soil
properties (0–90 cm layer) during the study period,
are presented in Fig. 1 and Table 1.
Experimental design, treatments and crop
cultivation
The study was conducted between May and October
of 2012 and 2013. Switchgrass plant stands were
established at the site in 2006 (SG2006), 2008
(SG2008), and 2009 (SG2009) and were arranged as
treatments, respectively. A plot of native grasses
adjacent to the switchgrass field was set up as a
control. According to local herdsmen, the land of the
native plot had never been changed artificially. Five 6
x 6 m replicates were randomly placed in each of the
switchgrass stands and in the native grass control
site. Amounts of 84 kg N ha-1 as urea, 99 kg P2O5 ha-1
as diammonium phosphate, and 45 kg K2O ha-1 as
potassium sulfate were applied to each switchgrass
plot as topdressing before the plant regrowth in both
years. Amounts of 30 kg N ha-1 and 15 kg N ha-1 as
urea were also applied at 40 and 80 days after
Molatudi
et al.
In the control plot, native perennial rhizomatous
grasses constituted the most dominant population
(i.e., 96% of the total plant population) according to
our field survey on October 4, 2013. Chinese leymus
(Leymus chinensis (Trin.) Tzvel.) was the most
dominant perennial grass species and accounted for
78% of stems and plants. The other grasses included
perennial Chee reedgrass (Calamagrostis epigejos
(L.) Roth.), small reed (Deyeuxia angusitifolia
(Kom.) Y. L. Chang) and annual green bristle grass
(Setaria viridis (L.) Beauv.). Non-grass plants,
including perennial capillary wormwood herb
(Artemisia capillaris Thunb) and argy wormwood
(Artemisia argyi Lévl. &Vant.), were also found in the
plot. The native plot exhibited an aboveground
switchgrass emergence and at 40-day intervals until
harvesting. In each of the five plots, soil subsamples
were collected from five randomly selected points,
mixed thoroughly, composited, stored in insulated
plastic bags and transferred to a temperature of 4 C.
The soil samples were collected from a 0–90 cm
depth and divided into six units according to the
following soil layers: 0–15, 15–30, 30–45, 45–60,
60–75 and 75–90 cm. Each composited soil sample
was divided into two parts. One part of each sample
was used to determine the soil moisture, and content
of ammonium nitrogen (NH4+-N), nitrate nitrogen
(NO3--N), and microbial biomass carbon (MBC). Soil
microbial biomass carbon was determined from the
0–45 cm layers. The second part of each sample was
air-dried at room temperature, hand ground to a fine
powder and passed through a 0.25-mm sieve. Ground
samples were used for pH, electric conductivity (EC),
and soil texture determination.
Soil chemical analysis
The pH and EC of the soil samples were determined
in a soil slurry made by using a 1:1 soil/water ratio
(B-212 Twin Compact pH meter-HORIBA) and a 1:5
soil/water ratio (Conductivity Meter DDS-307) for pH
and EC, respectively. The soil moisture content in
each sample was measured gravimetrically at 105 C
to a constant weight and was expressed as a
percentage on an oven-dried basis. The NO3--N
content was determined as previously described by
Norman et al. (1985) by utilizing the dual-wavelength
spectrophotometer method and the NH4+-N content
was determined using a 2 mol/L KCl extraction
indophenols blue colorimetric method (Keeney and
Nelson, 1982).
Soil microbial biomass carbon was measured by a
fumigation-extraction procedure described by Vance
et al. (1987), where one portion of composited field
moist samples was fumigated by exposing the soil to
alcohol-free CHCL3 vapor for 24 h in vacuum
desiccators (Jenkinson andPowlson, 1976). After the
CHCL3 was removed by vacuum extraction, the
fumigated portion was extracted with 0.15 mol l-1
K2SO4 by shaking for 30 min (25 C; 200 r/min), and
the suspension was filtered using Whatman No. 2
filter paper (Pandey et al., 2009; Pandey and Begum,
2010). Another portion of unfumigated soil was
extracted with K2SO4 by a procedure similar to that
performed for the fumigated portion. Organic carbon
in the extracts was analyzed using the
digestion-titration method. Specifically, after transferring 5 ml
of the extract to a test tube, 5 ml of 0.1018 mol l-1
K2Cr207 and 5 ml of concentrated H2SO4 were added.
The samples were digested for 10 min at 175 C and
titrated using 0.105 mol l-1 FeSO4 with the
phenanthroline indicator. All analyses were carried
out in duplicate. Microbial biomass carbon was
estimated from the following equation:
MBC = 2.64Ec
Where Ec is the difference between estimates from
fumigated and unfumigated soils, both expressed as
mg/kg on an oven-dried basis; and 2.64 is the
proportionality factor of MBC released by the
Molatudi
et al.
Data analysis
Analysis of variance (ANOVA) was conducted using
the General Linear Model procedure of the SPSS 20.0
analytical software package (IBM SPSS Inc., Chicago,
IL, US). The difference between the means exhibiting
significant differences were separated using the Least
Significance Difference (LSD) test at a P < 0.05 level.
Results
Soil moisture
Significant differences in soil moisture, NH4+-N,
NO3--N, and MBC were found between samples
collected under switchgrass and native grass during
the 2012 and 2013 growing seasons (Fig. 2). Soil
moisture levels of 9.8 and 10.4% were recorded in
2012 and 2013, respectively, and were significantly
higher (P < 0.05) under native grass than under all
switchgrass plantations. Soil moisture under
switchgrass planted in 2008 was significantly higher
(P < 0.05) than under all other switchgrass
plantations in both seasons. Soil under switchgrass
planted in 2009 had the lowest soil moisture (P <
0.05) during the two seasons, with 4.6 and 6.4% in
2012 and 2013, respectively.
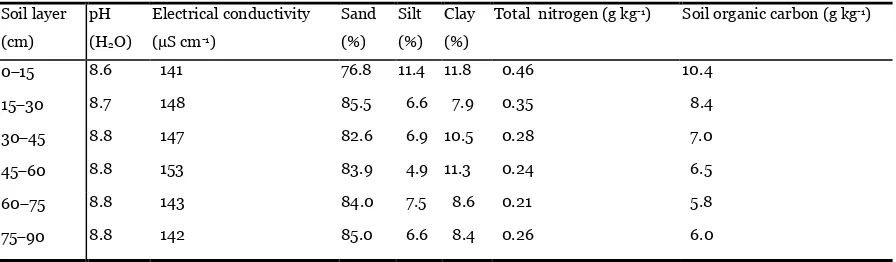
Table 1. Main soil chemical and physical properties of different layers at a depth of 90 cm at the study site during
the growing season.
Soil texture was classified as follows: sand between 0.011.0 mm, silt between 0.0020.05 mm, and clay less than
0.002 mm (Gee and Bauder, 1986).
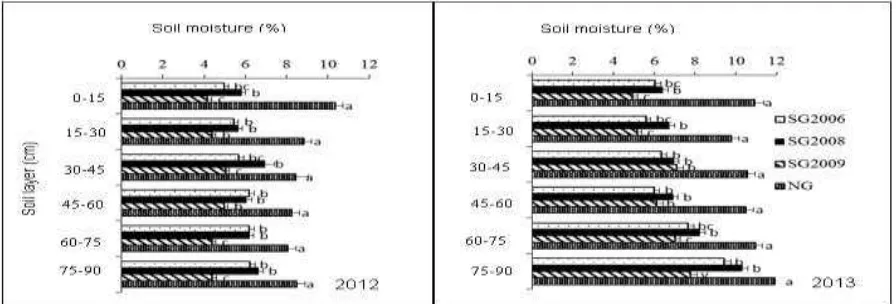
Overall, soil moisture was significantly higher (P <
0.05) under native grass than under the switchgrass
plantations. Moreover, soil moisture was significantly
higher (P < 0.05) in the deeper soil layers compared
to the upper soil layer during the 2012 and 2013
growing seasons, irrespective of switchgrass
plantation age (Fig. 3).
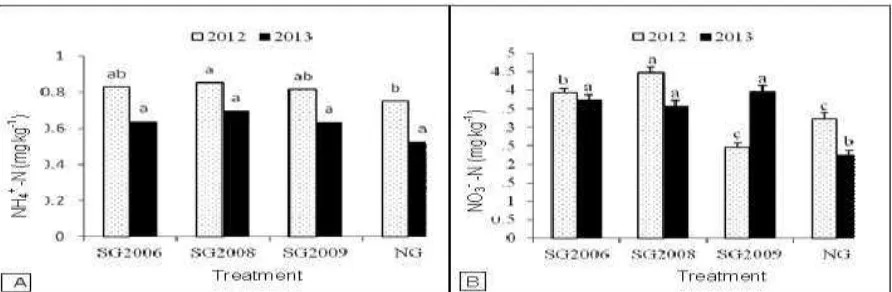
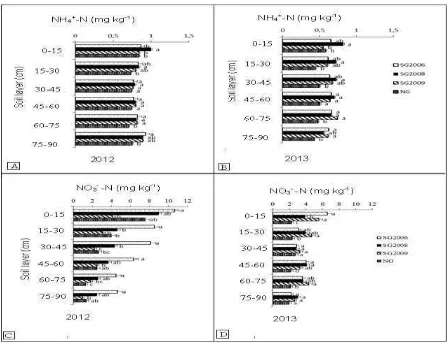
Ammonium nitrogen and nitrate nitrogen content
No significant differences in NH4+-N content were
found under all switchgrass plantations during both
growing seasons (Fig. 4A). In 2012, the soil under
native grass exhibited the lowest NH4+-N content, but
it was only significantly lower than under the 2008
plantation. Nitrate nitrogen levels (4.5 mg kg-1) were
significantly higher (P < 0.05) under the 2008
switchgrass plantations than under all other
treatments in the 2012 growing season. There were no
significant differences in NO3--N levels between
switchgrass plantations in the 2013 growing season.
Significantly lower (P < 0.05) NO3--N levels were
measured under native grass in the two seasons, with
3.2 mg kg-1 and 2.3 mg kg-1 in 2012 and 2013,
respectively (Fig. 4B). However, there was no
significant difference between soil NO3--N levels
under switchgrass planted in 2009 and soil under
native grass in the 2012 season.
Soil NH4+-N concentrations were not impacted by
switchgrass plantations at all soil depths investigated
in this study during the 2012 growing season.
Ammonium nitrogen values under native grass were
significantly lower (P < 0.05) compared to that in soil
under switchgrass plantations at all soil depths during
the 2012 and 2013 growing seasons (Figs. 5A, 5B).
However, there were no significant differences in soil
ammonium nitrogen values between all treatments at
Molatudi
et al.
There were significant differences in soil NO3--N
concentration in all treatments (Figs. 5C, 5D). Nitrate
nitrogen levels were significantly higher (P < 0.05)
under the 2006 switchgrass plantations at all soil
depths than those in soil subjected to all other
treatments in the 2012 growing season. There were no
significant differences in NO3--N concentrations
between SG2008 and SG2009 at all soil depths
during the 2012 growing season. However, an
exception was found in the 30–45 cm soil depth
samples, where the NO3--N concentration in SG2008
was significantly higher than that in SG2009. The soil
under native grass exhibited significantly lower values
of NO3--N than all other treatments during the 2013
growing season.
Fig. 1. Total monthly precipitation and mean monthly temperatures at the study site during the growing seasons.
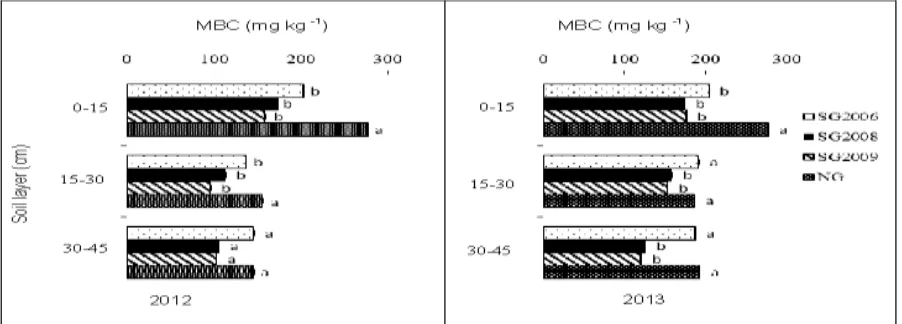
Soil Microbial biomass carbon
Soil MBC followed the same trend as soil moisture,
and was significantly higher (P < 0.05) in soil under
native grass than under all switchgrass plantations
(Fig. 6). Among all the treatments, the soil under the
2009 switchgrass plantation had the lowest MBC (P <
0.05) during bothgrowing seasons, with 160 mg kg-1
and 121 mg kg-1 in 2012 and 2013, respectively.
However, there were no significant differences in
MBC under all switchgrass plantations in the 2012
growing season.
The MBC did not demonstrate any significant
differences under all switchgrass plantations at all soil
depths during the 2012 and 2013 growing seasons
(Fig. 7).
However, a significantly higher (P < 0.05) MBC was measured in soil under native grass at the 0–15 cm
depth than in soil under all switchgrass plantations in
both seasons. Although no significant differences in
MBC were found under all switchgrass plantations at
all soil depths during the 2012 growing season, the 0–
15 cm soil depth showed a slightly higher MBC of 204
mg kg-1, 174 mg kg-1, 176 mg kg-1 than that of the 15–
30 cm soil depth (which exhibited 191 mg kg-1, 158 mg
kg-1, 153 mg kg-1) and the 30–45 cm soil depth (which
demonstrated 187 mg kg-1, 126 mg kg-1, 120 mg kg-1 in
2006, 2008 and 2009 switchgrass plantations,
respectively).
During the 2013 growing season, the 0–15 cm soil
depth samples had a significantly higher MBC than
that of the 15–30 cm and 30–45 cm soil depth
samples under all switchgrass plantations.
The soil under switchgrass planted in 2006 also
exhibited significantly higher MBC (P < 0.05) than
that of the soil under switchgrass planted in 2008 and
2009 at the 30–45 cm soil depth. No significant differences in MBC were found in the soil between
2008 and 2009 under switchgrass plantations at all
Molatudi
et al.
Fig. 2. Dynamics of soil moisture under switchgrass
planted in 2006 (SG2006), 2008 (SG2008) and 2009
(SG2009) and under native grasses (NG) during the 2012 and 2013 growing seasons. The different small
letters above the bars indicate significant differences
at P < 0.05 within each year.
Discussion
Soil moisture content
In the present study, switchgrass stands showed a
significant effect on soil moisture and nutrients,
particularly in the upper soil layers. Soil moisture
under the native grasses was significantly higher than
that under the switchgrass plantations. Soil moisture
decreased with increasing depth in all soil treatments
establishing the depth dependency of soil moisture
dynamics. A higher soil moisture in the deeper than
upper depths may be due to root water uptake (Hupet
and Vanclooster, 2002). No significant differences in
soil moisture were recorded between switchgrass
plantations. However, the moisture content in soil
under switchgrass planted in 2008 was significantly
higher than that in soil under switchgrass planted in
the 2006 and 2009 plantations for both seasons.
Fig. 3. Dynamics of moisture of soil layers at a depth of 90 cm under switchgrass planted in 2006 (SG2006),
2008 (SG2008) and 2009 (SG2009) and under native grasses (NG) during the 2012 and 2013 growing seasons.
The different small letters to the right of the bars indicate significant differences at P < 0.05 within each year.
The moisture content in soil under switchgrass
planted in 2009 was significantly the lowest during
both seasons. The lower soil moisture in these
plantations compared to that in the soil under native
grasses may be due to higher evapotranspiration in
switchgrass plantations (which have a higher leaf
canopy) than in native grasses. The results of this
study are consistent with those reported by Yang et al.
(2012), who found that introduced vegetation usually
consumes more moisture than native grasses.
Furthermore, the significantly lower soil moisture
under the 2009 switchgrass plantation than under the
2006 and 2008 plantations may be due to the low
organic matter in this plantation. Organic matter has
been reported as one of the main factors affecting soil
moisture content (Wang et al., 2013). Hudson (1994)
also reported that organic matter increases the
available water capacity in all soil textural groups. An
increase in switchgrass plantation duration has been
reported to increase the organic matter in the soil
(Schmer et al., 2011).
High organic matter under switchgrass planted in
2006 and 2008 could have led to the higher soil
moisture in these plantations than that in soil of the
Molatudi
et al.
Soil mineral nitrogen content
The NH4+-N and NO3--N levels were higher in soil
under the 2006 switchgrass plantation than that in
soil under the 2008 and 2009 plantations and the
native grasses, regardless of soil depth. Higher NH4+
-N and -NO3--N levels were also observed in the upper
soil depths than in the lower soil depths in all of the
treatments.
Fig. 4. Dynamics of soil ammonium nitrogen (NH4+-N) (A) and nitrate nitrogen (NO3--N) (B) under switchgrass
planted in 2006 (SG2006), 2008 (SG2008) and 2009 (SG2009) and under native grasses (NG) during the 2012
and 2013 growing seasons. The different small letters above the bars indicate significant differences at P < 0.05
within each year.
The higher NH4+-N and NO3--N levels in soil under
switchgrass plantations than in soil under native
grass in the present study could be due to the lower
moisture recorded under switchgrass plantations. The
NH4+-N and NO3--N levels have been reported to be
lower in moist soils than in dry soils (Roberts et al.,
2010). Parker and Schimel (2011) also reported lower
NH4+-N and NO3--N levels in soils with a high
moisture level than in soil with a low moisture
content. Although the NH4+-N and NO3--N levels were
higher in the soils under the switchgrass plantations
than in the soil under native grass, the NO3--N
content represented the dominant form of inorganic
N in all treatments. A similar observation was
reported by Parker and Schimel (2011). Yu et al.
(2008) also reported NO3--N as the dominant form of
inorganic N in soil under Mongolian plantations. The
small amount of NH4+-N in the soil relative to NO3--N
can be explained by the preferential uptake of NH4+
-N, which has also been observed in some grass
species (Atkinson, 1985). Nitrate predominance, as
the mineral N form, may be related to the soil salinity
that was observed in this study, which tends to
encourage nitrification. Nitrogen in plant residues
adds to the organic nitrogen in the soil, which will be
further mineralized into mineral nitrogen by
microorganisms. Switchgrass has been reported to
have a high biomass and organic matter accumulation
with crop plantation duration (Dou et al., 2013). This
could have led to the higher NH4+-N and NO3--N
concentrations in the soil under switchgrass planted
in 2006 than in the soil under the 2008 and 2009
switchgrass plantations.
Soil microbial biomass carbon
The soil microflora and the vegetation of an
ecosystem are closely interrelated. Plants influence
soil biotic processes by delivering organic compounds
(Yadav, 2012). The soil microbial biomass represents
a small but important labile pool of nutrients in soils,
and its activity exerts a key controlling influence on
the rate at which C, N and other nutrients cycle
through ecosystems (Lovell et al., 1995). The soil
microbial biomass is the active component of the
organic pool, which is responsible for organic matter
decomposition thereby affecting the soil nutrient
content (Franzluebbers et al., 1999). It is also used as
an important indicator of soil fertility (Moore et al.,
Molatudi
et al.
Fig. 5. Dynamics of soil ammonium nitrogen (NH4+-N) (A and B) and nitrate nitrogen (NO3--N) (C and D) values
in the 0 to 90 cm-depth in the 2012 and 2013 growing seasons. The different small letters to the right of the bars
indicate significant differences at P < 0.05 within each year.
Fig. 6. Dynamics of soil microbial biomass carbon
(MBC) under switchgrass planted in 2006 (SG2006),
2008 (SG2008) and 2009 (SG2009) and under
native grasses (NG) during the 2012 and 2013
growing seasons. The different small letters above the
bars indicate significant differences at P < 0.05 within
each year.
Soil physicochemical characteristics influence the
microbial biomass and the activity of
microorganisms. Changes in soil moisture, carbon
input from crop roots and crop residues are also
known to have an effect on the soil microbial biomass
and activity (Ross, 1987), which also affect the soil’s
ability to supply nutrients to plants through organic
matter turnover (Bonde and Roswall, 1987; Yu et al.,
2008).
The results from this study indicated a higher MBC in
the soil under native grasses than that in the soil
under switchgrass plantations at the 0–15 cm depth.
Soil under switchgrass planted in 2006 also contained
a higher MBC than soil under the 2008 and 2009
plantations. The higher amount of MBC present in
soil under native grass than under switchgrass
plantations could be due to high moisture and soil
Molatudi
et al.
results of this study are consistent with those of
Diaz-Ravina et al. (1995) and Devi and Yadava (2006) who
demonstrated that a lack of soil moisture limits the
microbial biomass. Griffiths et al. (2003), Tu et al.
(2006) and Zhou et al. (2012) reported that water
availability affects the physiological status of bacteria
and can indirectly regulate substrate availability,
while water stress reduces the microbial biomass and
activity through induced osmotic stress, resource
competition and starvation. Fierer and Schimel
(2002) also confirmed higher microbial activity under
moist conditions in grassland soils. The higher MBC
in the soil under the 2006 switchgrass plantations
than in the soil under the 2008 and 2009 plantations
could be due to its higher organic matter content.
Longer crop plantations have been reported to have
high organic matter input via leaf and root litters and
root exudates over a long period (El Titi, 2003). The
high MBC at the 0–15 cm soil depth in all treatments
is attributed to the improved soil environment and
increased organic and inorganic materials released
from plants, which provide the energy source and
nutrients for microorganisms that largely enter the
soil through the surface, as reported by Cao et al.
(2011).
Fig. 7. Dynamics of soil microbial biomass carbon (MBC) values in the 0 to 45 cm soil layers in the 2012 and
2013 growing seasons. The different small letters to the right of the bars indicate significant differences at P <
0.05 within each year.
Conclusion
There were no significant differences in soil NH4+-N
levels between all treatments analyzed in this study.
However, the upper soil layer contained a slightly
higher NH4+-N concentration than that of the deeper
layers, regardless of the switchgrass plantation.
Nitrate-N was found to be higher in the soil under the
switchgrass plantations than in the soil under native
grasses. The NO3--N concentrations increased with
increasing age of the switchgrass plantation,
irrespective of soil depth and a decrease with
increasing soil depth, irrespective of switchgrass
plantation. Soil microbial biomass carbon and organic
carbon increased in the soil under the switchgrass
plantations, regardless of the soil depth. Soil
microbial biomass carbon and organic carbon
contents were also greater in the surface layer and
decreased with an increase in soil depth, irrespective
of the switchgrass plantation. In summary, our results
confirm that switchgrass plantations have a beneficial
impact on soil fertility in semi-arid land, through
alleviation of NO3--N leaching and enhancement of
soil microbial carbon.
Acknowledgement
This study was financially supported by the National
Natural Science Foundation of China (31470555). The
authors thank Allen McBride and Anthony Turhollow
Jr. from the Oak Ridge National Laboratory (ORNL),
USA, for their comments on the experimental design,
and Aiguo Pang and Zhihui Chen for their assistance
Molatudi
et al.
References
Atkinson C. 1985. Nitrogen acquisition in four
coexisting species from an upland acidic grassland.
Plant Physiology 63, 375–387.
Bonde TA, Roswall T. 1987. Seasonal variation of
potentially mineralizable nitrogen in four cropping
systems. Soil Science Society of American Journal 51,
1508–1541.
Cao C, Jiang SY, Ying Z, Zhang FX, Han XS.
2011. Spatial variability of soil nutrients and
microbiological properties after the establishment of
leguminous shrub Caragana microphylla Lam.
plantation on sand dune in the Horqin sandy land of
Northeast China. Ecological Engineering 37, 1467–
1475.
Devi NB, Yadava PS. 2006. Seasonal dynamics in
soil microbial biomass C, N and P in a mixed-oak
forest ecosystem of Manipur, North-east India.
Applied Soil Ecology 31, 220–227.
Diaz-Ravina M, Acea MJ, Carballas T. 1995:
Seasonal changes in microbial biomass and nutrient
flush in forest soils. Biology and Fertility of Soils 19,
220–226.
Dou FG, Hons F M, Ocumpaugh W R, Read J
C, Hussey MA, Muir JP. 2013. Soil organic carbon
pools under switchgrass grown as a bioenergy crop
compared to other conventional crops. Pedosphere
23(4), 409–416.
increased plant growth at different nitrogen supplies
but decreased nitrogen use efficiency at high
ammonium supply. Plant Science 227, 1–11.
Fierer N, Schimel JP. 2002. Effects of
drying-rewetting frequency on soil carbon and nitrogen
transformations. Soil Biology and Biochemistry 34,
777–787.
Franzluebbers AJ, Haney RL, Hons FM. 1999.
Relationships of chloroform fumigation–incubation
to soil organic matter pools. Soil Biology and
Biochemistry 31, 395–405.
Garcia C, Hernandez T, Costa F, Ceccanti B.
1994. Biochemical parameters in soils regenerated by
the addition of organic wastes. Waste Management
responses of established grassland bacterial
populations to water stress. Applied and
Environmental Microbiology 69, 6961–6968.
Insam H. 2001. Development in soil microbiology
Lee DK, Doolittle JJ, Owens VN. 2007. Soil
carbon dioxide fluxes in established switchgrass land
managed for biomass production. Soil Biology and
Biochemistry 39, 178–186.
Molatudi
et al.
nitrogen fertilizer on the yield and combustion quality
of whole-grain crops for solid fuel use. Industrial
Crops and Products 17(2), 103–117.
Lovell, RD, Jarvis SC, Bardgett RD. 1995. Soil
microbial biomass and activity in long-term
grassland: effects of management changes. Soil
Biology and Biochemistry 27, 969–975.
McLaughlin SB, de la Torre Ugarte DG,
Garten Jr CT, Lynd LR, Sanderso MA, Tolbert
VR, Wolf DD. 2002. High-value renewable energy
from prairie grasses. Environmental Science and
Technology 36, 2122–2129.
McLaughlin SB, Kszos AL. 2005. Development of
switchgrass (Panicum virgatum) as a bioenergy
feedstock in the United States. Biomass Bioenergy
28, 515–535.
Moore JM, Klose S, Tabatabai MA. 2000. Soil
microbial biomass carbon and nitrogen as affected by
cropping system. Biology and Fertility of Soils 31,
200–210.
Norman RJ, Edberg JC, Stucki JW. 1985.
Determination of nitrate in soil extracts by
dual-wavelength ultraviolet spectrophotometry. Soil
Science Society of America Journal 49, 1182–1185.
Pandey CB, Begum M. 2010. The effect of a
perennial cover crop on net soil N mineralization and
microbial biomass carbon in coconut plantations in
the humid tropics. Soil Use and Management 26,
158–166.
Pandey CB, Srivastava RC, Singh RK. 2009. Soil
nitrogen mineralization and microbial biomass
relation, and nitrogen conservation in humid-tropics.
Soil Science Society of American Journal 73, 1142–
1149.
Parker SS, Schimel JP. 2011. Soil nitrogen
availability and transformations differ between the
summer and the growing season in California
grassland. Applied Soil Ecology 48, 185-192.
Parrish D, Fike J. 2005. The biology and agronomy
of switchgrass for biofuels. Critical Reviews in Plant
Science 24, 423–459.
Roberts G, Penwell A, Peurou F, Sharpe A.
2010. The effect of soil moisture content on nitrogen
transformation using OECD test guideline 216.
Applied Soil Ecology 46, 478–482.
Ross DJ. 1987. Soil microbial biomass estimated by
the fumigation-incubation procedure: seasonal
fluctuation and influence of soil moisture content.
Soil Biology and Biochemistry 19, 397–404.
Schade JD, Hobbie SE. 2005. Spatial and
temporal variation in islands of fertility in the
Sonoran Desert. Biogeochemistry 73, 541–553.
Schmer MR, Liebig MA, Vogel KP, Mitchell
RB. 2011. Field-scale soil property changes under
switchgrass managed for bioenergy. Global Change
Biology and Bioenergy3, 439–448.
Su YZ, Zhang TH, Li YL, Wang F. 2005. Changes
in soil properties after establishment of Artemisia
halodendron and Caragana microphylla on shifting
sand dunes in semiarid Horqin Sandy Land, Northern
China. Environmental Management 36, 272–281.
Tu C, Ristaino JB, Hu S. 2006. Soil microbial
biomass and activity in organic tomato farming
systems: Effects of organic inputs and straw
mulching. Soil Biology and Biochemistry 38, 247–
255.
Vance ED, Brookes PC, Jenkinson DS. 1987. An
extraction method for measuring soil microbial
biomass C. Soil Biology and Biochemistry 19, 703–
707.
Vogel KP. 1996. Energy production form forages (or
American agriculture—back to the future). Journal of
Molatudi
et al.
Wright L, Turhollow A. 2010. Switchgrass
selection as a “model” bioenergy crop: A history of the
process. Biomass Bioenergy 34, 851–868.
Xiong SJ, Zhang QG, Zhang DY, Olsson R.
2008. Influence of harvest time on fuel characteristics
of five potential energy crops in northern China.
Bioresource Technology 99, 479485.
Yadav R. 2012. Soil organic carbon and soil
microbial biomass as affected by restoration
measures after 26 years of restoration in mined areas
of Doon Valley. International Journal of
Environmental Sciences 2(3), 1380–1385.
Yang L, Wei W, Chen L, Jia F, Mo B. 2012.
Spatial variation of shallow and deep moisture in
semi-arid Loess Plateau, China. Hydrology and Earth
System Sciences 16, 3199–3217.
Zhou Y, Pei Z, Su J, Zhang J, Zheng Y, Ni J,
Xiao C, Wang R. 2012. Comparing soil organic
carbon dynamics in perennial grasses and shrubs in a
saline-alkaline arid region, Northwestern China. PLoS