JOURNAL OF FOREST SCIENCE, 59, 2013 (8): 319–327
Long-term response of understorey cover, basal area
and diversity to stand density in a mixed oak forest
on the Síkfőkút plot in Hungary
T. Misik
1, K. Varga
2, Zs. Veres
2, I. Kárász
1, B. Tóthmérész
1Department of Environment Science, Eszterházy Karoly College, Eger, Hungary
2Department of Ecology, University of Debrecen, Debrecen, Hungary
ABSTRACT:The serious oak decline was reported for the 1979–80 period and 63.0% of adult oaks died in a mixed oak forest in the Síkfőkút site, Hungary. The data were used to obtain (1) quantitative information on diversity indices of shrub layer and shrub canopy, including foliage cover percentage of the shrub layer, mean cover of shrub species before and after the oak decline and (2) structural information on shrub basal area and shrub foliage arrangement. Since 1972 we have determined diversity indices, cover percentage and basal area of shrubby vegetation on the monitoring and plus plots. A negative relation was detected between Shannon-Wiener and Evenness indices of the shrub layer and living oak tree density. A positive relation was confirmed between basal area and mean cover of dominant woody species (Acer campestre, Acer tataricum and Cornus mas). The mean cover of shrub species except of A. campestre increased non-significantly after the oak decline on the 48 m × 48 m plot. The findings of the study indicate that diversity indices of the shrub layer and mean cover of A. campestre can be used as a principal indicator of natural disturbance in the studied mature stand and the species of the shrub layer respond differently to the decreasing stand density.
Keywords: Quercus cerris; shrub layer; Acer campestre; Shannon-Wiener index; Evenness index; shrub foliage cover
Supported by the New Hungary Development Plan, co-financed by the European Social Fund and the European Re-gional Development Fund, Grant No. TÁMOP 4.2.1./B-09/1/KONV-2010-0007.
Numerous studies used different structural and physiological variables, biotic and abiotic indica-tors to detect and monitor the forests health and dynamics (Jukola-Sulonen et al. 1990; Strand 1995; Wicklum, Davies 1995). Zarnoch et al. (2004) used crown condition variables.
Several biotic and abiotic factors have been considered as important in forest health studies, such as extreme weather conditions, drought, storms, heat (Drobyshev et al. 2008; Bolte et al. 2010), and insect fluctuations (Moraal, Hil-szczanski 2000), disease outbreaks (Mistretta 2002) or human induced influences such as cli-mate change, air pollution and fires (Signell et al. 2005; Kabrick et al. 2008). These factors may
modify the functioning of the whole forest ecosys-tem and may lead to tree decline events.
have examined the effects of tree decline on stand (especially on canopy layer) development but rela-tively few studies deal with shrub community and shrub layer dynamics in the process of tree decline (Alaback, Herman 1988; Gracia et al. 2007; Gazol, Ibáñez 2009).
Different structural variables can be used as indicators of disturbance regime and/or manage-ment practices in forests (Zumeta, Ellefson 2000; Larsson, Danell 2001). These variables are among others diversity, basal area and cover. It is not clear what is more important to improve the knowledge of forest ecosystems, diversity or cover (Gazol, Ibáñez 2009). So in this paper they used both variables complemented with basal area to obtain a more complete picture of shrub layer dynamics after the large-scale oak decline. Many factors affect the diversity of shrub and herb layer. Among others these are environmental condi-tions (Härdtle et al. 2003; Kolb, Diekmann 2004), perturbations (Onaindia et al. 2004; Gál-hidy et al. 2006), litter layer (Dzwonko, Gaw-ronski 2002) and intensity and type of former forest management (Graae, Heskjaer 1997). Open areas and tree species diversity had a posi-tive relationship to shrub cover because a diverse overstorey generally created more canopy gaps (Gazol, Ibáñez 2009). Canopy layer stand struc-ture strongly influences understorey cover by re-sources, altering microsites and environmental conditions by light availability (Alaback 1982; Oliver, Larsson 1996). Shrub cover is linked to habitat quality and a number of interconnected ecological processes (Carey 1995; Hagar et al. 1996).
The species composition of the canopy layer was stable until 1979 and the healthy density of
Q. petraea and of Quercus cerris L. also remained constant in the study site. The massive dieback of oaks started in 1979–80 and 68.4% of Q. petraea
trunks died until 2007. The overall species compo-sition of the canopy has changed little, only some trees of Tilia cordata Mill. and Carpinus betulus
L. lived as new species in the site. The results of Jakucs (1988) suggested that the soil acidification induced by disappearance of mycorrhiza fungi and the air pollutants that promote water and nutrient absorption have been considered and identified as primary causes of deciduous forest decline.
The oak decline of the sample site resulted in an opening of the canopy; the canopy cover creased from 80% (1972) to 36% (2007). The de-creased oak tree density led to numerous signifi-cant structural changes in the understorey such
as herbaceous layer and shrub layer. The objec-tives of this study were to (1) to determine the ef-fects of canopy density on the understorey shrub layer; (2) quantify and compare the shrub layer vegetation diversity (Shannon-Wiener index and Evenness index) before and after the oak decline; (3) to describe the relation between shrub layer cover and shrub basal area development and final-ly (4) to evaluate a potential interaction between shrub basal area and foliage cover of shrub species in the understorey.
MATERIALS AND METHODS
Study site
The 27-ha reserve research area is located in the Bükk Mountains (47°55'N, 20°46'E) in the north-eastern part of Hungary at a distance of 6 km from the city of Eger at an altitude of 320–340 m a.s.l. The mean annual temperature is 9.9°C and the mean annual precipitation ranges typically from 500 to 600 mm. The most common forest asso-ciation in this region is Quercetum petraeae-cerris
with the species Q. petraea (Sessile oak) and Q. cer- ris (Turkey oak) in the canopy layer. Both oak spe-cies are dominant native deciduous tree spespe-cies of the Hungarian natural woodlands. Other co-dominant tree species in the site included C. be- tulus, Prunus avium L. and Tilia cordata. Seven dominant native shrub species were identified across the entire study area as Acer campestre L.,
Acer tataricum L., Cornus mas L., Cornus san-guinea L., Crataegus monogyna Jacq., Euonymus verrucosus Scop. and Ligustrum vulgare L. A gen-eral description of geographic, climatic, soil con-ditions and vegetation of the forest was done in detail by Jakucs (1985, 1988). The near-natural, even-aged temperate deciduous forest is at least 95–100 years old and has not been disturbed by forest management for more than 50 years.
Sampling and data analysis
47°55.632'N, 20°46.705'E, 314 m a.s.l.; A3 plot: 47°55.568'N, 20°46.655'E, 313 m a.s.l.) were se-lected for the vegetation sampling, which were randomly located. Canopy trees were classi-fied as sessile oak and Turkey oak trees > 13.0 m in height and ≥ 10.0 cm in diameter at breast height (DBH). The shrubby vegetation was re-corded in two horizontal layers; shrub individuals higher than 1.0 m were categorized as high shrubs and lower ones as low shrubs. Stems < 50.0 cm height of oak species were inventoried and identi-fied to oak seedlings. The term “dominant woody species” is used for A. campestre, A. tataricum
and C. mas according to the biggest mean size parameters (shoot height and diameter) of these species in the understorey. Measures of the shrub layer structure included cover and diversity indi-ces such as Shannon-Wiener and Evenness. The following indices were calculated on the monitor-ing and plus plots: Shannon-Wiener index (H’) (Eq. 1) and Evenness index (E) (Eq. 2):
Evenness index was calculated as the ratio of ob-served diversity (H’) to maximum diversity (Hmax) (Magurran 1988). Diversity indices were calcu-lated with and without oak seedlings, because the oak seedling density showed notable fluctuations from year to year. On the plus plots mean diver-sity indices were determined on the basis data ob-tained on three plus plots.
The stand basal area (BA, m2·ha–1) for high shrubs was calculated for each plot from all high shrub species. Location and cover of all high shrub specimens were mapped on the monitoring plot. Many studies included the method of foli-age cover map drawing (e.g. Jakucs 1985). Foli-age cover maps were digitized in ArcView (ESRI, Redmont, USA). Based on the digitized map we estimated the foliage cover of shrub species. In the last decades 510–1394 high shrub individu-als were sampled and then subjected to the mean cover analysis of shrub species. Total foliage and duplex- and multiplex cover (shrub canopy over-lapped other shrub species) of the shrub layer were recorded. Experimental data were statisti-cally evaluated by linear regression to determine
a significant relationship between basal area and cover of the understorey shrub species STATIS-TICA 19 (SPSS, Tulsa, USA). Correlation analysis was used to test the relation between healthy oak tree density and basal area of dominant woody species and diversity indices of understorey. One-way ANOVA with Tukey’s HSD test was used as a post-hoc test if necessary to determine significant differences among shrub species by mean cover, basal area, Shannon-Wiener index and Evenness index. Statistical analysis was performed using the PAST statistical software and significant dif-ferences for all statistical tests were evaluated at the level of P ≤ 0.05 or P ≤ 0.01.
RESULTS
Shannon-Wiener index varied between 1.27 and 2.22 in the understorey and was slightly higher on the plus plots while the oak seedling density var-ied between 482 and 52,583 specimens per hect-arefrom 1972 to 2012. The results of correlation analysis showed a significant relation between oak tree density and Shannon-Wiener index of the un-derstorey (shrub layer with low and high shrub specimens) (r = 0.82, P ≤ 0.05). The oak mortality
non-significantly affected the species diversity in the high shrub layer (r = 0.56, P > 0.05). There was
a positive correlation between living oak tree den-sity and species diverden-sity of the low shrub layer (r = 0.79, P ≤ 0.05). Shannon-Wiener index of the high shrub layer increased after the oak decline. The index varied oppositely in the lower shrub community (Table 1). Non-significant differences were recorded among diverse Shannon-Wiener indices in the understorey by ANOVA statistical analysis (F3;24 = 1.51; P = 0.24).
Evenness index varied between 0.46 and 0.77 in the understorey and was slightly higher on the plus plots in 2012. A significant correlation was confirmed between Evenness of the understo-rey and oak tree mortality (r = 0.83, P ≤ 0.05).
1979–80. The most conspicuous change of Even-ness was recorded in the understorey without oak seedlings and in the low shrub layer (Table 1). Sig-nificant differences between Evenness in the un-derstorey were confirmed (F3;24 = 4.65; P = 0.01).
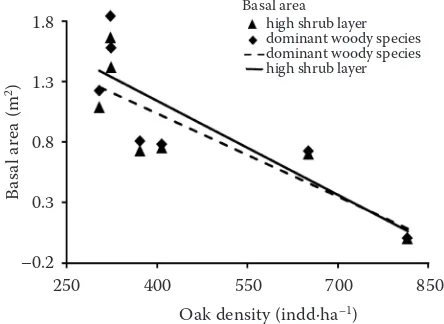
The highest total basal area of the high shrub layer recorded in the last measuring was 11.66 m2·ha–1. The proportion of the basal area of maple species and C. mas together was higher than 89.0% of the basal area of the shrub layer in all measurements. Correlation analysis shows that the canopy tree density varied significantly with the total basal area of the high shrub layer and of the domi-nant woody species (r = 0.76 and 0.74, P ≤ 0.05)
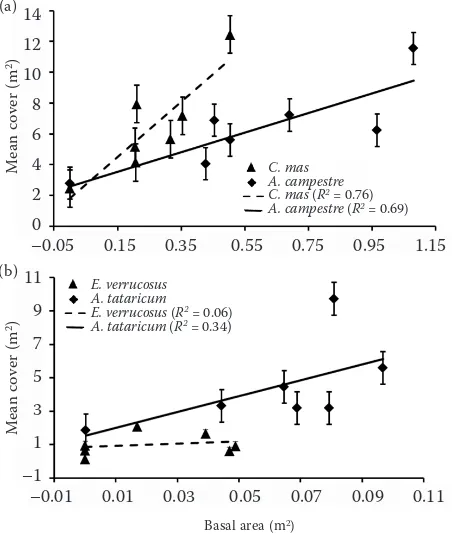
(Fig. 1). Linear regression shows that a positive sig-nificant interaction between basal area and mean cover was detected for the dominant woody spe-cies A. campestre (r = 0.83, R2 = 0.69, F1;5 = 11.27, P ≤ 0.05) and C. mas (r = 0.87, R2 = 0.76,
F1;5 = 15.93, P ≤ 0.05). Non-significant differences in shrub cover and basal area were determined for A. tataricum and E. verrucosus (r = 0.59,
R2 = 0.34, F
1;5 = 2.6 and r = 0.23, R2 = 0.06,
F1;5 = 0.29; P > 0.05) over the past three decades (Fig. 2). The one-way ANOVA indicated signifi-cant differences in the shoot basal area of some woody species (F5;36 = 11.50; P ≤ 0.001) (Table 2).
From 1972 to 1988 the shrub layer foliage cover increased remarkably; since 1993 onwards there has not been a clear tendency in the fluctuation of the shrub layer cover. No significant differences were revealed between oak tree density and du-plex- and multiplex shrub cover and between to-tal cover and duplex- and multiplex cover in the shrub community (r = 0.33, P > 0.05). In the first decade of surveys the duplex- and multiplex cover increased from 13.8% to 56.3%. Later there was no unambiguous tendency in the change of duplex- and multiplex cover of the shrub layer (Table 3). Significant differences were detected by ANOVA between mean cover of dominant woody species and mean cover of E. verrucosus and mean cover of other species (F4;30 = 8.84 P ≤ 0.001) (Table 2).
A. campestre showed a significant mean percent cover increase (r = 0.77, P ≤ 0.05) after serious oak decline. Our data shows a non-significant rela-tion between oak tree density and mean cover of other dominant species (A. tataricum: r = 0.58.,
C. mas: r = 0.71, E. verrucosus: r = 0.53; P > 0.05). Table 1. Relation between living oak trees and oak seedling density and Shannon diversity index (H’) and Evenness index (E) for the understorey layer of the monitoring plot during the period 1972–2012
Year
Density (indd·ha–1) Shannon diversity index/Evenness index
oak tree oak seedling with oak seedlings
without oak
seedlings high shrub layer low shrub layer
1972 816 12,413 2.22/0.77 1.99/0.69 1.53/0.66 2.16/0.75
1982 651 52,583 1.78/0.62 1.27/0.46 1.73/0.66 1.70/0.59
1988 408 2,695 1.94/0.65 1.87/0.65 1.91/0.71 1.86/0.62
1993 372 482 1.74/0.60 1.68/0.61 1.93/0.75 1.65/0.64
1997 304 2,908 1.68/0.61 1.54/0.58 1.95/0.70 1.62/0.60
2002 324 1,528 1.65/0.58 1.46/0.54 1.88/0.71 1.47/0.56
2007 323 1,788 1.69/0.59 1.50/0.55 1.84/0.72 1.63/0.58
2012 305 21,848 1.74/0.61 1.66/0.63 1.54/0.62 1.67/0.59
2012* 267 5,500 1.88/0.71 1.61/0.67 1.78/0.86 1.82/0.70
*oak tree and oak seedling density, Shannon-Wiener and Evenness indeces of plus plots
Fig. 1.Correlation relationship between oak tree den-sity and total basal area of the understorey layer during 1972–2012
dominant woody species (r = 0.74; P ≤ 0.05), high shrub layer (r = 0.76; P ≤ 0.05)
Basal area high shrub layer dominant woody species dominant woody species high shrub layer
250 400 550 700 850 Oak density (indd·ha–1)
B
asal ar
ea (m
2)
1.8
1.3
0.8
0.3
The mean cover of other shrubs was increased from 1.0 m2 to 2.8 m2 during two decades. Later this mean cover fluctuated, the values ranging from 1.0 m2 to 4.3 m2 (Table 3).
DISCUSSION
The consequences of tree mortality cause nota-ble changes in the light and stand thermal condi-tions which led to structural changes of the shrub layer (Chapman et al. 2006) and changes in the soil condition (Thomas, Büttner 1998). Some studies pointed out the negative effect of tree abundance (quantified through basal area or stem density, or directly by light availability) on under-storey vegetation cover or diversity (Alaback, Herman 1988; Thomas et al. 1999), also sup-ported by the results of this paper. The decreas-ing canopy tree density led to the remarkably in-creasing cover of the shrub community in the first decade after the oak decline (to 1988 about 30%). Moreover, a reduction in canopy cover resulted in an increase in understorey cover most likely be-cause of the increased light availability.
The tree species effect on vegetation diversity was not clearly apparent. Some studies of
numer-ous forest sites have shown that the effect of tree species diversity on vegetation diversity was low (Whitney, Foster 1988; Hong et al. 1997). Kir-by (1988) and Amezaga and Onaindia (1997) concluded that the planting of coniferous tree species, rather than of native hardwoods, reduced species richness and therefore diversity index. Ac-cording to Brosofske et al. (2001) the canopy cover was a dominant site variable influencing diversity in a managed landscape such as mature and young hardwoods, mature red and Jack pine, young mixed pine, clearcuts and open Pine Bar-rens. Other environmental and local edaphic dif-ferences existed, but were less extensive. Our study is in agreement with the results of Onaindia et al. (2004), who suggested to use diversity and Even-ness indices to evaluate the effects of disturbances in temperate forests. In the study of de Grand-pré et al. (2011) in Canada the Shannon-Wiener index increased significantly (P < 0.001) with time since treatment application; along a canopy gap severity gradient in mature and old-growth forest stands. In our study Shannon-Wiener index and Evenness index of the shrub layer indi-cated a positive correlation with a significant de-crease in canopy density.
Another monitoring plot of Hungary, the 94 ha Vár-hegy forest reserve, is situated on the hill range of the Southern Bükk Mountains. The spe-cies composition of understorey (herb and shrub layer) did not change after serious oak decline in the 1970s and 1980s similarly to our or other Hungarian site. Shannon-Wiener diversity index was measured to be 1.92 and Evenness index of the low shrub layer was 0.80 in 2004. Shannon-Wiener and Evenness indexes were 1.69 and 0.73 in the high shrub layer (Horváth 2012). Changes in species richness and Evenness index indicated how the community composition had been altered because of environmental changes.
Chapman et al. (2006) reported that in the up-land oak forest of the USA the total shoot density and basal area in the understorey were substan-tially higher in 2002 than in 1934, increasing from 240 to 688 trees·ha–1 and from 0.9 to 3.6 m2·ha–1, while the density of most oaks and shortleaf pines in the canopy decreased appreciably over time. Overstorey density and basal area approximately doubled from 1934 to 2002, increasing from 73 to 150 trees·ha–1 and from 7.2 to 14.2 m2·ha–1, while the black oak density rate decreased in impor-tance from 30.0 to 10.0% (Chapman et al. 2006). On the Síkfőkút site a considerable increase in the basal area of the understorey and overstorey layer Fig. 2. Regression models relating the mean cover of
dominant woody species and their basal area (± S.E.) by the understorey layer during 1972–2007 in the sample site R2 – coeicient of determination of linear regression
was detected in the long-term trend, while the shoot and tree density of the under- and oversto-rey decreased. In the study of Gracia et al. (2007) the relationship between shrub cover and basal area of the overstorey was significant only for two species, and in both cases, cover decreased with basal area. Other studies have shown nega-tive correlations of understorey cover with canopy tree basal area (Gilliam, Turrill 1993) presum-ably because of differential light availability. On our site the cover and duplex and multiplex cover rate of shrub layer increased from 64.4% to 86.2% and from 13.8% to 46.8% in the period 1972–2007, while the total basal area of canopy decreased
from 32.1 m2·ha–1 in 1972 to 24.4 m2·ha–1 in 2007. The processing of foliage cover percentage of sites in 2012 may be expected in the future.
Results from Kerns and Ohmann (2004) sug-gest that in the Oregon forest structure, stand de-velopment, site disturbance history and environ-ment conditions all interact to influence the shrub layer cover. Shrub cover was negatively correlated with Tsuga heterophylla basal area and density of
shade tolerant trees. Total shrub cover increased significantly (P < 0.001) with time since canopy
gaps were formed after serious oak decline. Fur-thermore, the increase in total species cover was significantly more pronounced in mature than Table 2. Results of one-way ANOVA and Tukey’s HSD test for basal area and mean cover of dominant woody species and other shrub species on the monitoring plot (in signiicance level)
Studentized range A. campestre A. tataricum C. mas E. verrucosus Others*
Basal area
A. campestre – 0.0256 0.3248 0.0134 0.0364
A. tataricum 4.6470 – 0.8268 0.9999 1.0000
C. mas 2.9290 1.7180 – 0.6865 0.8895
E. verrucosus 5.0040 0.3569 2.0750 – 0.9987
Others 4.4440 0.2032 1.5150 0.5601 –
Mean cover
A. campestre – 0.5494 1.0000 0.0010 0.0068
A. tataricum 2.1690 – 0.4987 0.0449 0.2105
C. mas 0.1171 2.2870 – 0.0008 0.0055
E. verrucosus 6.3390 4.1700 6.4570 – 0.9409
Others 5.2690 3.0990 5.3860 1.0710 –
in bold – signiicant diferences, *indicates mean cover of other high shrub species: C. sanguinea, Cr. monogyna, E. euro-paeus, J. regia, L. vulgare, L. xylosteum
Table 3. Oak tree density, cover (% rate of sample plot) for the understorey layer and mean cover (mean ± SD) of dominant woody species and other shrub species during the period 1972–2007 on the monitoring plot
Year Oak tree density (indd·ha–1)
Cover (%) Mean cover (m2)
total shrub duplex and multiplex A. campestre A. tataricum C. mas others*
1972 816 64.4 13.8 2.8 ± 1.4 1.9 ± 1.0 2.5 ± 1.3 1.0 ± 0.3
1982 651 85.3 56.3 4.1 ± 3.6 3.2 ± 2.7 4.1 ± 3.4 1.9 ± 0.4
1988 408 94.2 34.2 5.6 ± 6.3 3.3 ± 3.0 5.2 ± 4.3 2.2 ± 3.0
1993 372 74.0 54.0 6.9 ± 5.1 4.5 ± 2.4 7.9 ± 5.2 2.8 ± 1.2
1997 304 79.5 41.5 7.2 ± 7.2 3.2 ± 2.9 5.7 ± 5.1 2.5 ± 3.9
2002 324 67.5 23.8 6.2 ± 6.0 5.6 ± 5.1 7.2 ± 5.8 1.0 ± 0.7
2007 323 86.2 46.8 11.5 ± 9.8 9.7 ± 7.0 12.4 ± 9.2 4.3 ± 7.4
old-growth stands of Canada (de Grandpré et al. 2011). Total cover of the shrub layer increased slightly, but non-significantly in a mature oak for-est of the USA, from 45.0% in 1950 to 51.0% in 1969 and 1979. Contrary, the Shannon-Wiener diversity index increased considerably, from 0.06 to 0.71 in 1979. The most marked change was an increasing prevalence of shade-intolerant shrubs, such as Rubus sp. and woody wines. In 1950 vines comprised 0.4% of the total shrub foliage cover, which increased to 11.5% in 1979 (Davison, For-man 1982).
On Síkfőkút site the cover percentage of canopy layer decreased notably in the period 1972–1998 after the large-scale tree decline. Consequently, heterogeneous sizes of canopy gaps were formed. A similar situation could be found in Vár-hegy even-aged forest, where 20–50% of canopy gaps were formed as the consequences of oak decline in the 1980s (Horváth 2012). he autochthonous species
Q. cerris and Q. petraea formed a nearly monolayer canopy (Čermák et al. 2008), therefore they could not fully compensate the signiicantly reduced fo-liage cover of canopy. Despite this ecological pro-cess we could not ind a clear tendency of a shrub cover variation after the oak decline. In the sparse canopy of Síkfőkút forest a considerable increase of dominant woody species was recorded in the ma-ture foliage cover. hese are late seral species, as A. campestre and A. tataricum are generally shade tol-erant and respond positively to canopy gaps. Most major understorey species were more frequent and the foliage cover was signiicantly higher in canopy openings (Stewart 1988).
Our results suggest that the decreasing cano-py tree density led to the remarkably increasing cover of the shrub community. The rapid growth of shrubs covers immediately following the start of oak decline and it took until 1988. Moreover, a reduction in the canopy stand density resulted in a significant increase in the understorey bas-al area. The forest community compensated for significant foliage losses of oak trees by increas-ing cover percentage and basal area of dominant woody species. The shade-tolerant and late-seral species, especially field maple in our site, would play an important role in the compensating for the foliage losses of oak canopy. All information of our study will allow us to understand the shrub community development and to develop use and management after the serious oak decline. More research is needed to gain a better understanding of the relationship between stand density and foli-age cover development in the shrub layer.
Acknowledgements
We would like to thank the co-workers of Uni-versity of Debrecen and Eszterházy Károly College in Eger for help with field work until 2002.
R e f e r e n c e s
Alaback P.B. (1982): Dynamics of understory biomass in Sitka spruce–western hemlock forests of southeast Alaska. Ecology, 63: 1932–1948.
Alaback P.B., Herman F.R. (1988): Long-term response of understory vegetation to stand density in Picea-Tsuga for-ests. Canadian Journal of Forest Research, 18: 1522–1530.
Amezaga I., Onaindia M. (1997): he efect of evergreen and deciduous coniferous plantations on the ield layer and seed bank of native woodlands. Ecography, 20: 308–318.
Bolte A., Hilbrig L., Grundmann B., Kampf F., Brunet J., Roloff A. (2010): Climate change impacts on stand structure and competitive interactions in a southern Swedish spruce–beech forest. European Journal of Forest Research, 129: 261–276.
Brosofske K.D., Chen J., Crow T.R. (2001): Understory veg-etation and site factors: implications for a managed Wisconsin landscape. Forest Ecology and Management, 146: 75–87.
Carey A.B. (1995): Sciurids in Pacific Northwest man-aged and old-growth forests. Ecological Applications, 5:
648–661.
Čermák J., Tognetti R., Nadezhdina N., Raschi A. (2008): Stand structure and foliage distribution in Quercus pubescens and Quercus cerris forests in Tuscany (central Italy). Forest Ecology and Management, 255: 1810–1819.
Chapman R.A., Heitzman E., Shelton M.G. (2006): Long-term changes in forest structure and species composition of an upland oak forest in Arkansas. Forest Ecology and Management, 236: 85–92.
Davison S.E., Forman R.T.T. (1982): Herb and shrub dynam-ics in a mature oak forest: a thirty-year study. Bulletin of the Torrey Botanical Club, 109: 64–73.
De Grandpré L., Boucher D., Bergeron Y., Gagnon D. (2011): Efects of small canopy gaps on boreal mixedwood understory vegetation dynamics. Community Ecology,
12: 67–77.
Drobyshev I., Niklasson M., Eggertsson O., Linderson H., Sonesson K. (2008): Inluence of annual weather on growth of pedunculate oak in southern Sweden. Annals of Forest Science, 65: 512–512.
Freer-Smith P.H., Read D.B. (1995): he relationship be-tween crown condition and soil solution chemistry in oak and Sitka spruce in England and Wales. Forest Ecology and Management, 79: 185–196.
Population Dynamics, Impacts, and Integrated Manage-ment of Forest Defoliating Insects. Banská Štiavnica, 18.–23. August 1996. Radnor, USDA Forest Service: 7–24. Gazol A., Ibáñez R. (2009): Diferent response to environ-mental factors and spatial variables of two attributes (cover and diversity) of the understorey layers. Forest Ecology and Management, 258: 1267–1274.
Gálhidy L., Mihók B., Hagyó A., Rajkai K., Standovár T. (2006): Efects of gap size and associated changes in light and soil moisture on the understorey vegetation of a Hungarian beech forest. Plant Ecology, 183: 133–145.
Gilliam F.S., Turrill N.L. (1993): Herbaceous layer cover and biomass in a young versus a mature stand of a central Appalachian hardwood forest. Bulletin of the Torrey Bo-tanical Club, 120: 445–450.
Graae B.J., Heskjaer V.S. (1997): A comparison of understorey vegetation between untouched and managed deciduous forest in Denmark. Forest Ecology and Management, 96: 111–123.
Gracia M., Montané F., Piqué J., Retana J. (2007): Over-story structure and topographic gradients determining diversity and abundance of understory shrub species in temperate forests in central Pyrenees (NE Spain). Forest Ecology and Management, 242: 391–397.
Hagar J.C., McComb W.C., Emmingham W.H. (1996): Bird communities in commercially thinned and unthinned Douglas-ir stands of western Oregon. Wildlife Society Bulletin, 24: 353–366.
Hämmerli F., Stadler B. (1989): Eichenschäden - Eine Übersicht zur Situation in Europa und in der Schweiz. Schweiz-erische Zeitschrift für Forstwesen, 140: 357–374.
Härdtle W., von Oheimb G., Westphal C. (2003): he efects of light and soil conditions on the species richness of the ground vegetation of deciduous forests in northern Germany (Schleswig-Holstein). Forest Ecology and Man-agement, 182: 327–338.
Hong Q., Klinka K., Sivak B. (1997): Diversity of the un-derstory vascular vegetation in 40-year-old and old-growth forest stands on Vancouver Island, British Columbia. Journal of Vegetation Science, 8: 778–780.
Horváth F. (2012): Módszertani fejlesztések az erdőrezer-vátumok hosszú távú faállomány-szerkezeti kutatásához. [Methodological developments to the long term research of stand structure of forest reserves.] [Ph.D. hesis.] Sopron, University of West Hungary in Sopron: 80.
Jakucs P. (ed.) (1985): Ecology of an Oak Forest in Hungary. Budapest, Akadémia Kiadó: 546.
Jakucs P. (1988): Ecological approach to forest decline in Hungary. Ambio, 17: 267–274.
Jukola-Sulonen E.L., Mikkola K., Salemaa M. (1990): he vitality of conifers in Finland, 1986–88. In: Kauppi P. (ed.): Acidiication in Finland. Berlin, Springer-Verlag: 523–560.
Kabrick J.M., Dey D.C., Jensen R.G., Wallendorf M. (2008): he role of environmental factors in oak decline
and mortality in the Ozark Highlands. Forest Ecology and Management, 255: 1409–1417.
Kerns B.K., Ohmann J.L. (2004): Evaluation and prediction of shrub cover in coastal Oregon forests (USA). Ecological Indicators, 4: 83–98.
Kirby K.J. (1988): Changes in the ground lora under planta-tions on ancient woodland sites. Forestry, 61: 317–338.
Kolb A., Diekmann M. (2004): Efects of environment, habitat coniguration and forest continuity on the distribu-tion of forest plant species. Journal of Vegetadistribu-tion Science,
15: 199–208.
Larsson S., Danell K. (2001): Science and the management of boreal forest biodiversity. Scandinavian Journal of Forest Research, 3: 5–9.
Magurran A.E. (1988): Ecological Diversity and its Meas-urement. Princeton, Princeton University Press: 192. Mistretta P.A. (2002): Southern forest resource assessment
highlights: managing for forest health. Journal of Forestry,
100: 24–27.
Moraal L.G., Hilszczanski J. (2000): he oak buprestid beetle, Agrilus biguttatus (F.) (Col., Buprestidae), a recent factor in oak decline in Europe. Journal of Pest Science,
73: 134–138.
Oliver C.D., Larson B.C. (1996): Forest Stand Dynamics. New York, Wiley: 520.
Onaindia M., Dominguez I., Albizu I., Garbisu C., Amezaga I. (2004): Vegetation diversity and vertical struc-ture as indicators of forest disturbance. Forest Ecology and Management, 195: 341–354.
Signell S.A., Abrams M.D., Hovis J.C., Henry S.W. (2005): Impact of multiple ires on stand structure and tree regen-eration in central Appalachian oak forests. Forest Ecology and Management, 218: 146–158.
Stewart G.H. (1988): he inluence of canopy cover on understory development in forests of the western Cascade Range, Oregon, USA. Vegetatio, 76: 79–88.
Strand G.H. (1995): Estimation of the diference in crown vigour for 2280 coniferous trees in Norway from 1989 to 1994, adjusted for the efects of ageing. Environmental Monitoring and Assessment, 36: 61–74.
Thomas F.M., Büttner G. (1998): Nutrient relations in healthy and damaged stands of mature oaks on clayey soils: two case studies in northwestern Germany. Forest Ecology and Management, 108: 301–319.
Thomas S.C., Halpern C.B., Falk D.A., Liguori D.A., Austin K.A. (1999): Plant diversity in managed forests: understory responses to thinning and fertilization. Ecologi-cal Applications, 9: 864–879.
Whitney G.G., Foster D.R. (1988): Overstorey composi-tion and age as determinants of the understorey flora of woods of central New England. Journal of Ecology, 76:
867–876.
J. FOR. SCI., 59, 2013 (8): 319–327 327 Zarnoch S.J., Bechtold W.A., Stolte K.W. (2004): Using
crown condition variables as indicators of forest health. Canadian Journal of Forest Research, 34: 1057–1070.
Zumeta D.C., Ellefson P.V. (2000): Conserving the bio-logical diversity of forests: program and organizational
experiences of state governments in the United States. Environmental Management, 26: 393–402.
Received for publication March 21, 2013 Accepted after corrections August 27, 2013
Corresponding author:
Tamás Misik,Eszterházy Karoly College, Department of Environment Science, Leányka str. 6, 3300 Eger, Hungary