See discussions, stats, and author profiles for this publication at: https://www.researchgate.net/publication/272185387
Increase in carbon accumulation in a boreal
peatland following a period of wetter climate
and long-term decrease in nitrogen...
Article in New Phytologist · February 2015
DOI: 10.1111/nph.13311 · Source: PubMed
CITATIONS
0
READS
83
3 authors, including:
Some of the authors of this publication are also working on these related projects:
From spruce to beech forests - fundamental ecosystem transformation driven by climate changeView
project
Limitations and pitfalls caused by errors and uncertainties in the process of distribution modelling
View project Rune Halvorsen
University of Oslo
138 PUBLICATIONS 3,968 CITATIONS
SEE PROFILE
Mikael Ohlson
Norwegian University of Life Sciences (NMBU)
106 PUBLICATIONS 2,728 CITATIONS
SEE PROFILE
Increase in carbon accumulation in a boreal peatland following a
period of wetter climate and long-term decrease in nitrogen deposition
Simon Utstøl-Klein
1, Rune Halvorsen
2and Mikael Ohlson
11Department of Ecology and Natural Resource Management, Norwegian University of Life Sciences, PO Box 5003, NO-1432As, Norway;2Department of Botany, Natural History Museum,
University of Oslo, PO Box 1172, Blindern, NO-0318 Oslo, Norway
Author for correspondence:
Mikael Ohlson Tel: +47 64965757
Email: [email protected]
Received:14 October 2014
Accepted:30 December 2014
New Phytologist(2015)
doi: 10.1111/nph.13311
Key words: bog, hummock, ombrotrophic, peat growth, pine method,Sphagnum.
Summary
Rates of peat growth and carbon (C) accumulation in aSphagnum-dominated boreal peat-land in south-east Norway were compared over two time periods each 17 yr long, that is, an earlier period from 1978 to 1995 and a recent period from 1995 to 2012.
Our research was based on 109 peat cores. By using exactly the same study area and sam-pling protocols to obtain data for the two time periods, we were able to obtain a clear picture of the spatio-temporal patterns of peat accumulation.
We show that peat growth and C accumulation were significantly higher in the recent than in the earlier time period. Interestingly, nitrogen (N) deposition was lower in the recent than in the earlier time period, while precipitation increased in the recent time period. Tempera-tures did not show any consistent trends over the time periods.
Although our data do not allow assessment of the relative importance of declining N depo-sition vs increasing precipitation as drivers of peat accumulation, our results suggest that peatland C sequestration is not significantly inhibited by N pollution at current precipitation and N deposition levels.
Introduction
Northern peatlands have accumulated carbon (C) over the Holo-cene and today they account for between quarter and one-third of the global soil C pool and play an important role in the C cycle (Gorham, 1991; Vittet al., 2000; Yu, 2012). The C sink function of northern peatlands is a result of low decomposition rates rather than high productivity (Malmer & Wallen, 1993), although the proximate reason why a peatland functions as a sink for C is that its vegetation fixes more C from the atmosphere than is lost through outflow of dissolved organic C and emissions of CO2 and CH4 (Roulet et al., 2007). Typically, as much as
70–90% of the fixed C is lost by the respiration of decomposers
in the aerobic surface layer of the peatland (Ohlson & Økland, 1998; Malmer & Wallen, 1999; Vitt et al., 2000), while the remaining organic material eventually becomes stored in deeper and anoxic peat layers where the biological activity is very low (Clymo, 1984; Vittet al., 2000; Malmer & Wallen, 2004).
Most northern peatlands are naturally nutrient-poor ecosys-tems (Aertset al., 1992) and their vegetation is usually dominated bySphagnummosses (Rydin & Jeglum, 2013), which play a fun-damental functional role by contributing a major part of the C that is stored in peat (Clymo & Hayward, 1982). Sphagnum mosses are sensitive even to small changes in environmental con-ditions, such as temperature and supplies of nutrients and water (Rydin, 1986; Robroek et al., 2009; Granath et al., 2012), and recent studies indicate that the competitive balance between
decomposition (Limpens & Berendse, 2003; Dorrepaal et al., 2005; Bragazza et al., 2006, 2012; Bragazza & Freeman, 2007; Bragazza & Freeman, 2007). In addition, climatic factors such as the temperature and rainfall during the growing season interact with N deposition in determining production and C accumula-tion bySphagnummosses (Gerdolet al., 2007). Accordingly, the findings of Limpenset al.(2011) indicate that current rates of N deposition will strongly inhibit peatland C sequestration in large parts of Europe if the climate becomes warmer and wetter.
Our current understanding of the interacting effects of climate change and N deposition on C accumulation rates in northern peatlands is based upon experimental studies conducted over a few years. Longer term interaction effects over decadal time-scales have, to the best of our knowledge, not yet been measured, or estimated, by use of time series of empirical data.
Using vegetation analyses and samples of dated peat cores collected in 1995, Ohlson & Økland (1998) gave a detailed documentation of the spatial variation in the rates of peat and C accumulation over the last century in the boreal bog Søndre Kisselbergmosen, in southeast Norway. Here, we report the results from a re-sampling of the same bog using exactly the same field protocol as that used by Ohlson & Økland (1998). The re-sampling was carried out 17 yr after the sampling in 1995, and by selecting a subset of data from Ohlson & Økland (1998) that represents the 17-yr time period before 1995, we obtained two sets of peat samples that cover the same range of habitat conditions, but different time periods of equal length, that is, an earlier period from 1978 to 1995 and a recent period from 1995 to 2012. The aims of our study were (1) to determine whether peat and C accumulation rates differed between the earlier and recent time periods, and if so, how; (2) to explore the relation-ships of peat accumulation with temperature, precipitation, and N deposition in the two time periods; and (3) to briefly compare our results with recent long-term eddy covariance-based measurements of C exchange in boreal peatlands (i.e. Roulet et al., 2007; Flana-gan & Syed, 2011; Peichl et al., 2014). Because of a general decrease in N deposition in our study area over the last 25 yr (Pe-dersenet al., 1990; Tørseth & Pedersen, 1994; Tørseth & Semb, 1997; Hole & Tørseth, 2002; Aaset al., 2006; Aas, 2012), we pre-dicted that peat and C accumulation rates would be higher in the recent time period than in the earlier period.
Materials and Methods
Study site
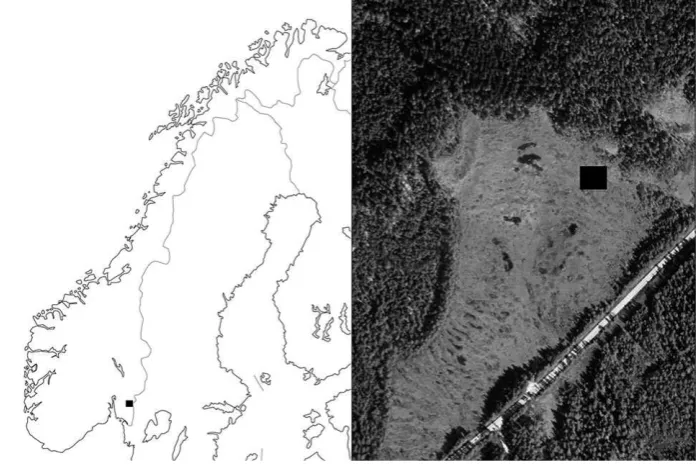
The study was conducted in the northern part of the peatland Søndre Kisselbergmosen (59°370N, 11°400E), located 285 m
above sea level in the municipality of Marker, in the county of Østfold, south-east Norway (Fig. 1). This peatland is an asym-metrically raised bog with intact hydrology except for some small, old ditches in the margin of the eastern part where a road passes close to the bog. Our study area, which corresponds exactly with the 400-m2‘Plot 1’ of Ohlson & Økland (1998), was located at the mire expanse end of the mire expanse–mire margin gradient
(Økland et al., 2001). Peat depth is c. 4 m and the area is
characterized by an irregular pattern of hummocks and hollows, typical of weakly sloping boreal bogs (Fig. 1). The hummocks were dominated byCalluna vulgaris(L.) Hull,Sphagnum fuscum (Schimp.) H. Klinggr.,Sphagnum rubellumWilson andCladonia rangiferina (L.) Wigg., while the hollows were dominated by Sphagnum tenellum (Brid.) Brid. and Sphagnum cuspidatum Hoffm. Further information about the peatland vegetation of the study site is given by Ohlsonet al.(2001).
The climate of the study area was weakly oceanic (Moen, 1998), with an estimated average annual temperature of 3.7°C
and an annual precipitation ofc. 850 mm for the period 1961–
1990 (Økland, 1989).
Peat sampling and peat age estimation
A total of 104 peat cores were collected between 25 August and 16 September 2012. A sharp-edged cylindrical corer (length 50 cm; diameter 10 cm) was used to collect peat cores adjacent to all specimens of Scots pine (Pinus sylvestrisL.) in the study area. Every peat core was cut at the depth of the adjacent pine’s root collar, so that each peat sample contained exactly the amount of peat that had accumulated since the pine established. The year (time) of pine establishment, that is, pine age, was determined in the laboratory by using a stereomicroscope to count tree rings at the root collar of the pines. This is the essence of the so-called ‘pine method’ (Borggreve, 1889), which has previously proved useful for establishment of age–depth relationships in surface peat
(Ohlson & Dahlberg, 1991; Økland & Ohlson, 1998; Ohlson et al., 2001; Gunnarsson et al., 2008). Care was taken to avoid compaction of peat during sampling. Peat cores were dried at 80°C to constant mass and weighed to obtain bulk density.
Comparable subsets of dated peat cores from the earlier and recent time periods were obtained by only accepting cores satisfy-ing the followsatisfy-ing three criteria. (1) Only pines rooted on hum-mock-level peat were included because lower level positions are outside the long-term tolerance range of Scots pine (Ohlson, 1995, 1999). Hummock level was defined as comprising the uppermost two levels along the five-level hydrotopographical gradient from carpet, via lower lawn, upper lawn and lower hummock, to upper hummock levels (see Ohlson & Økland (1998) for characterization and definitions). (2) Only peat cores with a dated age from 3 to 17 yr were included. Older peat cores were excluded from the 1995 data set because pines older than 17 yr were absent in 2012 as a result of the exhaustive sampling of all pines in the study area car-ried out in 1995. Peat cores younger than 3 yr old were excluded because the variance of estimated peat accumulation rates increases with decreasing time period over which the sample integrates Sphagnum and peat growth (see Økland & Ohlson, 1998). (3) Only peat cores from sites with a totalSphagnumcover≥50% were included. This criterion was applied to reduce variability in the data attributable to local environmental conditions and interactions betweenSphagnummosses and other plants, which are known to affect peat growth rates strongly (Ohlson & Økland, 1998; Ohlson et al., 2001). Moreover, this criterion also improved comparability between the two time periods because the 50%Sphagnum cover criterion could be applied in exactly the same way to data collected Research
in 1995 and 2012. A subset of 35 and 74 peat samples collected in 1995 and 2012, respectively, satisfied all three criteria, giving a total of 109 peat cores that make up the data set used for all further analyses to represent peat and C accumulation rates in the earlier and recent time periods.
Peat growth and C accumulation variables (Table 1) were calcu-lated from peat depth, peat age, sample volume, dry weight, and C concentrations. Our calculations of peat mass and C accumulation rates follow Ohlson & Økland (1998) and Gunnarsson et al. (2008). When calculating the vertical peat growth rates, we did not compensate for peat compaction processes through physical consolidation and biological decomposition. The reason for this is that all 109 peat cores in the data set were≤17 yr old, which is too short a time span for compaction processes to become significant (see Økland & Ohlson, 1998). Total C and N concentrations have previously been determined for the 35 peat cores represent-ing the earlier time period (Ohlson & Økland, 1998). For the peat cores collected in 2012, a random subset of 15 cores were ground with a mill and subjected to determination of total C and N con-centrations by dry combustion as described by Nelson (1982) and Bremner (1982), using a LECO EC12 Carbon Content Analyser (LECO Corp., St Joseph, MI, USA).
Vegetation analyses
For each peat core sampled in 1995 and in 2012, one quadrat of 25925 cm was located with the pine in the centre. In each quadrat, the percentage cover of allSphagnumspecies and (collec-tively) of each of Cladonialichens, hepatics and vascular plants was determined. Each quadrat was characterized as belonging to the upper or lower hummock level along the hydro-topographical gradient related to the depth to the ground-water table using cri-teria based on species composition, as given by Økland (1989); and to one or more of five dominance types according to Økland & Ohlson (1998) and Ohlson & Økland (1998):Cr,He,Sf,Sm
and Sr denote cover >25% of Cladoniaspp., hepatics (all
spe-cies),S. fuscum,Sphagnum magellanicumBrid., andS. rubellum, respectively.
Climate and N deposition in the study period
Data from meteorological stations close to the study area (<20 km distance) were used to estimate temperature and
precip-itation differences between the two periods 1978–1995 and
1995–2012. The meteorological data were obtained from the
Norwegian Meteorological Institute (http://www.eklima.no), originating from the following stations (the time period in which the station was in operation is given in brackets after the station name): Høland-Kollerud (1978–1988), Høland-Løken (1988–
1990), Høland-Fosser (1991–2007), and Aurskog II (2007–
2012). Meteorological data are missing for 1988 and 1991. Data on measured total N deposition levels for the 50950 km grid cell in which the study area is situated were obtained from Tørseth & Pedersen (1994), Tørseth & Semb (1997), Hole & Tørseth (2002), Aaset al.(2006) and Aas (2012).
Statistical analyses
Vertical peat growth rate (cm yr1), bulk density (g dm3) and C
accumulation rate (g m2yr1), recorded for data collected in
2012 and representing peat accumulation in the recent time period, were used as response variables in generalized linear mod-els (GLMs; Venables & Ripley, 2002) with identity link and nor-mally distributed errors (ANOVA, ANCOVA, and linear regressions). Peat age (yr), totalSphagnumcover (%), hummock zone (factor-type variable with two levels: lower and upper) and dominance type (factor-type variable with five levels) were included as predictor variables in first-generation models for each response variable, obtained in order to assess the importance of, and eventually partial out, fine-scale environmental variables.
Fig. 1The study site, Søndre
Kisselbergmosen, is an asymmetrically raised bog located in south-east Norway, close to the border with Sweden. The black rectangle on the aerial photograph shows the position and approximate size of the 400-m2study area (i.e. 20920 m). The photograph is
Multi-predictor models were constructed by two selection proce-dures used in parallel to compare ‘nested models’: a forward selection procedure using the F-ratio test (significance level
a=0.05) and the Akaike information criterion (AIC). Peat age
was tested as the first variable and included in models whenever significant in order to avoid responses being confounded by the effects of the growing pine and/or temporal variation in peat accumulation rates (Ohlson & Økland, 1998). Thereafter, pre-dictors were added sequentially until no predictor could be added that explained significant amounts of residual variation or caused a drop in AIC. (The term ‘nested models’ is used for two models with different numbers of predictor variables, the more complex model containing all variables included in the simpler model.) The same final models were obtained with both selection meth-ods and only results obtained by the forward selectionF-tests are therefore shown. Diagnostic plots (Crawley, 2013) were used for graphical assessment of whether modelling assumptions were met and whether models were adequately specified.
Differences in peat accumulation variables between the earlier and recent time periods (1978–1995 and 1995–2012) were
modelled as the marginal effect of the categorical (factor-type) predictor sampling period (with two levels), added to the best first-generation GLM models. Confounding effects of differences in natural conditions between the two data sets obtained in the two sampling periods were thus reduced to a minimum. Differ-ences in N concentrations between the two periods were also modelled by GLM, using peat age as a covariate.
Because Levene’s tests (Levene, 1960) of response variables (bulk density, C accumulation rate and vertical peat growth rate) for variance inhomogeneity between sampling years were signifi-cant, all response variables were log-transformed before GLM analyses in order to meet the assumption of variance homogene-ity. For all response variables, assumptions of independent errors, linearity, homogeneity of variances and no multicollinearity between predictors were met and case-wise diagnostics revealed no single observations, or subset of observations, with unduly high influence on modelling results.
Student’st-tests were used to test for differences in tempera-ture and precipitation between the earlier and recent time peri-ods. All statistical analyses were performed in R, version 2.15.1 (The R Development Core Team, 2010).
Results
Climate and N deposition in the earlier and recent time periods
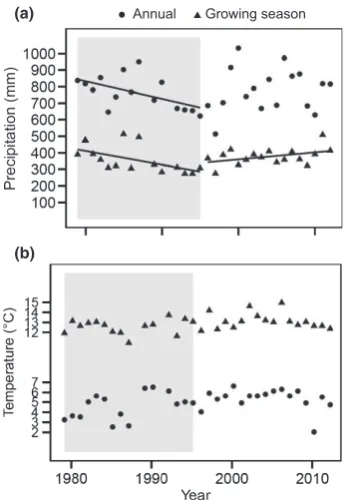
Temperature and precipitation were highly variable over the entire study period. For example, the average annual temperature varied from c. 2°C in 2010 to 6°C in 2000, and the average
annual precipitation varied by a factor of 2, fromc. 500 mm in 1997 to 1000 mm in 2000. Both the highest and lowest annual averages for temperature and precipitation occurred in the recent time period. Interestingly, the precipitation levels during the growing season showed a significant increasing trend over the recent time period and a declining trend over the earlier period, which means that the peat samples that were collected in 1995, representing the earlier time period, were collected at the end of a 17-yr period that was characterized by decreasing precipitation during the growing season, while the opposite was the case for the samples collected in 2012 (Fig. 2a). No clear trends in tem-perature were observed in any of the time periods, although the average annual temperature in the recent period was slightly higher than for the earlier period; 5.3 vs 4.6°C, respectively
(GLM:F1,30=3702;P=0.0639; Fig. 2b).
Nitrogen deposition peaked at 15 kg ha1yr1in the middle
of the 1980s and declined rapidly over the next decade. By 2012, deposition was c. 8 kg ha1yr1and the studied peatland thus received significantly more airborne N in the earlier than in the recent time period (Fig. 3).
Relationships between peat accumulation rates and predictor variables for the recent time period 1995–2012
Single-variable GLMs revealed a significant increase in vertical peat growth rate with increasing totalSphagnumcover, and a sig-nificant decrease with increasing peat age (Table 2). No signifi-cant relationships between C accumulation rate and any of the predictor variables were found. However, bulk density was signif-icantly higher in lower than in upper level hummocks, and decreased with increasing Sphagnum cover (Table 2). The best multiple-predictor models for vertical peat growth rate and bulk density both included two significant predictors, of which Sphagnumcover was one (Table 3).
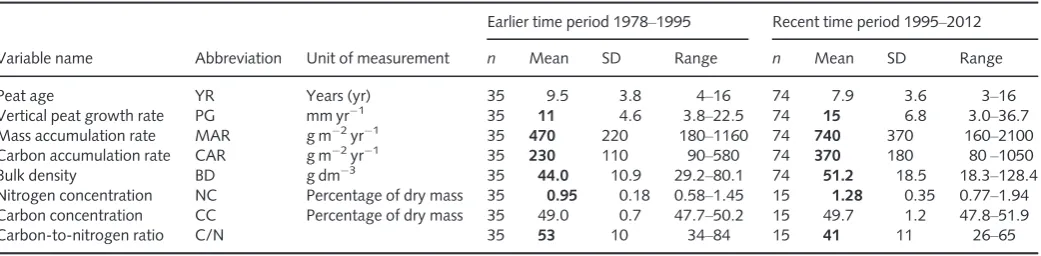
Table 1 Summary statistics for peat accumulation variables recorded at Søndre Kisselbergmosen for the earlier and recent time-periods
Variable name Abbreviation Unit of measurement
Earlier time period 1978–1995 Recent time period 1995–2012
n Mean SD Range n Mean SD Range
Peat age YR Years (yr) 35 9.5 3.8 4–16 74 7.9 3.6 3–16
Vertical peat growth rate PG mm yr1
35 11 4.6 3.8–22.5 74 15 6.8 3.0–36.7
Mass accumulation rate MAR g m2
yr1
Nitrogen concentration NC Percentage of dry mass 35 0.95 0.18 0.58–1.45 15 1.28 0.35 0.77–1.94
Carbon concentration CC Percentage of dry mass 35 49.0 0.7 47.7–50.2 15 49.7 1.2 47.8–51.9
Carbon-to-nitrogen ratio C/N 35 53 10 34–84 15 41 11 26–65
Figures in bold are significantly different atP<0.05. Research
Increasing peat accumulation and peat N concentration from the earlier to the recent time period
Vertical peat growth rates and C accumulation rates were signifi-cantly higher in the recent time period than in the earlier period.
The mean (SD) vertical peat growth rate increased byc. 40% from the earlier to the present time period, from 1.10.5 to 1.50.7 cm yr1, and the mean C accumulation rate increased
byc. 60%, from 230110 to 370180 g m2yr1(Fig. 4).
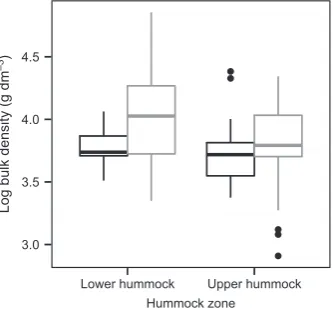
Peat cores from the lower hummock zone had the highest bulk density, and cores from the recent time period generally had higher bulk densities than cores from the earlier period. Actually, the mean bulk density increased byc.16% from the earlier to the recent time period, that is, from 4411 to 5118 g dm3 (Fig. 5). Mean N concentration, after variation attributable to peat age had been compensated for, was significantly higher in the peat cores from the recent time period (1.280.35%) than in the cores from the earlier period (0.950.18%) (Fig. 6).
Discussion
Our most important result is the increase in vertical peat growth and C accumulation from the earlier to the recent 17-yr period. This result is directly relevant to assessment of future changes in peatland dynamics and biogeochemistry because Sphagnum growth and C accumulation in peatlands are determined by inter-actions between N deposition and climatic factors such as tem-perature and precipitation (Gerdol et al., 2007; Limpens et al., 2011; Larmolaet al., 2013).
Being observational, our study does not, unfortunately, allow separation of the relative roles of climate change vs declining N deposition as drivers of the observed increase in peat growth and C accumulation. There are, however, no indications in our mate-rial that temperature change or variability is a key factor for the observed increased in peat accumulation, as consistent tempera-ture differences were not observed between the earlier and recent time periods (temperatures were variable among years in both time periods and no significant trends were observed; see Fig. 2b). However, the fact that sets of contemporary decadal peat growth rate estimates obtained using the pine method are strongly influenced by peat growth conditions in the years just before sampling (Ohlson & Økland, 1998; Ohlsonet al., 2001) raises the possibility that lower-than-average precipitation in 1992–1995 and higher-than-average precipitation in 2011 and
2012 (Fig. 2a) may have accentuated the difference in peat growth and C accumulation rates between the earlier and recent time periods by bringing about between-period differences in the mean ground-water table. In this context, it is of particular inter-est that recent eddy covariance measurements of CO2fluxes in
peatland ecosystems strongly support the importance of annual and inter-annual water table fluctuations as drivers of both pho-tosynthesis and respiration (Flanagan & Syed, 2011; Peichlet al., 2014).
Lower N load and wetter conditions
N deposition at our study site reached the historically highest lev-els ofc. 15 kg ha1yr1 in the middle of the 1980s, which are relatively low levels by European standards (Bragazza et al., 2004). This raises the question of whether, and to what degree, N deposition has had negative effects onSphagnumproductivity
● ●
●
● ●
● ●
8 9 10 11 12 13 14 15
1978−1982 1983−1987 1988−1992 1992−1996 1997−2001 2002−2006 2007−2011 Period
Total N deposition rates (kg ha
—1
yr
—1
)
Fig. 3Total nitrogen (N) deposition during the time span from 1978 to 2011 at the peatland study site Søndre Kisselbergmosen in south-east Norway.
(a)
(b)
Annual Growing season
and C accumulation in the study area. Setting ecosystem-level critical N loads for peatlands is challenging (Sheppard et al., 2014), and we do not know whether the loads on our site have actually exceeded critical levels and, if so, for how long. However, Bragazza et al. (2004) suggest a critical N load in Europe of 10 kg ha1yr1 above which Sphagnum mosses change from being N-limited to being co-limited by P+K. If this critical level
applies to our study site, the first half of the earlier time period, 1979–1995, was characterized by N loads that were at, or above,
the critical level, while N loads were below this level for the entire recent time period (see Fig. 4). Interestingly, a 3-yr15N addition experiment at Søndre Kisselbergmosen that was performed at the beginning of the recent time period (1997–1999), and only a few
hundred metres from our present study site, showed that an addi-tion of 40 kg N ha1yr1increased the N content in surface peat at depths of 5 and 10 cm, but not at depths of 20 and 40 cm, indicating that livingSphagnummosses and surface peat still had the capacity to take up large quantities of N and thereby function as an N filter (Nordbakken et al., 2003). This is solid evidence that the studied peatland ecosystem was not N saturated in the earlier time period, and that the loads of deposited N have so far not forced the system beyond critical thresholds.
Given that our study site was exposed to lower N loads in the recent than in the earlier time period, it was very unexpected to
find significantly higher N concentrations in surface peat depos-ited in the recent period than in that deposdepos-ited in the earlier period. We can offer no obvious explanation for this result. How-ever, a possible reason for this apparent paradox may be that a proportionally larger part of the surface peat representing the recent time period was made up of living and photosynthetically activeSphagnumtissue, which is known to have generally higher N concentrations than the dead tissues below (Damman, 1978; Johnson & Damman, 1993). A likely reason for why proportion-ally more living tissue was present in the peat samples represent-ing the recent time period is that the ground-water level was relatively high in the years before the sampling in 2012, which in turn may have resulted inSphagnumhummocks that were lusher in 2012 compared with the situation in 1995, when the peat cores for the earlier time period were sampled. A transition to wetter conditions in our study area is also indicated by the general decrease in the relative abundance of the upper hum-mock-level plant species Empetrum nigrum L. and Calluna vulgaris(personal observation by the corresponding author), and an increase inRhynchospora alba(L.) Vahl, which is an indicator of high ground water in the peatland (see Økland, 1989; Ohlson & Malmer, 1990). A hydrologically driven positive growth response in theSphagnummosses at the hummock level following theE. nigrumandC. vulgarisdecline may also be an explanation
Table 2 Summaries of generalized linear models (GLMs) with identity link function and normal error distribution for the influence of single predictor variables on three peat accumulation variables (see Table 1 for explanation of response variables) recorded at Søndre Kisselbergmosen for the time period 1995–2012
Response variable Predictor df R2 F P(F) Coefficient Intercept AIC
PG Age 1 0.11 9.0 0.0038 0.062 2.013 148.75
Sphagnumcover 1 0.12 9.9 0.0025 0.021 0.105 147.92
Factor (zone) 1 0.03 2.2 0.1427 0.250 1.351 155.20
Factor (domT) 4 0.06 1.2 0.3311 158.56
CAR Age 1 0.02 1.6 0.2148 0.074 4.265 303.53
Sphagnumcover 1 0.01 0.9 0.3471 0.018 2.272 304.21
Factor (zone) 1 <0.01 <0.1 0.8248 0.101 3.752 305.08
Factor (domT) 4 0.07 1.2 0.3139 306.10
BD Age 1 0.01 0.9 0.3418 0.569 46.666 645.47
Sphagnumcover 1 0.09 7.1 0.0097 0.482 89.339 639.48
Factor (zone) 1 0.09 6.9 0.0103 11.738 59.247 639.60
Factor (domT) 4 0.04 0.7 0.5640 649.28
FandPrefer toF-tests of the change in deviance between nested models. df, model degrees of freedom (degrees of freedom for the residuals=73–df).
Regression coefficients for significant terms are given as treatment contrasts. For the factor-type predictor zone, the intercept provides the estimated mean for the lower hummock zone, while the coefficient gives the difference between estimated means for the lower and upper hummock zones. Factor-type predictor domT refers to vegetation dominance type (see the Materials and Methods section). AIC, Akaike information criterion.
Table 3 Statistical summaries of full generalized linear models (GLMs) with identity link function and normal error distribution for the influence of significant predictor variables on two peat accumulation variables recorded at Søndre Kisselbergmosen for the time-period 1995–2012
Response variable Predictors df R2 F P(F) Coefficient predictor 1 Coefficient predictor 2 Intercept AIC
PG Age+Sphagnumcover 2 0.20 8.8 <0.001 0.053 0.018 0.523 142.90
BD Sphagnumcover+factor (zone) 2 0.18 7.5 0.001 0.476 11.591 96.856 634.17
FandPrefer toF-tests of the change in deviance between nested models. df, model degrees of freedom (degrees of freedom for the residuals=101–df).
Regression coefficients for significant terms are given as treatment contrasts. See Table 1 for description of response variables. AIC, Akaike information cri-terion.
Research
for the increase in surface peat bulk density from the earlier to the recent time period. However, it is important to note that our peat cores represent surface peat at shallow depths in hummocks only, and that our results cannot be extrapolated to deeper peat layers and hollow communities, in which relatively wet condi-tions are likely to give rise to peat with a low bulk density.
Carbon accumulation rates in boreal peatlands
Our present results in combination with those of Ohlson & Økland (1998) clearly show that the peat accumulation process can be remarkably variable across fine spatial scales and that Sphagnum-dominated hummocks are capable of maintaining high rates of peat and C accumulation over several decades. As our results are based on material from a singleSphagnum -domi-nated peatland in south-east Norway, care must be taken in extrapolating the results to other peatlands in other parts of the boreal region. However, recent long-term eddy covariance mea-surements of net C exchange from other parts of the boreal region corroborate our finding that northern peatlands have func-tioned as strong C sinks over the last two decades. For example, a 12-yr record from a minerotrophic poor fen in northern Sweden shows that the fen was a sink for atmospheric CO2in each of the
12 study years, with a long-term average net ecosystem exchange (NEE) of58 g C m2yr1(Peichl et al., 2014). This figure is slightly higher than that reported for an ombrotrophic bog near Ottawa in Canada, in which an annual average NEE of 40 g C m2yr1was reported over a 6-yr study period (Roulet
et al., 2007), while measurements in a moderately rich forest fen in western Canada revealed a significantly larger value, that is, a 5-yr NEE average of 189 g C m2yr1 (Flanagan & Syed,
2011). Because the pine method does not take into account C losses from the peatland through respiration, our figures for C accumulation rates (i.e. averages of 230 and 370 g C m2yr1 for the earlier and recent 17-yr time periods, respectively) are −1.0
−0.5 0.0 0.5 1.0
1995
2012
Log peat growth rate (cm yr
—1
)
(a)
5 6 7
4 8 12 16
Peat age (yr)
Log carbon accumulation rate
(g m
—2
yr
—1
)
(b)
Fig. 4Relationships between vertical peat growth rate and peat age (a) and between carbon (C) accumulation rate and peat age (b) in the earlier and recent time periods. Generalized linear model (GLM) analysis of the total data set (i.e. the earlier and recent time periods taken together;
n=109) showed that both vertical peat growth and C accumulation
differed significantly between the earlier and recent time periods after the effect of peat age had been accounted for (F1,106=8.786,P=0.0038; and F1,107=21.389,P<0.0001, respectively).
3.0 3.5 4.0 4.5
Lower hummock Upper hummock Hummock zone
Log bulk density (g dm
—3
)
Fig. 5Box plot of peat core bulk density for lower and upper hummock zones in the earlier (black) and recent (gray) time periods. The box length indicates the interquartile range (IQR), the bottom of the box the 25th percentile (first quartile (q1)), the top of the box the 75th percentile (third quartile (q3)), and the horizontal line within the box the median value. The lower whisker corresponds to q1–1.5 IQR, or to the minimum estimate,
and the upper whisker corresponds to q3+1.5 IQR, or to the maximum
estimate. The circles denote values outside the whisker limits. Generalized linear model (GLM) analysis of the total data set showed significant differences in bulk density between the time periods after the effect of hummock zone had been accounted for (F1,106=5.126;P=0.0256).
−0.6 −0.3 0.0 0.3 0.6
4 8 12 16
Peat age (yr)
Log nitrogen concentration (%)
1995
2012
much larger than those obtained for NEE using eddy covariance measurements which quantify the net C exchange. Instead, our figures obtained using the pine method are in line with eddy covariance measurements of peatland gross ecosystem production (GEP), which averaged 336 g C m2yr1and varied from 203
to 503 g C m2yr1in the 12-yr study by Peichlet al.(2014).
We conclude that our results, in combination with those of other recent studies, suggest that northern peatlands have func-tioned as strong C sinks over the last few decades and that they can be expected to serve as sinks for large amounts of C in the future, thereby maintaining their important role in the global C cycle.
Acknowledgements
The study was supported by the Norwegian University of Life Sciences and we thank Barbro Dahlberg for assistance with the counting of year-rings in the Scots pine samples.
References
Aas W. 2012.Deposition of major inorganic compounds in Norway 2007–2011. Kjeller, Norway: The Norwegian Climate and Pollution Agency (Klif). Aas W, Hjellbrekke A-G, Hole LR, Tørseth K. 2006.Deposition of major inorganic compounds in Norway 2002–2006. Kjeller, Norway: Norwegian Institute for Air Research.
Aerts R, Wallen B, Malmer N. 1992.Growth-limiting nutrients in Sphagnum-dominated bogs subject to low and high atmospheric nutrient supply.Journal of Ecology80: 131–140.
Belyea LR, Malmer N. 2000.Carbon sequestration in peatland: patterns and mechanisms of response to climate change.Global Change Biology10: 1043–
1052.
Berendse F, Van Breemen N, Rydin H, Buttler A, Heijmans M, Hoosbeek MR, Vasander H, Wallen B. 2001.Raised atmospheric CO2levels and increased N deposition cause shifts in plant species composition and production in Sphagnumbogs.Global Change Biology7: 591–598.
Borggreve B. 1889.Uber die Messung des Wachstums von Hochmooren.€
Mitteilungen des Vereins zur F€orderung der Moorkultur im Deutschen Reiche7: 20–23.
Bragazza L, Buttler A, Habermacher J, Brancaleoni L, Gerdol R, Fritze H, Hanajik P, Laiho R, Johnson D. 2012.High nitrogen deposition alters the decomposition of bog litter and rduces carbon accumulation.Global Change Biology18: 1163–1172.
Bragazza L, Freeman C. 2007.High nitrogen availability reduces polyphenol content in Sphagnum peat.The Science of the Total Environment377: 439–443.
Bragazza L, Freeman C, Jones T, Rydin H, Limpens J, Fenner N, Ellis T, Gerdol R, Hajek M, Hajek Tet al.2006.Atmospheric nitrogen deposition
promotes carbon loss from peat bogs.Proceedings of the National Academy of Sciences, USA103: 19386–19389.
Bragazza L, Tahvanainen T, Kutnar L, Rydin H, Limpens J, Hajek M, Grosvernier P, Hajek T, Hajkova P, Hansen Iet al.2004.Nutritional
constraints in ombrotrophicSphagnumplants under increasing atmospheric nitrogen deposition in Europe.New Phytologist163: 609–616.
Breeuwer A, Heijmans M, Robroek BJM, Limpens J, Berendse F. 2008.The effect of increased temperature and nitrogen deposition on decomposition in bogs.Oikos117: 1258–1268.
Bremner CS. 1982.Nitrogen-total. In: Page AL, Miller RH, Keeiney DR, eds. Methods of soil analysis, Part 2, Agronomy 9. Madison, WI, USA: American Society of Agronomy, 595–624.
Clymo RS. 1984.The limits to peat bog growth.Philosophical Transactions of the Royal Society of London Series B–Biological Sciences303: 605–654.
Clymo RS, Hayward PM. 1982.The ecology of Sphagnum. In: Smith AJE, ed. Bryophyte ecology. New York, NY, USA: Chapman and Hall, 229–289.
Crawley MJ. 2013.The R book. Chichester, UK: Wiley.
Damman AWH. 1978.Distribution and movement of elements in ombrotrophic peat bogs.Oikos30: 480–495.
Dise NB. 2009.Peatland response to global change.Science326: 810–811.
Dorrepaal E, Cornelissen JHC, Aerts R, Wallen B, van Logtestijn RSP. 2005. Are growth forms consistent predictors of leaf litter quality and
decomposability across peatlands along a latitudinal gradient?Journal of Ecology 93: 817–828.
Flanagan LB, Syed KH. 2011.Stimulation of both photosynthesis and respiration in response to warmer and drier conditions in a boreal peatland ecosystem.Global Change Biology17: 2271–2287.
Gerdol R, Petraglia A, Bragazza L, Iacumin P, Brancaleoni L. 2007.Nitrogen deposition interacts with climate in affecting production and decomposition rates in Sphagnum mosses.Global Change Biology8: 1810–1821.
Gorham E. 1991.Northern peatlands: role in the carbon cycle and probable responses to climatic warming.Ecological Applications1: 182–195.
Granath G, Limpens J, Posch M, M€ucher S, De Vries W. 2014.Spatio-temporal trends of nitrogen deposition and climate effects on Sphagnum productivity in European peatlands.Environmental Pollution187: 73–80.
Granath G, Strengbom J, Rydin H. 2012.Direct physiological effects of nitrogen onSphagnum: a greenhouse experiment.Functional Ecology26: 353–364.
Gunnarsson U, Boresj€o Bronge L, Rydin H, Ohlson M. 2008.Near-zero recent carbon accumulation in a bog with high nitrogen deposition in SW Sweden. Global Change Biology14: 2152–2165.
Gunnarsson U, Malmer N, Rydin H. 2002.Dynamics or constancy inSphagnum dominated mire ecosystems? A 40-year study.Ecography25: 685–704.
Gunnarsson U, Rydin H. 2000.Nitrogen fertilization reduceSphagnum production in bog communities.New Phytologist147: 527–537.
Heijmans MMPD, Mauquoy D, van Geel B, Berendse F. 2008.Long-term effects of climate change on vegetation and carbon dynamics in peat bogs. Journal of Vegetation Science19: 307–320.
Hole LR, Tørseth K. 2002.Deposition of major inorganic compounds in Norway 1978–1982 and 1997–2001: status and trends. Kjeller, Norway: Norwegian Institute for Air Research.
Jassey VE, Chiapusio GE, Binet P, Buttler A, Laggound-Defarge F, De Laure F, Bernard N, Mitchell EA, Toussaint M-L, Francez E-Jet al.2013.Above- and
belowground linkages in Sphagnum peatland: climate warming affects plant–
microbial interactions.Global Change Biology19: 811–823.
Johnson LC, Damman AWH. 1993.Decay and its regulation inSphagnum peatlands.Advances in Bryology5: 249–296.
Larmola T, Bubier JL, Kobyljanec C, Basiliko N, Juutinen S, Humphreys E, Preston M, Moore TR. 2013.Vegetation feedbacks of nutrient addition lead to a weaker carbon sink in an ombrotrophic bog.Global Change Biology19: 3729–3739.
Levene H. 1960.Robust tests for equality of variances. In: Olkin I, Ghurye SG, Hoeffding W, Madow WG, Mann HB, eds.Contributions to probability and statistics: essays in honor of Harold Hotelling. Stanford, CA, USA: Stanford University Press, 278–292.
Limpens J, Berendse F. 2003.How litter quality affects mass loss and N loss from decomposing Sphagnum.Oikos103: 537–547.
Limpens J, Berendse F, Blodau C, Canadell JG, Freeman C, Holden J, Roulet N, Rydin H, Shaepman-Strub G. 2008.Peatlands and the carbon cycle: from local processes to global implications–a synthesis.Biogeosciences5: 1475–
1491.
Limpens J, Granath G, Gunnarsson U, Aerts R, Bayley S, Bragazza L, Bubier J, Buttler A, van den Berg LJL, Francez A-Jet al.2011.Climatic modifiers of the response to nitrogen deposition in peat-formingSphagnummosses: a meta-analysis.New Phytologist191: 496–507.
Malmer N, Wallen B. 1993.Accumulation and release of organic matter in ombrotrophic bog hummocks–processes and regional variation.Ecography16:
193–211.
Malmer N, Wallen B. 1999.The dynamics of peat accumulation in bogs: mass balance of hummocks and hollows and its variation throughout a millennium. Ecography22: 736–750.
Malmer N, Wallen B. 2004.Input rates, decay losses and accumulation rates of carbon in bogs during the last millenium: internal processes and environmental change.Holocene14: 111–117.
Research
Moen A. 1998.National atlas of Norway: vegetation. Hønefoss, Norway: Norwegian Mapping Authority.
Nelson LE. 1982.Total carbon, organic carbon and organic matter. In: Page AL, Miller RH, Keeiney DR, eds.Methods of soil analysis, Part 2, Agronomy 9. Madison, WI, USA: American Society of Agronomy, 539–579.
Nordbakken J-F, Ohlson M, H€ogberg P. 2003.Boreal bog plants: nitrogen sources and uptake of recently deposited nitrogen.Environmental Pollution 126: 191–200.
Nordin A, Gunnarsson U. 2000.Amino acid accumulation and growth of Sphagnumunder different levels of N deposition.Ecoscience7: 474–480.
Norwegian Meteorological Institute. 2013. [WWW document] URL www.eklima.no [accessed 2 June 2014].
Ohlson M. 1995.Growth and nutrient characteristics in bog and fen populations of Scots pinePinus sylvestris.Plant and Soil172: 235–245.
Ohlson M. 1999.Differentiation in adaptive traits between neighbouring bog and mineral soil populations of Scots pinePinus sylvestris.Ecography22: 178–
182.
Ohlson M, Dahlberg B. 1991.Rate of peat increment in hummock and lawn communities on Swedish mires during the last 150 years.Oikos61: 369–378.
Ohlson M, Malmer N. 1990.Total nutrient accumulation and seasonal variation in resource allocation in the bog plantRhynchospora alba.Oikos58: 100–108.
Ohlson M, Økland RH. 1998.Spatial variation in rates of carbon and nitrogen accumulation in a boreal bog.Ecology61: 2745–2758.
Ohlson M, Økland RH, Nordbakken J-F, Dahlberg B. 2001.Fatal interactions between Scots pine andSphagnummosses in bog ecosystems.Oikos94: 425–
432.
Økland RH. 1989.A phytoecological study of the mire Northern
Kisselbergmosen, SE. Norway. I. Introduction, flora, vegetation and ecological conditions.Sommerfeltia8: 1–172.
Økland RH, Ohlson M. 1998.Age–depth relationships in Scandinavian surface
peat: a quantitative analysis.Oikos82: 29–36.
Økland RH, Økland T, Rydgren K. 2001.A Scandinavian perspective on ecological gradients in north-west European mires: reply to Wheeler and Proctor.Journal of Ecology89: 481–486.
Pedersen U, Walker SE, Kibsgaard A. 1990.Deposition mapping of sulphur and nitrogen compounds in Norway. Lillestrøm, Norway: Norwegian Institute for Air Research.
Peichl M,Oquist M, L€ €ofvenius MO, Ilstedt U, Sagerfors J, Grelle A, Lindroth A, Nilsson MB. 2014.A 12-year record reveal pre-growing season temperature and water table level threshold effects on the net carbon dioxide exchange in a boreal peatland.Environmental Research Letters9: 055006.
Robroek BJM, Schouten MGC, Limpens J, Berendse F, Poorter H. 2009. Interactive effects of water table and precipitation on net CO2assimilation of three co-occurringSphagnummosses differing in distribution above the water table.Global Change Biology15: 680–691.
Roulet NT, Lafleur PM, Richard PJ, More TR, Humphreys ER, Bubier J. 2007. Contemporary carbon balance and late Holocene carbon accumulation in a northern peatland.Global Change Biology13: 397–411.
Rydin H. 1986.Competition and niche separation in Sphagnum.Canadian Journal of Botany64: 1817–1824.
Rydin H, Jeglum JK. 2013.The biology of peatlands,2ndedn. New York, NY, USA: Oxford University Press.
Sheppard LJ, Leith ID, Mizunuma T, Leeson S, Kivim€aki S, Cape JN, van Dijk D, Leaver D, Sutton MA, Fowler Det al.2014.Inertia in an ombrotrophic
bog ecosystem in response to 9 years’ realistic perturbation by wet deposition of nitrogen, separated by form.Global Change Biology20: 566–580.
The R Development Core Team. 2010.R: a language and environment for statistical computing. Vienna, Austria: R Foundation for Statistical Computing. Tørseth K, Pedersen U. 1994.Deposition of sulphur and nitrogen compounds in
Norway 1988–1992. Kjeller, Norway: Norwegian Institute for Air Research. Tørseth K, Semb A. 1997.Deposition of major inorganic compounds in Norway
1992–1996. Kjeller, Norway: Norwegian Institute for Air Research. Turunen J, Roulet NT, Moore TR, Richard PJH. 2004.Nitrogen deposition
and increased carbon accumulation in ombrotrophic peatlands in eastern Canada.Global Biogeochemical Cycles18: GB3002.
Venables DN, Ripley BD. 2002.Modern applied statistics with S. New York, NY, USA: Springer.
Vitt DH, Halsey LA, Bauer IE, Campbell C. 2000.Spatial and temporal trends in carbon storage of peatlands of continental western Canada through the Holocene.Canadian Journal of Earth Sciences87: 683–693.
Weedon JT, Aerts R, Kowalchuk GA, van Logtestijn R, Andringa D, van Bodegom PM. 2013.Temperature sensitivity of peatland C and N cycling: does substrate supply play a role?Soil Biology & Biochemistry61: 109–120.
Wiedermann MM, Gunnarsson U, Nilsson MB, Nordin A, Ericson L. 2009. Can small-scale experiments predict ecosystem responses? An example from peatlands.Oikos118: 449–457.
Wiedermann MM, Nordin A, Gunnarsson U, Nilsson MB, Ericson L. 2007. Global change shifts vegetation and plant parasite-interactions in a boreal mire. Ecology88: 454–464.
Wu J, Roulet NT. 2014.Climate change reduces the capacity of northern peatlands to absorb the atmospheric carbon dioxide: the deifferent responses of bogs and fens.Global Biochemical Cycles27: 1005–1024.