STUDY ON LAND-USE AND LAND COVER CHANGE (LUCC) AND GREEN HOUSE GAS (GHG) EMISSION
Lilik B. PRASETYO*, Genya SAITO**, Haruo TSURUTA**, Shigeto SUDO**, Daniel MURDIYARSO*, Upik ROSALINA*
* Bogor Agriculture University
** National Institute of Agro-Environmental Sciences
Time series of Landsat imagery of Pasir Mayang, Jambi-INDONESIA from 1993 – 2000 were utilized to investigate the magnitude of LUCC. The analysis result was integrated with biomass survey and GHG emission measurement. Simple up-scaling method was applied to estimate the above ground biomass loss and soil surface GHG emission. Result showed that LULC caused biomass decrease and GHG emission increase.
Key words : LUCC, GHG, Aboveground Biomass
BACKGROUND
Deforestation, conversion of forest into non-forest land cover, have been occurring at a dramatic scale around the world. It was estimated that the tropical forest was deforested by 6 – 16.8 million hectares per year (Grainger, 1993; Barbier et al, 1991; Myers, 1994). Based on data comparison in 1985 (RePPProT, 1985) and in 1997 (Dept. of Forestry, 1997), three main islands of Indonesia(Sumatera, Kalimantan and Sulawesi) have loss its forest for about 20.24 million hectares or 1.6 million hectares per year (2.26 % per year).
Since forest hold most carbon in terrestrial ecosystem, the loss of forest will significantly contribute to the increase of atmospheric carbon dioxide. Moreover, deforestation (land-use/land cover changes) also results in emission changes of other greenhouse gases, such as carbon dioxide, nitrous oxide and methane. However, there is considerably uncertainty in the
estimating the amount of GHG emission to the atmosphere within specific area are part of important issues within IPCC.
The research aimed at regional estimation of aboveground carbon stock, its conversion into GHG through biomass burning and soil surface green house gas emission changes, using combination of Geographical Information System and Remote Sensing. As a case study land-use/land cover change between 1993 to 2000 of Pasir Mayang, Jambi Province, Indonesia will be evaluated.
II. STUDY AREA
The study area is located in Jambi Province, between 0o 45’ and 2o’00 latitude south; 101o 30 and 102o30’ longitude east (Fig. 1). The total area is about 89,697 hectares
III. METHODS
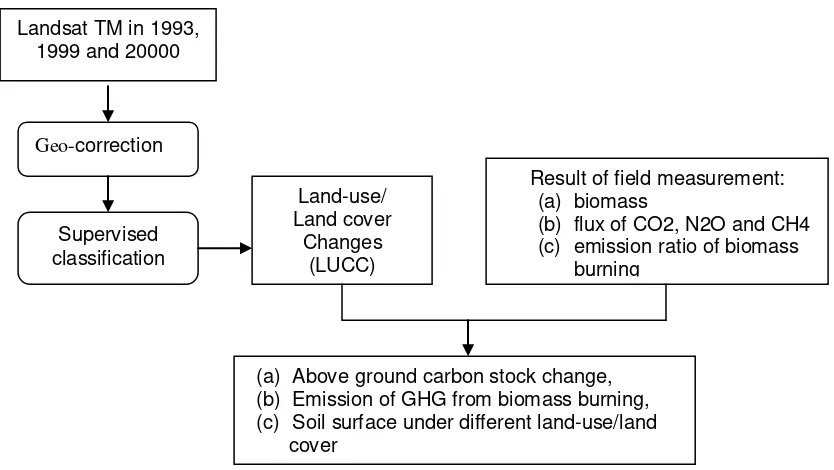
3.1. Landsat images interpretation
taken in 1993,1999 and 2000 were processed individually to produce land-use and land cover change. Standard procedure of image rectification and supervised classification was performed. Due to clouds and shadows interfere, land-use and land cover data in 1999 and 2000 were merged in order to get better information. Finally, information on aboveground carbon stock, emission ratio, and flux of GHG (Methane, Carbon dioxide and Nitrous oxide) from field measurement were combined for estimating above ground stock changes, emission of GHG from biomass burning and emission of GHG from soil surface under different land-use/land cover.
3.2. Aboveground carbon stock data
Sample materials of the vegetation component were collected. The vegetation component taken from the tree stage (dbh > 30 cm) and pole stage (dbh 10 - 29.99 cm) were leaves, branches, twigs, stem woods, stem barks and roots. Whereas, for sapling (dbh 3 - 9.99 cm) and seedling stages
(height 1.5 m) the vegetation components are mainly leaves, stems and Land-use/
Land cover Changes
(LUCC) Landsat TM in 1993,
1999 and 20000
Geo-correction
Supervised classification
Result of field measurement: (a) biomass
(b) flux of CO2, N2O and CH4 (c) emission ratio of biomass
burning
[image:3.612.112.529.291.526.2](a) Above ground carbon stock change, (b) Emission of GHG from biomass burning, (c) Soil surface under different land-use/land cover
roots. All materials taken from the plot were chemically analyzed in the laboratory.
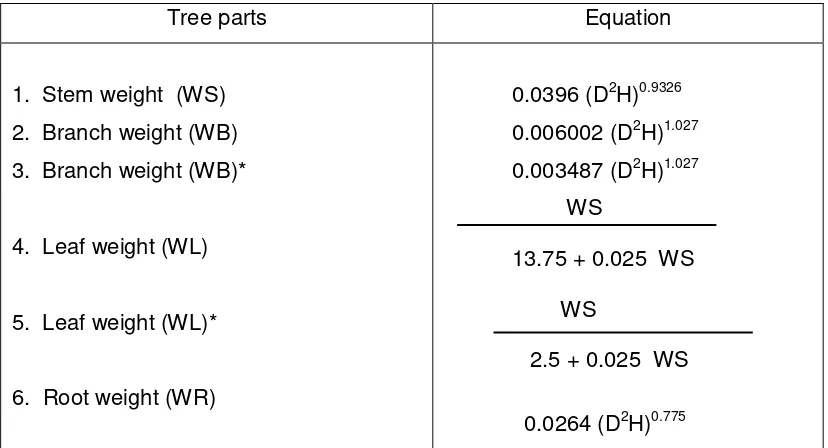
[image:4.612.113.527.287.511.2]Weight of sample components of the tree and pole i.e. stems, branches, twigs, leaves and roots were estimated by using equation developed by Kira and Iwata (1989) Table 1. Tree biomass for one-hectare plot was calculated by multiplying biomass of each tree with the number of tree per hectare. The same method is applied for poles, saplings and seedlings.
Table 1. Alometric function for calculating biomass of tree and pole.
Tree parts Equation
1. Stem weight (WS) 2. Branch weight (WB) 3. Branch weight (WB)*
4. Leaf weight (WL)
5. Leaf weight (WL)*
6. Root weight (WR)
0.0396 (D2H)0.9326 0.006002 (D2H)1.027 0.003487 (D2H)1.027 WS
13.75 + 0.025 WS
WS
2.5 + 0.025 WS
0.0264 (D2H)0.775 Source :
Kira, Tatuo and Keiji Iwata. 1989. Nature and Life in Southeast Asia Volume IV, 1989. Fauna and Flora Research society, Kyoto, Japan.
Notes : Weight = kg, D = diameter (cm), H = height (m), * = for pole stage
3.3. Soil Greenhouse gases flux measurement.
analyzed air samples collected using closed-chamber method at 10 – minute intervals. The Flux density is calculated as follows (Khalil et. al., 1991).
V (M/NoA) (dC/dt) x 6 x 10 -5
=Methane, Nitrous oxide or carbon dioxide flux (mg/m2/hr), = Air density
(mol/m3), V = Chamber volume (m3), M = gas molecular weight (g/mole),
A = Chamber basal area (m2), dC/dt = emission rate (ppbv/minute), obtained from
consecutive measurement.tain the estimates of diurnal emissions
Soil GHG emission were conducted by Impact Center of South East Asia,
National Institute of Agro-environmental Sciences, Japan; Forestry and Forest Product Institute, Japan; and National Institute for Resources and Environment, Japan.
IV. RESULT AND DISCUSSION
4.1. Land-use/ land cover and above ground carbon stock changes
Figure 3a and 3b, show land-use/land cover patterns in 1993 and 2000, Quantitative comparison of the LUCC and above ground carbon stock is presented in Table 2.
Table 2 . Above ground carbon stock changes in Pasir Mayang between 1993 – 2000
Land-use/Land cover
Carbon stock per ha
(ton)
Area (ha)
Total above ground Carbon stock in
(ton)
1993 2000 1993 2000
Logged forest 155.2 63435.75 48121.00 9845228.40 7468379.20 Bush/Shrubs
(fallow land)
15.0
9815.50 11334.00 147232.50 170010.00
Rubber and secondary Vegetation (rubber jungle)
35.5
6304.25 15764.00 223800.88 559622.00
Grasslands 6.0 3077.75 1416.00 18466.50 8496.00
Barelands 0.0 932.75 7175.75 0.00 0.00
Water body 0.0 1886.75 1642.00 0.00 0.00
Between 1993 – 2000, logged forest and Grassland area decreased of about 15,314.75 ha and 1,661.75 ha respectively. Meanwhile rubber jungle and fallow land increased 9,459.75 ha and 1,518.50 ha, respectively. Due to this, total net above ground carbon stock of the area decreased from 10.23 million ton to 8.20 million ton, or have loss of about 2.02 ton. Most of carbon loss originated from deforestation (2.3 million ton), while carbon stock recovery came from the growth of rubber and secondary vegetation (0.34 million ton).
IPCC have divided the loss of aboveground carbon content into on site and off-site release. These two categories were classified further into direct burning (fuel wood and slash and burn agricultural) and decomposition process release of unburned biomass (Houghton et.al., 1996). Thus, the amount of carbon loss does not represent the amount carbon released into the atmosphere. Some amount of carbon which was lost due to direct burning (in-site burning) was released directly, however, part of carbon was released
slowly through decomposition process. In the case of charcoal decomposition process will take time of about hundreds years (Houghton, et al, 1996).
To estimate carbon released directly from forest fire into the atmosphere, some assumption were made, as follows :
(a) 50 of biomass of forest were removed from the site before forest burn (b) emission ratio per CO2 of secondary forest fire for CO, CH4, N2O,
CH3Cl, CH3Br and CH3I are 0.265, 0.0093, 0.000061, 0,0000001, and 0, respectively.
(c) Gas conversion ratio from dry matter C to CO2 is 0.5
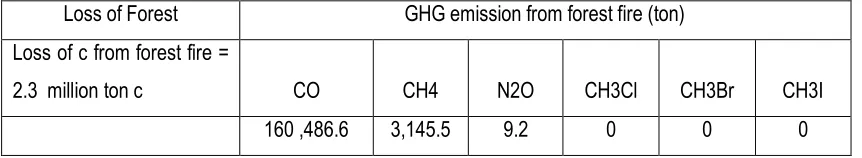
Table 3. GHG emission from forest fire
Loss of Forest GHG emission from forest fire (ton)
Loss of c from forest fire =
2.3 million ton c CO CH4 N2O CH3Cl CH3Br CH3I
160 ,486.6 3,145.5 9.2 0 0 0
4.2. Soil greenhouse gas emission changes
[image:7.612.107.547.440.623.2]There is diurnal and seasonal variation of green house gas flux of soil The comparison below were made based on the average value of flux measurement conducted in November 1997 in several sites of Jambi province. The calculation results of total flux based on 1993 and 1995 land-use/land cover data for major land-land-use/land cover presented in Table 4.
Table 4 . Soil greenhouse gases emission changes in Pasir Mayang between 1993 – 2000
Land-use/Land cover
Carbon Dioxide
(ton/hour)
Nitrous Oxide
(kg/hour)
Methane
(kg/hour)
1993 2000 1993 2000 1993 2000
Logged forest 233.467 178.482 7.102 5.429 -9,496.294 -7,259.752
Bush/Shrubs (fallow lands) 58.156 67.100 2.000 2.307 -4.406 -5.084
Rubber and
Secondary vegetation (Rubber jungle)
30.348 75.917 1.301 3.254 -1.282 -3.206
Grasslands 18.870 8.724 0.344 0.159 0.000 0.000
Bare lands 6.085 45.863 0.131 0.987 -72.252 -5,444.252
Total 346.927 376.085 10.878 12.136 -9,574.234 -7,812,596
V. CONCLUSSION
Land-use/land cover changes in Jambi between 1993 to 2000 results in the loss of carbon about 2.07 millions ton, especially came from logged forest area reduction. In addition, the process also gave impacts on greenhouse gases flux of soil surface. There was an increase emission of carbon dioxide (CO2) and Nitrous oxide (N2O), meanwhile reduction in methane absorption. This finding reinforce the urgent need to conserve tropical rain forest, in order to reduce/ slow down the increase rate of atmospheric greenhouse gases concentration.
ACKNOWLEDGEMENT
Authors would like to thanks to Environmental Agency of Japan for
the research funding.
REFERENCES
Barbier, E.B., Joanne C.B. and A. Markandya. 1991. he economical deforestation. Ambio 20 (2) : 55-58
Dept. of Forestry. 1993. National Forest Inventory. Dept. of Forestry.
Grainger. A. 1993. Rates and deforestation in the humid tropics : estimates and measurement, The Geographical Journal, 159 (1) : 1583-1587. Tsuruta, Haruo. 1999. Annual report. 1999. NIAES
Holdgate, M. 1995. Greenhouse gas balance in forestry : Opening address to FRCC Conference. Forestry 68 (4) : 297 – 302
Houghton, J.T., et al. 1996. Greenhouse gas inventory reference Manual : page 5.1 – 5.74
Khalil, M.A.K., R.A. Rasmussen, M.X. Wang and L.Ren. 1991. Methane emissions from rice fields in china. Environ. Sci. Tech. 25: 979-981 Kira, Tatuo and Keiji Iwata. 1989. Nature and Life in Southeast Asia Volume
IV, 1989. Fauna and Flora Research society, Kyoto, Japan.