Climate variability is a threat to food production. Typhoons, floods, and droughts caused 82.4% of the total Philippine rice losses from 1970 to 1990. In 1990 alone, domestic losses due to climatic constraints amounted to US$ 39.2 million. Weather aberrations, climatic fluctuations such as El Niño, and the growing concern for their effects on agriculture have stimulated academic, public and policy-level interests on the analysis of the impacts of climate variability on agricultural production systems. This paper is presented to discuss the agronomic impacts of climate variability on rice production in the Philippines. Long-term climate variability influences sowing date, crop duration, crop yield, and the management practices adapted in rice production. Short-term weather episodes can also affect yield by inducing changes in temperature, potential evapotranspiration, and moisture availability. The degree of vulnerability of crops to climate variability depends mainly on the development stage of the crops at the time of weather aberration. The vulnerability and risk of crop production due to weather fluctuations and climate variability can be minimized if future weather variation can be adequately predicted and a suitable process-based ecophysiological crop yield forecasting model can be identified to produce real-time yield forecasts. Scientists and farmers must join efforts to further understand crop–climate relationships and formulate viable, locally adapted production technologies that will address critical issues such as climate variability. © 2000 Elsevier Science B.V. All rights reserved.
Keywords:Climate variability; Rice production; Philippines; El Niño
1. Introduction
The concern on past, present and future weather aberrations, climate trends, and their effects on agri-culture has continued to stimulate research as well as public and policy-level interests on the analysis of climate variability and agricultural productivity (Matthews et al., 1996; IPCC, 1996). It is well re-cognized that climate variability has a wide range of direct and indirect impacts on crop production. In the
∗Corresponding author. Fax:+63-49-536-2402.
E-mail address:[email protected] (F.P. Lansigan).
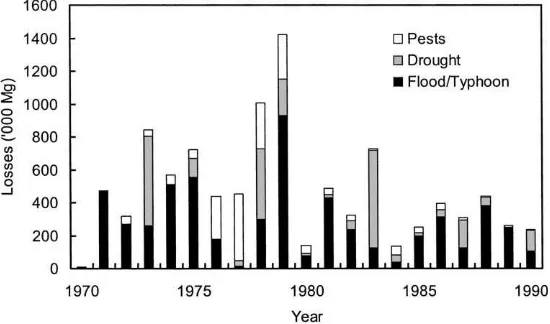
Philippines, typhoons, floods, and droughts caused 82.4% of the total Philippine rice (Oryza sativa L.) losses from 1970 to 1990 (PhilRice-BAS, 1994) (Fig. 1). Weather and climate affect plant growth and development, and the fluctuations and occurrences of climatic extremes particularly at critical crop growth stages may reduce yield significantly (Satake and Yoshida, 1978; Peng et al., 1996).
Weather and climate have a direct influence on cropping systems and plant yield. Thus, weather fluctuations and climate variability play a significant role in crop growth and yield. Occurrence of abnor-mal weather episodes during the growing season or
Fig. 1. Annual losses (‘000 Mg) in Philippine rice production due to typhoons/floods, droughts, and pests from 1970 to 1990 (adapted from PhilRice-BAS, 1994).
during critical development stages may hamper growth processes resulting in yield reduction. This makes climate variability a threat to food production leading to serious social and economic implications (Geng and Cady, 1991; Hossain, 1997). However, a clear understanding of the vulnerability of food crops as well as the agronomic impacts of climate variabi-lity enable one to implement adaptive strategies to mitigate its negative effects.
This paper presents the agronomic impacts of cli-mate variability on rice production systems. These impacts are described based on results of systems-based studies and case examples in the Philippines. Key climate variables and measures of variability are examined. The analysis distinguishes the impacts of long-term weather variability and short-term weather episodes. Some adaptive strategies to climate variabi-lity to reduce vulnerabivariabi-lity and risk are also presented. Suggestions and recommendations for an efficient and effective analysis of agronomic impacts of climate variability are also discussed.
2. Key climatic variables
The occurrence of weather episodes such as ex-tremes characterized by maximum or minimum tem-perature, sequences of dry or wet days, and high winds particularly during occurrence of tropical cyclones (typhoons) may significantly affect crop growth and
development which results in reduced crop yield. In the Philippines, monsoon currents, tropical cyclones, and the inter-tropical convergence zone divide the year into wet and dry seasons. Many areas have rain from May to November, the peak amounts falling be-tween August and September. During the dry months (February–April), rainfall is generally deficient and some areas may experience drought. Climate variabi-lity can be readily observed from the fluctuations in rainfall, wind speed and direction, and temper-ature. Fluxes in rainfall volume below or above normal annual values may be experienced in areas affected by the anomaly. Similarly, shifts in tem-perature regimes in comparison with the tempera-ture range for specific periods of the year and/or across several years also indicate climate variabi-lity. Inter-annual variability in wind speed and direc-tion also reflect climate variability.
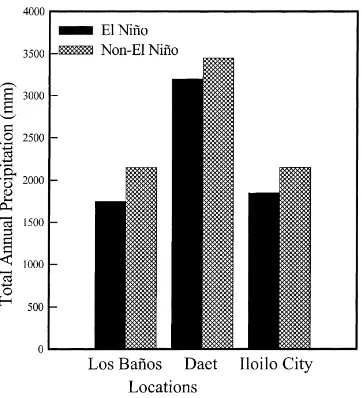
locations in the Philippines. The average annual precipitation values represent an average of annual rainfall during 1965–1966, 1968–1969, 1972–1973, 1977–1978, 1982–1983 and 1987 years when El Niño were experienced in the three test sites studied. The data used to represent the non-El Niño years were averages of annual precipitation between 1961 and 1990 with the exception of those El Niño years mentioned previously. The average difference among the three sites, between El Niño and non-El Niño years is about 400 mm of rainfall. The three test sites, Los Baños, Laguna in northern Philippines, Daet,
Fig. 2. Average annual precipitation (mm) during El Niño years (1965–1966, 1968–1969, 1972–1973, 1977–1978, 1982–1983 and 1987) and non-El Niño years between 1961 and 1990 at Los Baños, Laguna, Daet, Camarines Norte, and Iloilo City, Iloilo, Philippines.
cropping season which is determined largely by the start of the rainy season particularly in rainfed areas. For rice production in Los Baños, Philippines, land preparation starts as soon as the cumulative amount of rainfall for the last 30 days after April 1 (Julian day 91, historically the driest day in areas with climate characterized by pronounced wet and dry seasons in the Philippines) reaches 200 mm (Yoshida, 1981). It is during this period that the soil accumulates enough moisture to support plant growth. Fig. 3 shows the rela-tive frequency distribution of the mean sowing date for Iloilo City, Philippines (climate characterized by pronounced wet and dry seasons) during non-El Niño years and during El Niño years based on available his-torical weather data. During non-El Niño years, the relative frequency of the number of times the volume of cumulative rainfall reached 200 mm within 30 con-secutive days beyond Julian day 91 is most common on Julian day 173 based on available historical weather data. Except for Julian day 143, the probability of sow-ing date occurrsow-ing on Julian day 173 is three times the probability that sowing date will fall on any other date. During an El Niño year, mean planting time may occur as early as mid-May (Julian day 137) or may be delayed to mid-August (Julian day 229) depending on the degree of climate variability. The occurrence of an El Niño event is usually associated with drought in the Philippines, thus, sowing in affected areas is usually delayed.
3.2. Crop duration
Fig. 3. Relative frequency of sowing dates during El Niño years (1965–1966, 1968–1969, 1972–1973, 1977–1978, 1982–1983 and 1987) and non-El Niño years between 1961 and 1990 at Iloilo City, Philippines.
cropping calendar is often adjusted to coincide with the period with high probability of receiving adequate rainfall to support plant growth requirements. In the Philippines, it is commonly observed that planting period, capable of sustaining effective rice produc-tion during the dry season, is narrower for most of the regions in the Philippines compared to the time frame available during the wet season. The narrower dry season planting period seeks to maximize the re-maining moisture from the previous wet season rice cropping. Regions with more even year-round distri-bution of rainfall may also exhibit overlaps in rice planting and harvesting operations.
3.3. Crop yield
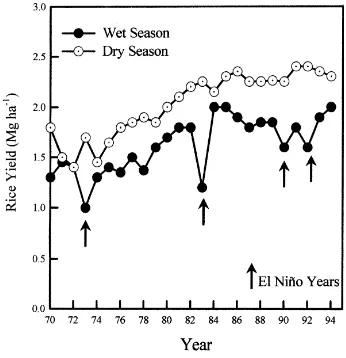
Crop yield is directly influenced by climate vari-ability as exhibited in the time series data of Philippine rice yields. Fig. 4 illustrates rainfed rice productivity in the Philippines (1970–1994) as affected by El Niño. It shows how El Niño can negatively influence wet season cropping of rice without any corresponding effect on the dry season cropping. This condition is due to the late onset and early termination of the rainy season. This exposes the wet season cropping to unne-cessary water stress resulting in drastically lower yield. The El Niño years of 1973, 1983, and 1990 specified in Fig. 4 accounted for 65, 81 and 52% of all rice losses, respectively, during those years as represented in Fig. 1.
3.4. Cropping systems
Cropping sequence/crop rotation of annual crops can be modified to adapt to climatic variability. This may also result in adjustments in scale of production often resulting in a decrease in area for crop produc-tion. The reduction in area cultivated is often a cop-ing mechanism to reduce the impact associated with increased risk and uncertainty. Modification in choice of crops or cultivars to grow especially in areas accus-tomed to high crop diversification, and even changes
Satake and Yoshida (1978) reported that spikelet sterility in Indica rice varieties was induced when exposed to high temperature immediately before and during anthesis. The same study attributed the major causes of high temperature-induced sterility in rice to disturbance of pollen shedding and decreased viability of pollen grains. This resulted in decreased number of germinated pollen grains on the stigma. Thus, rice yield is expected to decrease during instances of high temperature during flowering. Similar results of in-duced sterility, rein-duced kernel quality, and decreased kernel dry weight in rice were reported by Tashiro and Wardlow (1991a,b) when day/night temperature shifts from 27/22 to 36/31◦C during the reproductive
stage of plant development.
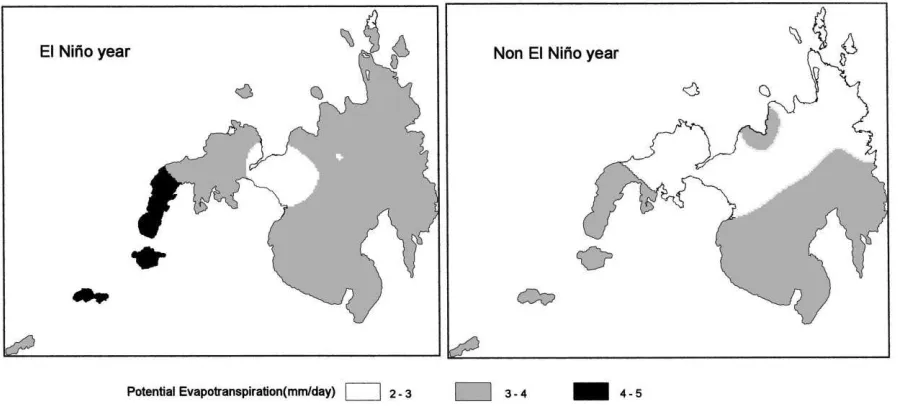
Fig. 5. PET (mm per day) during January of an El Niño (1990) and non-El Niño (1988) year in Mindanao, Philippines.
The El Niño phenomenon which causes fluctuations in temperature and rainfall patterns in the Pacific Basin and beyond is generally associated with drought in the Philippines. Rainfall occurrence during an El Niño year may decrease by 20–50%, and therefore, crops will require more irrigation water than usual. As shown in Fig. 5, during January in southern Philippines, mean monthly PET is higher during an El Niño year than during a normal year. There are differences in the spa-tial distribution of mean monthly PET values in Min-danao, southern Philippines. Consequently, cropping sequence and schedule can be planned to take advan-tage of available soil moisture. Alternatively, planting can be delayed or adjusted depending on the suffi-ciency of accumulated rainfall.
4.3. Water stress
The variability of water supply in crops can cause negative effects to crop production. In rice, water stress at panicle initiation increased the proportion of unfilled grains and decreased 1000-seed weight (Wopereis, 1993; Wopereis et al., 1996). Reduced availability of water at the vegetative stage resulted in reduced morphological and physiological mea-surements in rice. The affected morphological and physiological features include tiller number, leaf area index, apparent canopy photosynthetic rate, leaf nitro-gen, shoot and root biomass, and root length density (Cruz et al., 1986). Varying degrees of water stress at different growth stages can result in a number of plant reactions that can also be variety-specific. In general, water stress during the vegetative stage will delay panicle initiation in rice, mild water stress at reproductive stage will extend panicle development by 10 days and reduce grain number. A severe water deficit during the same development stage will extend panicle development by 18–28 days, and reduce grain and panicle number (Lilley and Fukai, 1994).
5. Weather variability and crop yield forecast
A process-based crop yield forecasting model can be developed which requires as input the historical weather variables (e.g. solar radiation, maximum temperature and minimum temperature, rainfall, etc.) observed up to the time the forecast is made (time of
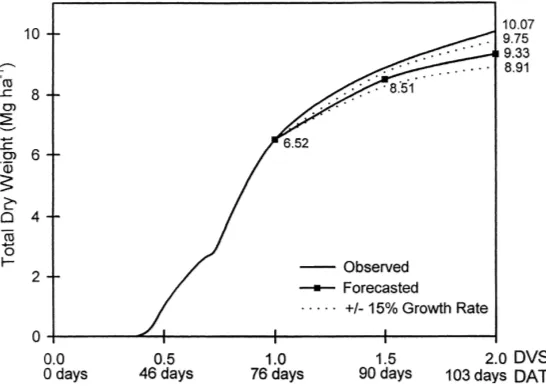
forecast), and the predicted weather variables from the point of forecast up to the time of harvest (Horie et al., 1995; Bouman et al., 1997). Using an adequate ecophysiological crop-forecasting model (based on a scientifically sound dynamic crop simulation model) and a set of reliable predicted weather variables, real-time forecast of crop response and crop yield can be determined. At any given time period during crop development, measurable crop data and observed weather variables plus the predicted weather variables for lead times up to maturity or harvesting of the crop can serve as inputs to crop yield forecasting model. For a rice yield forecasting model, a reliable estimate of crop yield can be determined even at flowering. Reliability of crop yield forecast increases as the time of forecast approaches the time of maturity, i.e. the uncertainty in crop yield estimate decreases as the forecast is made closer to crop maturity. Field data obtained in validating ORYZA 1 model (Kropff et al., 1994) were also utilized to develop a rice yield fore-casting model. An adaptive process-based rice yield forecasting model was developed in the Philippines based on the SIMRIW model of Horie (1993). As shown in Fig. 6, real-time forecast can be determined given the observed physiological and weather condi-tions up to time of forecast (e.g. flowering time) and the forecasted weather conditions up to harvest time. In Fig. 6, the ±15% yield range take into account all possible changes in the conditions affecting the crop such as higher or lower solar radiation or an in-crease/decrease of leaf area index due to improvement in crop-management techniques. This yield range be-comes narrower while the forecasted values converge with the observed values as the time of forecast ap-proaches crop maturity. In the formulation of yield range, the usual method was not applicable since the rice yield forecasting model was non-linear and autoregressive in nature. The alternative was the pos-teriori approach wherein the proportion of the total number of observations falling within a given inter-val was determined. About 75% of all observations made fall within the range of forecasted total dry weight.
Fig. 6. Observed and forecasted total dry weight (Mg ha−1) of IR 64616 rice variety (time of forecast: development stage, DVS=1
.0)
using a modified model based on SIMRIW model (Horie, 1993) and yield range based on±15% change in forecasted growth rate.
should be based on ecophysiological processes (Pen-ning de Vries et al., 1989; Pen(Pen-ning de Vries, 1991), while weather forecasts should represent or mimic the expected weather (Geng et al., 1986; Bouman et al., 1997). Moreover, as additional historical mea-surements of crop data (e.g., leaf area index and plant height) become available, and updated forecasts of weather variables are made, then crop yield forecast can be adjusted. Such an adaptive crop-forecasting model lends itself well with a crop monitoring system (Bouman et al., 1997).
As mentioned earlier, the vulnerability and risk of crop production due to weather fluctuations and climate variability can be minimized if future weather variation can be adequately predicted. Consequently, adaptive and/or mitigating measures in crop produc-tion system can be implemented to minimize risk. At present, however, adequate weather forecasts can only be made for lead times of only a few days to more than a week.
6. Adaptation to climate variability
Climatic averages are poor indicators for adaptation analysis. Farming systems response is more critical with regards to sudden fluctuations in weather and
climate rather than to gradual, long-term climatic shifts, and adaptation is geared up more by occurrence of climate extremes (Murdiyarso, 1998). Climatic anomalies may occur with respect to extreme rain-fall and/or temperature events, which have potential effects on crop production.
Equally important as the assessment of the agro-nomic impacts of climate variability is the analysis of adaptation and vulnerability. Adaptation is an important component of an integrated and balanced strategy to climatic variability (MacIver, 1998). A single or combination of adaptive measures as part of farming management adjustments can help to reduce vulnerability to climate variability. However, while adaptation strategies may be effective at reducing vulnerability, these measures may also have some negative impacts or may be inconsistent with other societal goals and objectives. Lebel (1998) has re-ported that availing crop insurance or changing land use for an area highly vulnerable to climatic flux may not be sustainable in the long run.
degree to which adjustments are possible in prac-tices, processes, or structures of systems to variability of climate (IPCC, 1996; Miles et al., 1998). Adap-tation is largely a time-dependent, location-specific learning process (MacIver, 1998). There are a num-ber of production strategies that can be utilized in the face of climatic variability. O’Toole and Chang (1978) recommended the use of early maturing rice varieties as a strategy in unstable production areas. Pantastico and Cardenas (1980) reported possible coping strategies in the face of climatic variabi-lity in rice production. These include ratooning for shorter growing periods, planting lodging-resistant, non-shattering, and waterlogged-resistant varieties, establishing windbreaks in strategic areas, developing methods to conserve rainwater to extend the cropping period, and developing simple implements for rapid harvesting and postharvest handling.
7. Concluding remarks
The degree of vulnerability of crops to climate variability depends mainly on the development stage of the crops at the time of weather aberration. Even a slight change in temperature during a critical stage (e.g. flowering) may already result in significant re-duction in crop yield (Satake and Yoshida, 1978; Penning de Vries et al., 1989). Climate variabil-ity also influences other factors that may hamper crop growth. Incidence of pests and diseases may be hastened by the fluctuations in weather variables, such as temperature and rainfall patterns. Scientists and farmers must join efforts to further understand crop–climate relationships to help them formulate viable, location-specific production technologies that will address critical issues such as climate variability.
Efficient and effective analysis of the agronomic impacts of climate variability requires a good un-derstanding of the systems processes involved in crop growth and development and crop production which allows an objective assessment of the vulner-ability of the production systems to exogenous cli-mate variables (Lebel, 1998). The inter-disciplinary, systems-based approach facilitate the understanding of the linkages and feedbacks among the system components.
References
Bouman, B.A.M., van Diepen, C.A., Vossen, P., van der Wal, T., 1997. Simulation and systems analysis tools for crop yield forecasting. In: Teng, P.S., et al. (Eds.), Applications of Systems Approaches at the Farm and Regional Levels, Vol. 1. IRRI and ICASA, Kluwer Academic Publishers, Dordrecht, pp. 325–340. Cruz, R.T., O’Toole, J.C., Dingkuhn, M., Yambao, E.B., Thangaraj, M., De Datta, S.K., 1986. Shoot and root responses to water deficits in rainfed lowland rice. Aust. J. Plant Physiol. 13, 567–575.
Geng, S., Cady, C.W. (Eds.), 1991. Climatic Variation and Change: Implications for Agriculture in the Pacific Rim. Proceedings, U.C. Davis, California.
Geng, S., Penning de Vries, F.W.T., Supit, I., 1986. A simple method for generating daily rainfed data. Agric. For. Meteorol. 36, 363–376.
Horie, T., 1993. Predicting the effects of climatic variation and effect of CO2 on rice yield in Japan. J Agric. Meteor. Tokyo
48, 567–574.
Horie, T., Nakagawa, H., Ohnishi, M., Nakano, J., 1995. Rice production in Japan under current and future climate. In: Matthews, R.B., et al. (Eds.), Modeling the Impacts of Climate Change on Rice Production in Asia. CAB International, Wallingford, pp. 143–164.
Hossain, M., 1997. Rice supply and demand in Asia: a socio-economic and biophysical analysis. In: Teng, P.S., et al. (Eds.), Applications of Systems Approaches of the Farm and Regional Levels. Kluwer Academic Publishers, Dordrecht, the Netherlands, pp. 263–279.
IPCC, 1996. Houghton, J.T., Meira Filho, L.G., Callander, B.A., Harris, N., Kattenberg, A., Maskell, K. (Eds.), Climate Change 1995: The Science of Climate Change. Cambridge University Press, Cambridge, MA, 572 pp.
Kropff, M.J., van Laar, H.H., Matthews, R.B., 1994. SARP Research Proceedings on ORYZA1 an Ecophysiological Model for Irrigated Rice Production. Wageningen, Grafisch Service Centrum van Gils, V, 110 pp.
Lebel, L., 1998. Adaptation science summary (Section 1). In: MacIver, D.C. (Ed.), Adaptation to Climatic Variability and Change. Workshop Summary. Atmospheric Environment Service, Environment Canada, Ont., Canada, pp. 24–27. Lilley, J.M., Fukai, S., 1994. Effect of timing and severity of water
deficit on four diverse rice cultivars. III. Phenological deve-lopment, crop growth, and yield. Field Crops Res. 37, 215–223. MacIver, D.C., 1998. Adaptation to Climatic Variability and Change. Workshop Summary. Atmospheric Environment Service, Environment Canada, Ont., Canada.
Matthews, R.B., Kropff, M.J., Bachelet, D. (Eds.), 1996. Modeling the Impacts of Climate Change on Rice Production in Asia. CAB International/IRRI, Wallingford/Los Baños.
and testing VHYVs. In: Penning de Vries, F.W.T., Kroff, M.J., Teng, P.S., Kirk, G.J.D. (Eds.), Systems Simulation at IRRI. IRRI Research Paper Series No. 151, pp. 13–19.
Penning de Vries, F.W.T., Jansen, D.M., ten Berge, H.F.M., Bakema, A., 1989. Simulation of ecophysiological processes of growth in several annual crops. Simulation Monographs. Pudoc, Wageningen, the Netherlands, 271 pp.
Wopereis, M.C., 1993. Quantifying the impact of soil and climatic variability on rainfed rice production. Ph.D. Thesis. Wageningen Agricultural University, the Netherlands, 188 pp.
Wopereis, M.C., Kropff, M.J., Maligaya, A.R., Tuong, T.P., 1996. Drought-stress responses of two lowland rice cultivars to soil and water status. Field Crops Res. 46, 21–39.