SURVEYING THE UNDERWATER ARCAHEOLOGICAL SITE OF CAPE GLAROS AT
PAGASETIKOS GULF
E. Diamanti1, E. Spondylis1,F. Vlachaki1,E. Kolyva1
1Hellenic Institute of Marine Archaeology (H.I.M.A.), Saripolou 9, 10682, Athens, Greece, [email protected]
Commission II
KEY WORDS: Maritime Archaeology, Coastal Surveying, Underwater Cultural Heritage, Underwater Photogrammetry, 3D Reconstruction, 3D Visualization, Orthophotomosaics, Architectural Documentation, H.I.M.A.
ABSTRACT
The Hellenic Institute of Marine Archaeology (H.I.M.A.)1 has been conducting an underwater archaeological research in the west coast of southern Pagasetikos Gulf, since 2000. Every year the underwater research focuses on specific archaeological targets that have been recovered during previous field campaigns. The current publication elaborates on the comprehensive documentation of the underwater archaeological site at Cape Glaros, during the 2015 field season, under the direction of the archaeologist Elias Spondylis. The 2015 research campaign was conducted within the framework of the ITACA- Innovation Technologies and Applications for Coastal Archaeological sites European Project (FP7/2007-2013, GA No 606805), at two archaeological sites, namely the Cape Glaros and Metohi. It was among the most important challenges of the project to successfully produce the detailed and accurate 3D mapping of the Cape Glaros site that covers an extended area. Four large concentrations of pottery finds and numerous anchors of different typology have been recorded, that can be dated from the late Hellenistic to the Byzantine periods. This challenge was tackled through the simultaneous implementation of three recording methods; photogrammetry, geodesy and conventional architectural mapping. The workflow of the documentation process, including data acquisition, processing and graphic visualization, along with the derived results are presented below.
1. INTRODUCTION
The revolutionary development of techniques on 3D reconstruction of underwater archaeological sites can open up new horizons to all scientists (archaeologists, conservators, architects, surveyors) involved in such projects. Complex objects or environments of limited accessibility, can be thoroughly documented, through photogrammetric applications, providing in this way, to the community of maritime archaeology, a cost and time effective, accurate and fully-detailed means of surveying. Recent digital sensors, powerful hardware and advanced - in terms of accuracy, automations and ease to use Structure from Motion – software, can definitely serve the demanding and challenging needs of an underwater archaeological survey. However, the crucial issue of handling enormous amount of data, when it comes to a few-cm-detailed documentation of large and complex structures or areas, still remains.
Cape Glaros is a large and complex archaeological site, due to its sparsely scattered finds on a rocky seabed with an inclination of up to 46%. Concerning its documentation approach, the site cannot be handled as a compact archaeological object, with certain dimensions and boundaries, but as a vast area of interest, that consists of large concentrations of archaeological finds with large sandy areas with no surface finds, in between. Therefore, the most critical objective of the 2015 campaign - that is hereby presented - is how the entire area is geometrically documented under a uniformly distributed accuracy, after being divided into sub-areas, driven by the presence or absence of archaeological
1 The Hellenic Institute of Marine Archaeology (H.I.M.A.) is a private, non-profit organization, founded in 1973, which undertakes maritime
archaeological research under the supervision or in collaboration with the Greek Ministry of Culture. It has over 100 members, with diverse academic credentials, all of whom work, mainly, on a voluntary basis. 3D recording of underwater archaeological sites has been applied to numerous projects that have been carried out by the multidisciplinary team of H.I.M.A. in locations of utmost archaeological importance and interest, such as Modi island (Poros) and numerous wreck sites in Pagasetikos and South Euboean (Diamanti, Vlachaki, 2015) Gulfs and others.
interest. Large sandy areas with lack of finds were excluded from the photogrammetric data acquisition and processing.
1.1 Brief archaeological description of Cape Glaros site
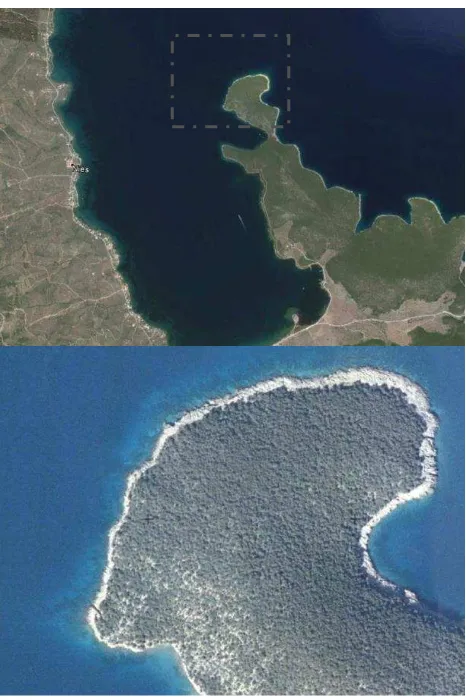
In the year 2000, the Hellenic Institute of Marine Archaeology, set out to conduct an underwater archaeological survey along the west coast of the southern part of Pagasetikos Gulf, under the direction of the archaeologist Elias Spondylis (Spondylis, 2012). To this day, 16 archaeological sites have been located, along a coastal zone of 7 nautical miles. Among them, 13 shipwrecks that have been recorded, can be dated from the Hellenistic period to the early 20th century. In 2015, among H.I.M.A.’s priorities was the thorough documentation of the underwater archaeological site of Cape Glaros, located at the NW end of the peninsula that protects the small gulf of Nies, in the west coast of South Pagasetikos Gulf (Figure 1). In addition, the detailed recording of the Cape Glaros site was also among the H.I.M.A.’s research objectives in order to collect all required data and contribute to the successful outcome of the ITACA- Innovation Technologies and Applications for Coastal Archaeological sites European Project (FP7/2007-2013, GA No 606805). Indisputably the rocky coastline of Glaros used to be a hazardous point for ships navigating in the much frequented Pagasetikos sea route, during the course of the centuries. Glaros rises up to 43m above sea level at a distance of about 200m and its rocky coast continues underwater with an inclination of up to 46% (Spondylis et al, 2016).
At a region of about 5000 m2, (Figure 10) two large concentrations of pottery and anchors have been recorded topographically to a great extent. At a distance of 200m, from this area, two more concentrations of finds have been partially recorded. The depth ranges from -7 m to -45 m, approximately. The finds within the 4 basic concentrations depicted on the topographic plan, are located in close proximity to each other, whilst they belong to different periods and typology. According to Spondylis et al. (2016) there are at least 4 shipwrecks located at the northwest end of point Glaros (Spondylis, 2016): a shipwreck with Greco-Italian amphorae of the 3rd century BC found at the northeast of the concentration, two Roman shipwrecks, dated in two different periods, and at least one Byzantine shipwreck that can be dated to the 12th century AD. Additionally, 14 iron anchors of Y and T types, have been counted so far, the majority of which could be related to the Byzantine shipwreck. Among the finds, there are also 2 stone anchors that cannot be securely dated, since their use expands from the Bronze Age to the middle Ages and at least 3 grapnel anchors with four arms that can be dated from the historic to the early modern times. Overall 25 anchors have been recorded up to this day at this area (Spondylis et al., 2016).
Figure 1: Cape Glaros (©Google Maps)
1.2 Previous work at Cape Glaros
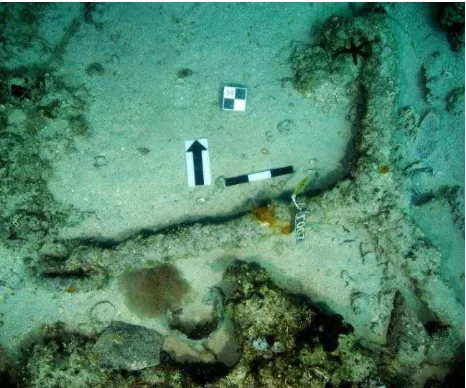
During the course of the previous archaeological field seasons (2005 to 2008), the northwest end of point Glaros was surveyed to an extent and preliminary plans were produced. Archaeological data was further enriched by architectural sketches and topographical plans of small concentrations of finds. In addition, photographic recording and the creation of
photomosaics at two concentrations were also successfully conducted (Figure 2). In numbers, the entire area that had to be mapped, was estimated at about 10.000m2 within a wider area of 20.000m2 of scattered finds, extending 400m along the northwest coast of Cape Glaros, up to a maximum depth of -40m, including two large concentrations of pottery and anchors.
Figure 2: Preliminary work at Cape Glaros (©H.I.M.A. 2008)
The large number of Byzantine iron anchors scattered in this large area among late Hellenistic/Roman and Byzantine pottery made the detailed documentation of the area essential for the archaeological significance of the site. 10.000m2 of rocky seabed had to be documented in fully-detailed imagery information and accurately 3D modeled.
2. 2015 WORKFLOW
The extended boundaries of the documentation area together with the limited time available indicated the application of a methodology as automated as possible, without, however, setting aside the presence of divers. All field work had to be completed by the team within approximately 15 days. The preparation of the on - site documentation work included, the distinctive labeling of the underwater finds and their cleaning, the implementation of underwater zones, with the use of bounding ropes and of control points scattered within the area. Also, the placement of 1.2m scale bars in suitable areas of the site.
The actual on-site documentation work included technical support dives, photo shooting dives, either for photogrammetric or archaeological documentation, as well as dives made for the conventional architectural mapping of distinctive finds. At the same time, land surveying was also conducted for the georeferencing of the concentration to a common coordinate system.
Following the 2015 field season, the processing of all acquired data lasted for approximately 10 months. Processing included: photogrammetric processing of large image datasets, 2d editing of architectural documentation of finds, vectorization of photogrammetric results, data classification and visualization under a GIS platform, production of general as well as detail 2d plans of the whole area of interest, production of a fly-over video of the 3d mapped area. 2d & 3d mapping of Cape Glaros. The International Archives of the Photogrammetry, Remote Sensing and Spatial Information Sciences, Volume XLII-2/W3, 2017
As it is aforementioned, three related documentation techniques were applied simultaneously; photogrammetry, land surveying and conventional architectural mapping.
2.1 Land surveying
A critical objective of the project, along with the photogrammetric documentation, was the georeferencing of the photogrammetric model of the underwater site and its integration with the coastline and adjacent land within a common coordinate system. National Geodetic Reference System (GGRS87) was the preferable coordinate system chosen and the following surveying procedure was applied. 9 finds scattered widely, covering a depth range of -10 to -30 m, were selected to be surveyed, by being measured by a total station, which was located on the rocky shore (Figure 3). These 9 points of reference were ‘transferred’ to surface with the use of 9 buoys that were adequately vertical on top of the finds, under favourable weather conditions (lack of currents and waves, max. wind force 0-1F). For accuracy purposes, each find’s location was measured at least 5 times, on the selected point and an average value for each point was estimated and used, for the absolute orientation of the photogrammetric model. Evaluating the method of transferring points to surface and measuring them from land, is still not feasible at this stage of the project, as the observations involved are the minimum ones. Definitely a satisfying dataset of such observations, should contain multiple measurements for each node of a 3D dense grid, creating in this way, a 3D control field. Anyway, this is a multiparameter problem, as factors like, underwater currents, depth, waves or bad placement of buoy - even if weather and underwater conditions are ideal - can cause loss of verticality and stability of the surface point.
2.2 Underwater Photogrammetry
One of the most important advantages of photogrammetry applied in underwater surveys, in comparison to other techniques, consists in its simplicity of implementation and the diversity of potential results (Drap, 2011). Photogrammetry was chosen as the most preferable technique for the geometrically accurate and imagery-detailed 3d reconstruction of Glaros underwater site. Plans, photomosaics, single pictures and any other data available, collected during former survey periods, were used for the optimal organization of the photogrammetric restitution. The vast area that needed to be surveyed was not possible to be documented by implementing photogrammetry during one survey period, while at the same time, areas with no surface finds were included into the area that had to be covered. Therefore, it was decided that two main concentrations of finds and an area of sparsely scattered finds were to be surveyed with the use of photogrammetry and then merged into a common georeferenced map. The almost ideal underwater conditions of the documentation area - regardless of the depth range - such as the lack of turbidity and sea grass, the high light intensity due to excellent visibility, were the first encouraging signs, for satisfying photogrammetric data acquisition.
Plans and photomosaics created during former survey periods were used for the project planning and the preparation of the areas of interest before the photo acquisition sessions. The ‘flight plan’ of the diver-photographer was defined by the placement of parallel rows of ropes, used as guidelines for capturing the entire area under a typical way of strips (Figure 4). Moreover, pavers with photogrammetric targets, as well as 1.2m scale bars, were widely dispersed, being used as control points and constraints. A very important part of the preparation was also the cleaning of
artifacts from biogenic concretion, carried out by the team, under the instructions of the head conservator.
Figure 3: Land surveying at the rocky seashore of Cape Glaros (©H.I.M.A. 2015)
Figure 4: Preparation of the first basic concentration (guidelines, control points) for photogrammetric documentation, based on site plans from former research periods (©H.I.M.A. 2015)
2.2.1 Data Acquisition
Due to the nature of the object to be documented, the collection of an adequate dataset, seems to be the first crucial step of the photogrammetric procedure. The full coverage of the object, the correct camera setup and the right - concerning geometrically satisfying camera positions - ‘fly-over plan’, are the most important parameters when photographing for photogrammetric purposes, in any case. In this case, of a complex environment, it is definitely critical, that all these parameters are achieved at once. For the photo acquisition at Cape Glaros, a SONY DSLR-A700 camera, with a 12mm lens and an image resolution of 4272x2848 pixels, was used. The photographer covered the area, taking pictures from a distance of 3-4 meters with a 70-80% forward overlap and 50-60% side overlap and following an orientation defined by the guidelines/ropes. This process, of The International Archives of the Photogrammetry, Remote Sensing and Spatial Information Sciences, Volume XLII-2/W3, 2017
guidelines and markers placement and photo shooting with such overlaps and ‘flight plan’ recurred three times, for each basic concentration. The first two concentrations, the southern ones, that are relatively close at a distance of approximately 40 meters, were merged through an extra image acquisition session of a sandy inclined corridor that connects them. Additionally, a number of at least 20 finds (anchors, pottery) were selected to be photographed again individually, from a closer distance and through various angles, for a more detailed documentation (Figure 5). For backup reasons, in cases of loss of information, a fly-over-the-area video was taken.
Figure 5: Byzantine anchor Y type (©V. Mentogiannis, H.I.M.A. 2015)
2.2.2 Data Processing
Approximately 4.000 images were collected, covering the areas of concentrations of about 6500 m2 and the detailed capture of selected finds. Agisoft Photoscan was used, offering its automated photogrammetric pipeline, for the relative orientation of two main blocks of images, one that covers the area of the first two concentrations and one that covers the northern basic concentration. A set of minimum underwater conventional tape measurements, additionally to the scale bars placed at the documentation area defined the blocks’ scale. In each block, the close-range images of the finds, have also been imported. Characteristic features (artificial points on artefacts and landscape formations) were used as common points, in order to merge the detailed areas of finds to the wider archaeological site of Glaros. Once dense points clouds were available, after the dense matching processing, detailed meshes, rendered with image texture were generated, to produce a fully textured 3D model of the surveyed area and artefacts. The georeferencing of the 3D models was the result of the combination of an absolute photogrammetric documentation, with the surveying of control points from land. On the assumption that the relative orientation of images gave very good results (<1pixel), thanks to the large dataset of overlapped images, resulting in a model of robust geometry, the shape and scale of the model is reconstructed in a very high level. This means that the method is based mostly on photogrammetric results, rather than the surveying. Surveyed points were used for this reason with large tolerances, up to 5-6 cm, for depths till 15 meters and up to 10 cm for deeper points. 2 control points, both at 30 meters deep, were excluded from the adjustment due to their big RMS (up to 25cm). On completion of the absolute orientation, block images were orthorectified,
producing orthophotomosaics of the documentation areas. Images taken from further distances from the seabed, till 4 m, were blended with the close-range images (of about 1 m distance, taken from various angles), in order to generate detailed orthophotomosaics of finds. (Figure 6a, Figure 6b).
Figure 6a: Orthophotomosaic of concentration area and finds (©H.I.M.A. 2015)
Figure 6b: Orthophotomosaic of concentration area and finds (©H.I.M.A. 2015)
2.3 Architectural Mapping
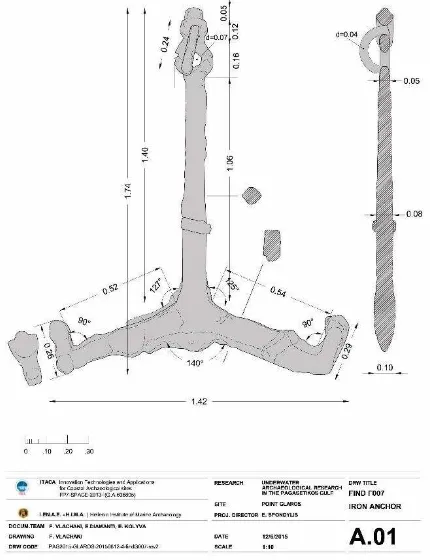
Conventional architectural mapping was done through the creation of underwater sketches (Figure 7) of selected, characteristic finds, as were the iron anchors. Detailed measurements (Figure 8) were taken on the anchors using tape measures, callipers and profilometers, along with aimed photographic documentation of details of the finds with the use of scales. 3D perspective drawings of finds were also made in order to record structural details and their relation to the underwater geomorphology and other finds.
Figure 7: Perspective drawing of anchor (©H.I.M.A. 2015)
Figure 8: Detailed measurements on anchor Γ007 (©H.I.M.A. 2015)
2.4 Visualization of 2D and 3D products
The products of the 2015 archaeological campaign and survey period, were 3D surface models and orthophotomosaics that were generated from the photogrammetric and visualization process. They also served as a basis for the generation of 2D plans of the site (Figure 9, Figure 10). However, during vectorization, an issue that had to be surpassed, was the interaction of the 2D environment with huge 3D models. For this reason, 3D meshes of flat areas with lower archaeological interest, such as homogeneous sandy zones, were decimated, concerning their faces counting, but their texturing was kept on high resolution.
Visualization perspectives are strongly connected to model analysis, something that points out the need to include into a
visualization scenario, not only 3D data - which are mostly heavy and unmanageable for archaeologists - but also additional information related to the model such as multimedia (detailed images and videos), finds’ archaeological attributes, GIS data, notes, diaries etc. Such an aspect of visualized data can serve most archaeological research needs, from analysis of the detailed overview of the site, to impressive presentations. Such developed work has shown its functionality and effectiveness so far not only in cases of underwater archaeological projects, but also in research projects of digital cultural heritage in general (Drap 2001, Allen 2004, Avanthey 2016).
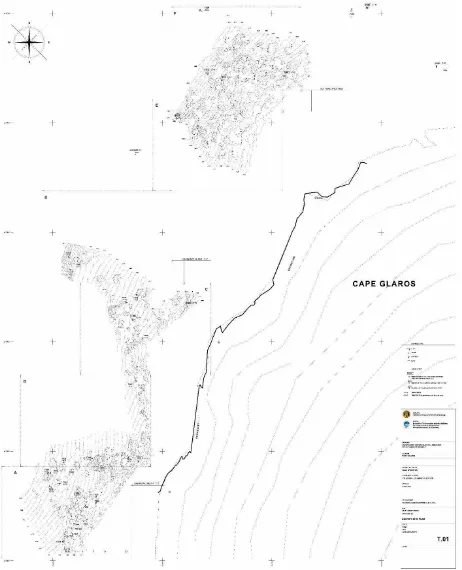
A general site plan as well as 6 detail plan views of the concentrations, were generated with the augmentation of data and graphic information gathered from the photogrammetric processing of photographs focused on the finds, as well as from their architectural documentation. The architectural documentation and 3d model generation of separate finds also led to the production of detailed drawings of a large number of anchors and pottery, thus providing archaeologists with a rich list of orthophotomosaics, 2D drawings and 3D models.
Figure 9: Digitization of orthophotomosaic (©H.I.M.A. 2015)
Figure 10: Detailed plan of one of the concentrations (©H.I.M.A. 2015)
Within the framework of the ITACA project, all photogrammetric 3D output, is also going to be compiled with the geophysical survey results, that is geomorphological maps created by acoustic data sets, conducted by the Geophysical The International Archives of the Photogrammetry, Remote Sensing and Spatial Information Sciences, Volume XLII-2/W3, 2017
Survey team, from the Laboratory of Marine Geology and Physical Oceanography, Department of Geology, University of Patras (LMGPO), resulting in a detailed 3D map of the entire area of Cape Glaros.
3. CONCLUSIONS & FUTURE WORK
The systematic survey of Cape Glaros site will continue in the following years in order to cover the entire area of interest, 60.000m2, and acquire a more clarified idea about the shipwrecks that have been located within this area. The documentation team is focusing on the standardization of data acquisition process so that it can be adopted in a large scale of objects and sites both in Pagasetikos Gulf and in other locations under archaeological research.
ACKNOWLEDGEMENTS
The financial support of the ITACA Project and the funds received from the EU during the 2015 campaign were crucial for the successful completion of this stage of surveying and archaeological research on the site of Cape Glaros. The fundamental aspects, though, of any H.I.M.A. expedition, is the voluntary contribution of all members who work in the field withunique dedication, along with the administrative support of
the Institute’s board. This presentation is the result of a team
effort with the creative collaboration of researchers from diverse fields of expertize.
REFERENCES
Allen, P., Feiner, S., Troccoli, A., Benko, H., Ishak, E. and Smith, B., 2004, September. Seeing into the past: Creating a 3D modeling pipeline for archaeological visualization. In 3D Data Processing, Visualization and Transmission, 2004. 3DPVT 2004. Proceedings. 2nd International Symposium on (pp. 751-758). IEEE.
Avanthey, L., Beaudoin, L., Gademer, A. and Roux, M., 2016. Tools to Perform Local Dense 3D Reconstruction of Shallow Water Seabed. Sensors (Basel, Switzerland), 16(5).
Canciani M., Gambogi P., Romano FG., Cannata G., Drap P., 2002, Low cost digital photogrammetry for underwater archaeological site survey and artifact insertion. The case study of Dolia wreck in Secchedella Meloria-Livorno-Italia, International archives of the photogrammetry, remote sensing and spatial information sciences 34 (Part 5/W12), pp 95–100
Diamanti, E. and Vlachaki, F., 2015. 3D Recording of Underwater Antiquities in the South Euboean Gulf. The International Archives of Photogrammetry, Remote Sensing and Spatial Information Sciences, 40(5), p.93.
Drap, P. and Long, L., 2001, November. Towards a digital excavation data management system: The Grand Ribaud F Estruscan deep-water wreck. In Proceedings of the 2001 conference on Virtual reality, archaeology, and cultural heritage (pp. 17-26). ACM
Eric, M., Berginc, G., Pugelj, M., Stopinšek, Z. and Solina, F., 2013, October. The impact of the latest 3D technologies on the documentation of underwater heritage sites. In Digital Heritage International Congress (Digital Heritage), 2013 (Vol. 2, pp. 281-288). IEEE.
Henderson, J., Pizarro, O., Johnson‐Roberson, M. and Mahon, I., 2013. Mapping Submerged Archaeological Sites using Stereo‐ Vision Photogrammetry. International Journal of Nautical Archaeology, 42(2), pp.243-256.
McCarthy, J. and Benjamin, J., 2014. Multi-image photogrammetry for underwater archaeological site recording: an accessible, diver-based approach. Journal of maritime archaeology, 9(1), pp.95-114.
Skarlatos, D., Demestiha, S. and Kiparissi, S., 2012. An ‘open’method for 3D modelling and mapping in underwater archaeological sites. International Journal of Heritage in the digital era, 1(1), pp.1-24.
Spondylis, E. 2012: “Underwater Archaeological Research in the Gulf of Pagasai, 2005 campaign”. Enalia XI (2012), 16-39.
Spondylis, E. Michalis, M. and C. Agouridis 2016. “ITACA’s Test Case Greece: The Pagasetikos Underwater Archaeological Research at Metohi and Glaros”, in Satellite Remote Sensing Technology in Underwater Archaeology. Proceedings of the Final Conference “ITACA-Innovation Technologies and Applications for Coastal Archaeological Sites”, Hellenic Maritime Museum, June 2016, Athens.
Figure 11: 3D reconstruction of Glaros underwater archaeological site (©IENAE 2015)
Figure 12: 3D reconstruction of Glaros underwater archaeological site (©IENAE 2015)
Figure 13: Site plan of Survey Area 2015 (©IENAE 2015)