POINT CLOUD ANALYSIS FOR CONSERVATION AND ENHANCEMENT OF
MODERNIST ARCHITECTURE
M. Balzani a, F. Maietti a *, B. Mugayar Kühl b
a Department of Architecture, University of Ferrara, via Quartieri 8, 44121 Ferrara, Italy - (marcello.balzani,
federica.maietti)@unife.it
b FAU USP, Faculdade de Arquitetura e Urbanismo da Universidade de São Paulo, Rua do Lago 876, 05508-080 São Paulo-SP,
Brazil - [email protected]
Commission II
KEY WORDS: 3D survey, Conservation, Modernist Architecture, Point cloud analysis, Intensity values, State of conservation
ABSTRACT:
Documentation of cultural assets through improved acquisition processes for advanced 3D modelling is one of the main challenges to be faced in order to address, through digital representation, advanced analysis on shape, appearance and conservation condition of cultural heritage. 3D modelling can originate new avenues in the way tangible cultural heritage is studied, visualized, curated, displayed and monitored, improving key features such as analysis and visualization of material degradation and state of conservation. An applied research focused on the analysis of surface specifications and material properties by means of 3D laser scanner survey has been developed within the project of Digital Preservation of FAUUSP building, Faculdade de Arquitetura e Urbanismo da Universidade de São Paulo, Brazil. The integrated 3D survey has been performed by the DIAPReM Center of the Department of Architecture of the University of Ferrara in cooperation with the FAUUSP. The 3D survey has allowed the realization of a point cloud model of the external surfaces, as the basis to investigate in detail the formal characteristics, geometric textures and surface features. The digital geometric model was also the basis for processing the intensity values acquired by laser scanning instrument; this method of analysis was an essential integration to the macroscopic investigations in order to manage additional information related to surface characteristics displayable on the point cloud.
* Corresponding author
1. INTRODUCTION
1.1 Research framework
FUSP, the Fundação de Apoio à Universidade de São Paulo, is working under a grant from the Getty Foundation (Keeping it Modern Program) embracing the development of a conservation management plan to produce a holistic approach to the maintenance of the building's key features. This methodology will be integrated into the university’ research curriculum as a tool to educate the next generation of Brazilian architects on the value of strategic planning for the conservation of historic sites by means of 3D digitization.
The integrated diagnostic survey of the external surfaces of FAUUSP, designed by João Batista Vilanova Artigas in 1961, built between 1967 and 1969, was performed in conjunction with the 3D laser scanner survey.
The on-site survey has been carried out in August 2016, and it concerned the metric-morphological acquisition of external facades and structural elements of one of the most important and representative buildings of the Brazilian modernism (Quezado Deckker, 2001).
The main objectives of the research focused on the analysis of external surfaces of the building for knowledge and conservation purposes; in particular, the diagnostic analysis has enabled a thorough evaluation of the previous restoration work on external surfaces (Balzani & Maietti, 2015). To this end, the 3D laser scanner survey, based on the time-of-flight technology, allowed to develop a high-precision digital metric model
(primary requirement in the survey of a large building, as the FAUUSP is), by using, at the same time, the processing of 3D data acquired as a support in identifying surface’ specifications.
1.2 FAUUSP building by João Batista Vilanova Artigas
João Batista Vilanova Artigas (1915-1985) was a Brazilian modernist architect. Born in Curitiba, Artigas is considered one of the most important names in the architectural history of São Paulo, and the founding figure of the Paulista School.
Artigas graduated as an architectural-engineer in 1937 at the Polytechnic of São Paulo, where he later served as professor of aesthetics, architecture and planning (1941-1946). In 1939 he participated in a design competition (Paço Municipal de São Paulo) in partnership with Ukrainian-born architect Gregori Warchavchik, an important promoter of the European Modern Movement in Sao Paulo. In 1946 he was awarded a Guggenheim Fellowship and spent one year at the United States (Artigas Camargo, 2015).
Along with Paulo Mendes da Rocha, Artigas's membership in the Brazilian Communist Party resulted in his removal from his teaching position in 1969. Both were reinstated in the 1980s. Artigas' work is common viewed in three phases. The first phrase, from 1937 through about 1945, shows an obvious influence from Frank Lloyd Wright in residential design; from 1945 through the mid-1950s there's a transitional phase adopting an International Style grammar (curtain walls, pilotis) for larger projects; and from the 1960s and 1970s his personal, dramatic style linked to Brutalism for large-scale public The International Archives of the Photogrammetry, Remote Sensing and Spatial Information Sciences, Volume XLII-2/W3, 2017
buildings. Artigas was one of the main figures of the Paulista School of the 1950s, characterized by expressed reinforced concrete structure (Montaner, 2014).
FAUUSP was created in 1948, when the architecture course became independent from the Polytechnic School. Artigas immediately became part of the docent body and participated actively in its organization. During the 1960’s, Artigas and Carlos Cascaldi (1918-2010) were hired to design a building for the school in the new campus of the University of São Paulo. In that period, Artigas was deeply involved in a movement for the re-evaluation of traditional architectural education: building concept and education reform shared the architect’s attention in a rich synergy. FAUUSP’s new curriculum was founded on the importance of the studio as a space of learning and discussion, and the School was structured into three departments (History, Design and Technology). This curriculum was materialized in the play of volumes that composes FAUUSP’s building, constructed mainly in exposed reinforced concrete (Vilanova Artigas, 1997). The program is clearly presented to the users: all levels open to a central rectangular covered plaza (Caramel Salon) and the spaces are interconnected. The elegant proportions and forms given to the pillars sustaining the blind façade sections and the ingenious structural solutions adopted are other outstanding features of the building (Barossi, 2016).
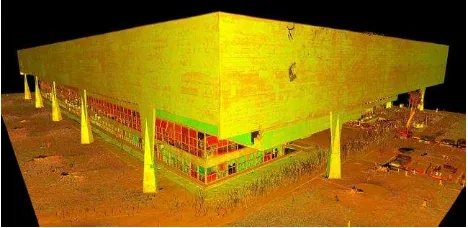
Figure 1. External view of the FAU USP building
Figure 2. The 3D model of the building in point cloud visualization
1.3 Getty Foundation
This pilot initiative for the development of conservation management plan for the FAUUSP building, that should guide long-term maintenance and conservation policies, is supported by the Keeping it the Modern program of the Getty Foundation. The foundation considers that modern architectural heritage is at considerable risk: in many examples, the experimental building materials and structural systems were not tested
beforehand and did not perform well over time. Also, heritage professionals still do not have enough scientific data on the nature and behaviour of the materials and systems, and the protocols for conservation need to be developed. Therefore, the Getty Foundation created, in 2014, an international grant initiative, focused on important twentieth century buildings to face these challenges. FAUUSP was awarded the grant in 2015.
2. 3D DATA CAPTURING
2.1 Data acquisition methodology
The metric and diagnostics analysis of the building of “FAU USP” covered the four elevations; the façades have been analysed by scanning the outer surfaces and concrete structural elements that define the perimeter of the building.
The overall size of the building, the external characteristics (structural, textural and conservative), particularly regarding the use of concrete as one of the main feature, addressed the on-site survey process towards the integration of different methods: - 3D laser scanner survey by time-of-flight equipment in order to obtain a high-accuracy 3D metric model. The use of this equipment allowed the survey of the geometric detail of the surfaces and DEM (Digital Elevation Model);
- Topographical survey by total station, for scan-registration procedure (by acquiring targets’ coordinated) and the definition of the base net (local reference system);
- overall photographic documentation of the building and on-site procedures to document survey operations and most representative areas of the general state of conservation; - diagnostic macroscopic survey for defining the state of conservation of the surfaces;
- analysis of the intensity values obtained by 3D scanning based on time-of-flight technology.
Macroscopic analysis of degradations affecting the surfaces has been carried out through high definition photographic survey, an essential support to draw up a comprehensive picture of the state of conservation.
The integrated methodology leaded to a geometric model of spatial coordinates hierarchically-defined and with a single reference system (Zlota et al., 2014). DEM from instrument source have been used as the basis for editing CAD representations of all the architectural elements and the section-plans.
2.2 Integrated diagnostic survey
The integrated diagnostic survey was carried out merging different methodologies, in order to be able to draw up a methodological procedure applicable to the whole building or to other contexts. A specific area has been selected as a representative "sample" to carry out the necessary investigation and report graphically the results of integrated investigations. The analysis of the sample area has been developed as a representative model of the methodology of integrated diagnostic survey and graphic representation of the surface characteristics.
The overall procedure was carried out by subdividing the work phases into:
- Studies and preliminary researches on the building, - Diagnostic survey on-site by macroscopic analysis,
- Data "post-processing", analysing the state of conservation and the surface characteristics by defining a specific mapping of degradations.
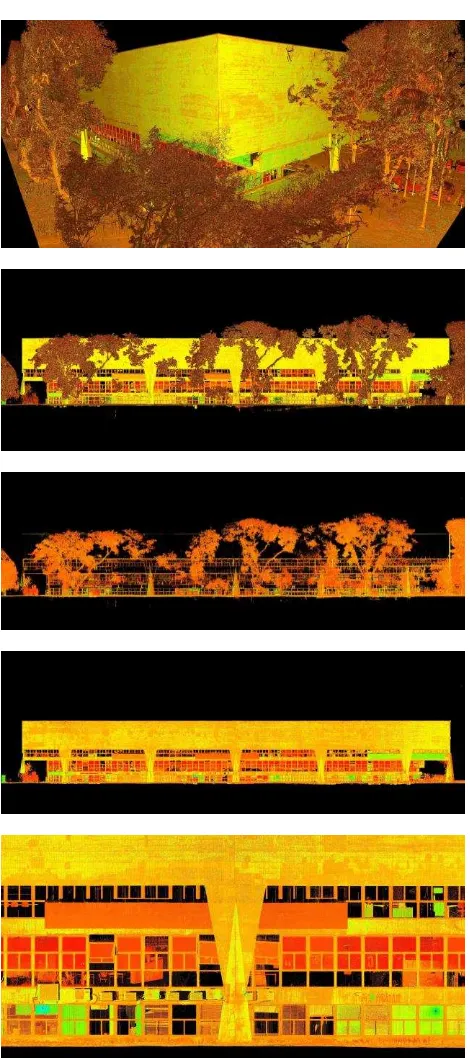
Figure 3. Different point cloud visualizations of the exteriors of the FAUUSP building
Preliminary investigations have resulted in a set of data, basic to the knowledge of the building and its formal, materials and construction characteristics, particularly relevant in the case of architecture of Artigas, and the construction technologies related to the period of construction.
The main objective of the survey project was strongly connected to the requirements for documentation of the material consistency and the state of conservation of the building, in order to be able to have a support of drawings characterized by a high-morphological metric precision and a mapping of the main degradations.
As already mentioned, the overall size of the building required an integrated on-site survey process towards the merging of different methods.
Façades Main dimensions
Façade A 110 x 18 = 1980 square
meters
Façade B 65 x 18 = 1170 square
meters
Table 1. Façades’s main dimensions
A specific requirement covered the collection and analysis of recent additions made in various areas of all four elevations of the building; material integrations considered incongruous as inconsistent with the original surface characteristics because of cement and texture matrix.
The on-site diagnostic survey was performed in conjunction with the 3D laser scanner survey operations. Priority to the photographic and instrumental survey as support for viewing and representation of features areas, the surveys have been divided into the following phases:
- A macroscopic scale analysis (location, context, orientation, analysis of the surroundings, the presence of driveways, the presence of vegetation or other characteristic elements, etc.); - Study of geometry and formal and compositional aspects of the facades;
- Analysis of the materials and construction of laying techniques;
- Preliminary analysis of material characteristics;
- Preliminary analysis of the morphologies of macroscopic degradation.
The diagnostic survey by sight and the mapping of the state of conservation have been performed throughout the duration of the 3D laser scanner survey. The diagnostic survey has been integrated by a high-definition photographic cataloguing of all surfaces, creating a database (general views, detailed and "macro"), essential documentation of the state of conservation and useful support for the steps of interpretation, processing / representation of data collected in suitable drawings.
Taking as a baseline the UNI Normal 1/88 document, a schedule has been drawn by listing the main degradation’ morphologies identified. Each morphology was linked to a specific layer on CAD files with a specific texture for its representation in technical drawings. In the case of the building by Artigas, the surface characteristics have a natural aging and a natural response of the particular cement mixture to weathering, conferring a series of particularities not definable as degradation but as alterations or modifications which do not necessarily imply a worsening under the conservative point of view (where do not cause damage or do not create worse conditions that could lead to the loss of portions of material).
2.3 Processing the intensity value
The 3D survey has allowed the realization of a point cloud model of the external surfaces, as the basis to investigate in detail the formal characteristics, geometric texture and surface features.
The digital geometric model was also the basis for processing the intensity values acquired by laser scanning instrument; this method of analysis was an essential integration to the macroscopic investigations in order to manage additional information related to surface characteristics displayable on the point cloud.
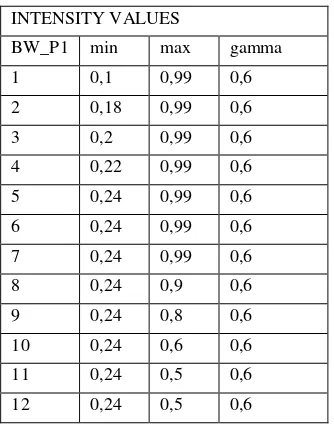
Figure 4. Greyscale visualization of a sample are of the point cloud
INTENSITY VALUES
BW_P1 min max gamma
1 0,1 0,99 0,6
2 0,18 0,99 0,6
3 0,2 0,99 0,6
4 0,22 0,99 0,6
5 0,24 0,99 0,6
6 0,24 0,99 0,6
7 0,24 0,99 0,6
8 0,24 0,9 0,6
9 0,24 0,8 0,6
10 0,24 0,6 0,6
11 0,24 0,5 0,6
12 0,24 0,5 0,6
Table 2. Intensity values data tested during the post-processing in greyscale visualization (sample 1)
INTENSITY VALUES
BW_P2 min max gamma
1 0,0761 0,99 0,6
2 0,1 0,99 0,6
3 0,15 0,99 0,6
4 0,2 0,99 0,6
5 0,15 0,99 0,55
6 0,15 0,99 0,5
Table 3. Intensity values data tested during the post-processing in greyscale visualization (sample 2)
Each point acquired with the laser scanner has an intensity value attached, calculated within the range of -2048 - + 2048 (pts export) related to the range of 0-1 (ptx export).
Considering intensity as measured by the scanner, intensity as recorded by the software, and intensity as visualized by the software, and considering that different scanners can have different intensity characteristics (minimum, maximum, response curve, etc.), a set of analysis on the point cloud of the FAUUSP building has been performed.
According to instrument’ specifications (pulsed scanner Leica ScanStation C10), different visualizations of the point cloud have been displayed in order to help accentuate variations of surfaces’ characteristics, starting from the full range of colors mapped in the software by default.
By changing the intensity range for specific visualizations, the processing of acquired data highlighted areas with specific features to be mapped (different materials, degradations, previous restoration works, etc.).
This methodology has been applied to a limited but highly representative area of one facade, in order to show on a sample surface the potential of the integrated diagnostic survey by exploiting also the processing of intensity values (Fang et al., 2015). The investigations carried out will support future conservative choices to be applied on the building.
3. MAIN OUTCOMES AND PROJECT
DEVELOPMENT
3.1 Point cloud analysis for conservation
Point cloud analysis for conservation and enhancement of heritage is an effective procedure for monitoring, conservation and regeneration processes, beyond metric-morphological features and accuracy (Maietti et al., 2016).
Combining 3D metric-morphologic models with mapping and image analysis of architecture surfaces it is possible to achieve useful representations and visualization of conservative specifications; three-dimensional representations of FAUUSP building have been used as an effective tool for studying, detecting and evaluate present conditions and possible conservative strategies. Point cloud models, opportunely processed, not only allow to understand and assess morphological features, but can also be configured as multi-layered 3D data bases for multidisciplinary purposes, including visual detections of material specifications and deteriorations by means of and high-definition digital visualizations for non-destructive investigations (Alexakis et al., 2015).
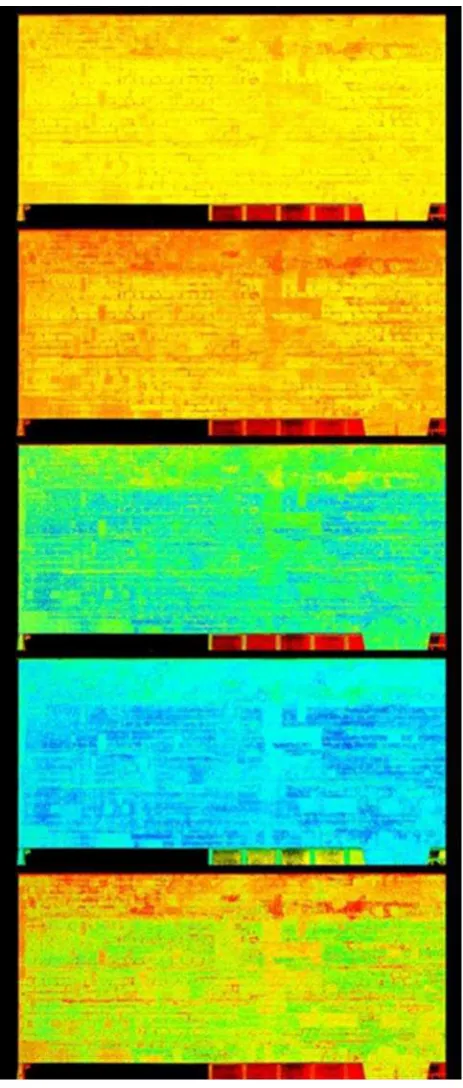
Figure 5. “False coloured” visualization of a sample are of the point cloud
INTENSITY VALUES
File min max gamma
03_MR_PV1 0,15 0,99 0,5
04_MR_PV1 0,2 0,99 0,5
05_MR_PV1 0,2 0,4 0,5
06_MR_PV1 0,1 0,4 0,5
11_MR_PV1 0,245 0,5 0,5
Table 4. Intensity values data tested during the post-processing in order to highlight surface specifications to be detected
One of the main outcomes resulting from this integrated procedure is the definition of guidelines for the interventions on structures and surfaces for heritage conservation. This procedure can be very effective to develop operative tools in order to identify, analyse and monitor state of conservation by processing the point clouds.
Some considerations can be outlined in order to point out a possible procedure to exploit the 3D survey methodologies for enhancement and conservation of cultural assets:
- interdisciplinary competences are needed in order to manage survey procedures and cultural heritage analysis;
- outcomes from 3D data acquisition can be a useful integration of non-destructive techniques and monitoring technologies; - knowledge of deterioration mechanisms acting on original materials and structures and identification of critical areas for deeper investigations is a requirement in order to finalize the 3D acquisition;
- awareness of accuracy and limits of different technologies is the starting point to merge metric survey purposes with a multidisciplinary approach to diagnosis (Maietti & Balzani, 2008).
3.2 Results and limitations
The conditions in which the survey is developed (location, light, humidity, etc.) are discriminating for a rigorous evaluation of the intensity value for diagnostic purposes. Different intensities can result from different issues such as scan positions, different angle of incidence, and atmospheric conditions.
The knowledge of these data enables the collection of information through homogeneous areas on the basis of the angle of incidence and the kind of surface material; the intensity variation from point to point can be used to derive information about materials and the degradation of the investigated surface. Unlike the geometric characteristics, the surface qualities are not uniquely determined and must be carefully interpreted by comparison with other direct surveys.
In the case of the FAUUSP building survey and post-processing, several tests on intensity value were performed in order to analyse the 3D point cloud for supporting conservative issues. Different display variations of the surveyed intensity value allowed selecting the best display mode for highlighting specific surface characteristics. For example, in data processing, it was critical to get the best possible visualization of the concrete additions included in the four elevations during a previous restoration work; or to analyse the amount of surface involved in biological deposits.
Therefore, to efficiently manage this integrated process, a multidisciplinary analysis is needed (Bianchini, 2014); by integrating historical documentation, 3D survey, macroscopic analyses and colorimetric characterization, it is possible to collect and merge historical, metric and conservative data. Based on this integrated procedure it is possible to achieve thematic drawings/representations in which to display the surface areas showing different reactions in the reflection of the laser beam.
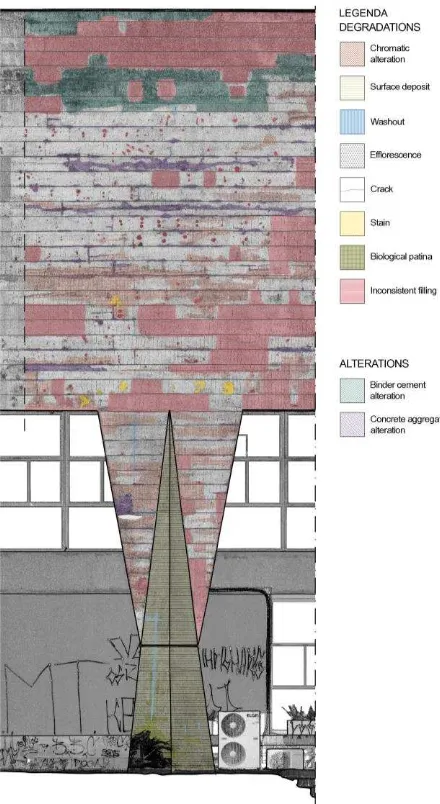
Figure 6. Data representation of a sample of elevation; above, view of the CAD two-dimensional representation superimposed
to the DEM; below, example of degradation characterization
4. CONCLUSIONS
In order to achieve an effective technology and methodology transfer on diagnosis activities of the facades deterioration (towards a future complete analysis of all the surfaces of the four façades), a seminar took place at the FAUUSP, organized by the Centro de Preservação Cultural of São Paulo University, during which the staff of the DIAPReM research center taught the methodology related to:
- representation by 3D database inquiring of façades and plans of the whole building;
- macroscopic analysis of the surfaces degradation and their classification and nomenclature.
The purpose of this seminar was to train the University of São Paulo staff to continue and complete the characterization of the state of conservation on the whole building.
The processing of 3D data acquired can be an extremely valuable support in identifying surface’ specifications that need further investigation as an additional element of assessment for conservation purposes, but should always be considered along with the results of other diagnostic surveys and keeping in mind that every situation can have different characteristics that must be carefully considered. For these reasons, the integrated survey carried out at the FAUUSP has been managed first of all from a methodological point of view.
Figure 7. Detail of degradation mapping
In addition to the seminar, two open conferences were held regarding: Integrated Architectural Survey: 3D Laser scanner technology; and The integrated diagnostic survey in the framework of conservative strategies: the use of the intensity value as an integrated tool for diagnostic characterization/analysis of the state of conservation.
ACKNOWLEDGEMENTS
The project has been developed by DIAPReM Center – Development of Integrated Automatic Procedure for Restoration of Monuments – Department of Architecture, University of Ferrara, Consorzio Futuro in Ricerca. Scientific responsible: Marcello Balzani; Project Coordinator: Luca Rossato; Topographic survey, 3D laser scanner survey and representations: Guido Galvani, Daniele Felice Sasso; Diagnostic analysis: Federica Maietti.
The grant from Keeping it the Modern program of the Getty Foundation financed the survey; the funds are administrated by FUSP (Fundação de Apoio à Universidade de São Paulo) and The International Archives of the Photogrammetry, Remote Sensing and Spatial Information Sciences, Volume XLII-2/W3, 2017
the project is hosted by FAUUSP (Faculdade de Arquitetura e Urbanismo da Universidade de São Paulo). The formation seminar that took place at FAUUSP, was organized by the Centro de Preservação Cultural (Director: Mônica Junqueira de Camargo), and was financed by the University of São Paulo. FAUUSP Getty Grant team: General coordinator: Maria Lucia Bressan Pinheiro; Tasks coordinators: Claudia Terezinha A. Oliveira; Antonio Carlos Barossi; Beatriz Mugayar Kühl; Team members: Norberto Corrêa da Silva Moura; Renata Cima Campiotto; Fabio Gallo Júnior, Ana Paula Arato Gonçalves; Silvio Oksman; Rodrigo Vergili; Graduate student: Carmen Silvia Saraiva Masseo de Castro; Undergratuate students: Leticia de Almeida Chaves; Eric Machado do Amaral Palmeira; Luiza do Carmo M. G. Nadalutti.
REFERENCES
Alexakis, E., Kiousi, A. and Moropoulou, A., 2015. 3D representation of decay processes on cultural assets as a diagnostic tool. In: Proceedings of 8th National Conference on NDT of the Hellenic Society of NDT (HSNT), Athens, Greece.
Artigas Camargo, R., 2015. Vilanova Artigas. Terceiro Nome, São Paulo.
Balzani M., Maietti, F., 2015. Integrated methodologies for documentation and restoration of Modern architecture: survey and representation of the “Casa das Canoas” by Niemeyer. In: Proceedings of the XIII International Forum “Le Vie dei
Mercanti” – Heritage and Technology. Mind. Knowledge.
Experience. La scuola di Pitagora editrice, Napoli, pp. 878-887.
Balzani, M., Maietti F., Medici, M., 2016. The BIM representation for documentation and historical-critical analysis of the Modernist heritage. Disegnarecon 9/2016.
Barossi, A. C. (Ed.), 2016. O edifício da FAU-USP de Vilanova Artigas, Editora da Cidade, São Paulo.
Bianchini, C., 2014. Survey, Modelling, Interpretation as multidisciplinary components of a knowledge system. In:
Scientific Research and Information Technology. Vol. 4, Issuse 1 (2014), pp. 15-24.
Cavalcanti, L., 2003. When Brazil was modern : guide to architecture, 1928-1960. Princeton Architectural Press, New York.
Eppich R., Garcia Grinda J.L., 2015. Management Documentation Indicators & Good Practices at Cultural Heritage Palces. The International Archives of the Photogrammetry, Remote Sensing and Spatial Information Science, Volume XL-5/W7.
Fang, W., Huang, X., Zhang, F., Li, D., 2015. Intensity correction of terrestrial laser scanning data by estimating laser transmission function. IEEE Transactions on Geoscience and Remote Sensing, 53(2): 942-951.
Giandebiaggi, P., Vernizzi, C. (Eds.), 2014. Italian survey & international experience, Atti del 36° Convegno Internazionale dei Docenti della Rappresentazione - Undicesimo Congresso UID, Parma 18-20 settembre 2014, Gangemi Editore, Roma.
Gomes, L., Regina, O., Bellon, P. and Silva, L., 2014. 3D reconstruction methods for digital preservation of cultural heritage: A survey. Pattern Recognition Letters, Volume 50, 1 December 2014, pp. 3-14.
Jones, D.M. (ed.), 2011. 3D Laser Scanning for Heritage. Advice and guidance to users on laser scanning in archaeology and architecture. English Heritage Publishing, Swindon.
Koller, D., Frischer, B., Humphreys, G., 2009. Research Challenges for Digital Archives of 3D Cultural Heritage Models. ACM Journal on Computing and Cultural Heritage, Vol. 2, No. 3, Article 7.
Maietti, F., Balzani, M., 2008. Development of integrated procedures for diagnosis of architectonical surfaces. Dimensional data and surface aspects. In: Proceedings of the International Workshop SMW08 - In situ monitoring of monumental surfaces, 27-29 October 2008, Florence, Edifir Edizioni, Firenze, pp. 131-140.
Maietti, F., Piaia E., Brunoro S., 2016. Diagnostic Integrated Procedures aimed at monitoring, Enhancement and Conservation of Cultural Heritage Sites. In: Proceedings of the
International Conference “SBE Malta 2016. Europe and the
Mediterranean: Towards a Sustainable Built Environment”,
Gutenberg Press, Malta, pp. 309-316.
Manferdini A. M., Galassi M., 2013. Assessments for 3D reconstructions of Cultural Heritage using digital technologies.
International Archives of the Photogrammetry, Remote Sensing and Spatial Information Sciences, Volume XL-5/W1.
Montaner, J.M., 2014. Arquitetura e cŕtica na Aḿrica Latina.
Romano Guerra Editora, São Paulo.
Quezado Deckker, Z., 2001. Brazil built: the architecture of the modern movement in Brazil. Taylor & Francis, New York.
Remondino F., 2011. Heritage Recording and 3D Modeling with Photogrammetry and 3D Scanning. Remote Sens. 3, 1104-1138
Rubini R., Araújo Azevedo D., 2014. Housing in São Paulo, 1947-1975. Paesaggio Urbano 2/2014, pp. I-XIX.
Segawa, H.M., 1998. Arquiteturas no Brasil, 1900-1990. EDUSP, São Paulo.
Vilanova Artigas, J.B., 1997. Vilanova Artigas. Instituto Lina Bo e P.M. Bardi, São Paulo.
Williams, R. j., 2009. Brazil:Modern Architectures in History. Reaktion books, London.
Zlota R., Bossea M., Greenopb K., Jarzaba Z., Juckesb E., Robertsa J., 2014. Efficiently capturing large, complex cultural heritage sites with a handheld mobile 3D laser mapping system.
Journal of Cultural Heritage 15 (2014) 670–678.