USER FRIENDLY OPEN GIS TOOL FOR LARGE SCALE DATA ASSIMILATION
– A CASE STUDY OF HYDROLOGICAL MODELLING
Prasun Kumar Gupta a, *,
a
Indian Institute of Remote Sensing, Indian Space Research Organisation, Dehradun prasun@iirs.gov.in
XXII ISPRS Congress
KEY WORDS: Open systems, GIS, Software
ABSTRACT:
Open source software (OSS) coding has tremendous advantages over proprietary software. These are primarily fuelled by high level programming languages (JAVA, C++, Python etc...) and open source geospatial libraries (GDAL/OGR, GEOS, GeoTools etc.). Quantum GIS (QGIS) is a popular open source GIS package, which is licensed under GNU GPL and is written in C++. It allows users to perform specialised tasks by creating plugins in C++ and Python. This research article emphasises on exploiting this capability of QGIS to build and implement plugins across multiple platforms using the easy to learn – Python programming language.
In the present study, a tool has been developed to assimilate large spatio-temporal datasets such as national level gridded rainfall, temperature, topographic (digital elevation model, slope, aspect), landuse/landcover and multi-layer soil data for input into hydrological models. At present this tool has been developed for Indian sub-continent. An attempt is also made to use popular scientific and numerical libraries to create custom applications for digital inclusion.
In the hydrological modelling calibration and validation are important steps which are repetitively carried out for the same study region. As such the developed tool will be user friendly and used efficiently for these repetitive processes by reducing the time required for data management and handling. Moreover, it was found that the developed tool can easily assimilate large dataset in an organised manner.
* Corresponding author.
1. INTRODUCTION
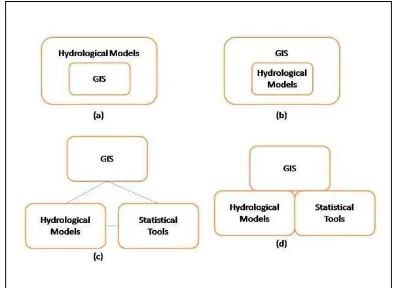
Water is essential for all life forms on Earth and various models have been successfully used to study this movement of water in its successive stages of the hydrologic cycle. Data intensive simulations are being carried out since 1960‟s to model the spatio-temporal dynamics of important hydrological processes. The use of Geographic Information System (GIS) has enabled scientists to use well established practices and standards to replicate hydrologic systems. The GIS data sets used are primarily derived from remote sensing (RS) and field derived data-sets. Sui and Maggio, 1999 have detailed, different widely used approaches to integrate GIS with hydrological modelling (Figure 1). As evident the four coupling (or integration of GIS with hydrological modelling) approaches discussed, are constrained by technology available at the time. Today Geographic Information (GI) systems provide customization facilities allowing users to step beyond standard softwares owing to difficulties in system integration of modelling, statistical data analysis and databases (Bivand and Lucas, 2000).
The current study challenges the use of readymade off-the-shelf software capabilities in making a semi-distributed macro-scale hydrological model called Variable Infiltration Capacity (VIC) model (Gao et al, 2010), efficient in terms of usage, calibration and validation. The scientific challenge in addressing all environmental problems in not only the development of remote
sensing sensors and algorithms but more importantly handling large data sets, processing them efficiently and generating usable products off the same (Barnsley, 1999). VIC was run on Indian sub-continent and required pre-post processing of geospatial data and a user friendly interface for calibrations.
Figure 1 Integrating GIS with hydrological modeling (a) Embedding GIS in Hydrological models (b) Embedding hydrological models in GIS (c) Loose coupling (d) Tight
coupling (Adapted from Sui & Maggio, 1999) International Archives of the Photogrammetry, Remote Sensing and Spatial Information Sciences, Volume XXXIX-B4, 2012
XXII ISPRS Congress, 25 August – 01 September 2012, Melbourne, Australia
2. BACKGROUND OF OPEN SOURCE GIS
GIS has become an essential tool in hydrology (Goodall and Maidment, 2009) and proprietary GIS softwares can fulfil most of the requirements of functionality (Steiniger and Hay, 2009). Proprietary softwares, however, fall short in terms of interoperability, software transparency and data transferability (Jolma et al, 2000). The free software foundation (www.fsf.org) promotes the use of free softwares as they are free from restriction; sharing policies and copy; to learn and adapt; to work with any system with considerable reliability (Stallman, 1999). Every aspect of computing is dominated by free and open source software (FOSS) as evident from the fact that 66.17% of all web servers are running Apache, which is an open source web server software (Netcraft, 2011). Steiniger and Bocher, 2009 have studied the entire gamut of FOSS for Geo (FOSS4G) projects and their relationships (Sanz-Salinas and Montesinos-Lajara, 2009) as shown in Figure 2. The existence of many active and diverse software libraries which act as central points for almost all projects has fuelled the current study.
Figure 2 Relationships between FOSS4G Projects (Sanz-Salinas and Montesinos-Lajara, 2009)
3. METHODOLOGY
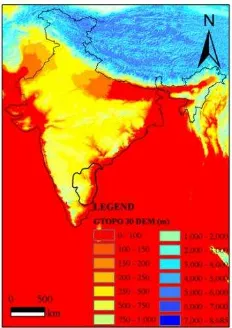
The VIC hydrological model requires several RS, GIS inputs, soil and vegetation parameters and other calibrating parameters, as shown in Table 1. Figure 3 shows few of RS and GIS derived inputs (Global Topographic (GTOPO) Digital Elevation Model (DEM) and mask file).
Figure 3 DEM and boundary file for VIC input
Table 1 Various VIC inputs for model run S.No 2. Rooting depths of each
of the „v‟ vegetation been divided and N is the number of days the model is run for.
As seen from Table 1, the large number of input parameters, their syntactic and semantic segregation and their scale and temporal variation creates a huge challenge along with assimilating them to create text/ ASCII input files for VIC model run. The study takes advantage of the numerous libraries available which can be used to build a GIS on top of it. With this approach an application is built which provide a user friendly graphical user interface to translate requests to library functions (Neumann and Hugentobler, 2008). A prime example of such type of software is Quantum GIS or QGIS (www.qgis.org). QGIS uses geospatial data abstraction library (GDAL/OGR) for reading and writing to data sources, PROJ4 for reprojecting vector layers on the fly and GEOS for intersection tests between geometries and (selection) rectangles. QGIS allows users to perform specialised tasks by creating plugins in C++ and Python. This research article emphasises on exploiting this capability of QGIS to build and implement plugins using Python programming language. Using these facilities the present study attempts to develop a tool to assimilate large spatio-temporal datasets such as national level gridded rainfall, temperature, topographic (DEM, slope, aspect), landuse/landcover and multi-layer soil data for input into hydrological models. In this study, in addition to QGIS functionalities, some plugins in Python have been programmed for creation of VIC data input files.
4. RESULTS
The plugin was developed in Python. The plugin interface was developed through Qt4 designer. This application is a tool for designing and building graphical user interfaces (GUIs) from International Archives of the Photogrammetry, Remote Sensing and Spatial Information Sciences, Volume XXXIX-B4, 2012
XXII ISPRS Congress, 25 August – 01 September 2012, Melbourne, Australia
Qt4 components. Qt is free and open source framework. PyQt4 is a Python binding of the cross-platform GUI toolkit Qt4. Like Qt4, PyQt4 is a free software.
For the development of graphics display plugin Qgis, Qt4 and pyQt4 libraries have been used. The necessary files of a QGIS plugin and their structure is as follows:
PYTHON_PLUGINS_PATH/ translation of the .qrc file described above to Python, form.ui is the GUI created by Qt-Designer and form.py is the translation of the form.ui described above to Python.
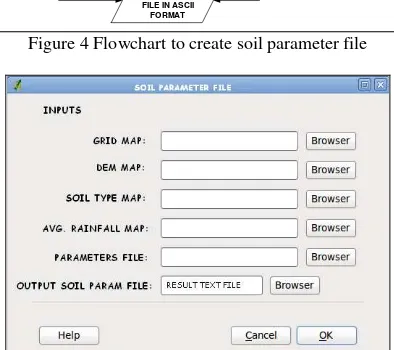
Figures 4 and 5 display the flowchart and user interface of the developed plugin of a single module out of various as sample. In places where sensitive parameters need to be changed frequently to get desired results, the plugin allows the user to change them during runtime in a simple manner. As such the time required to make the changes in the actual parameter files was saved.
Figure 4 Flowchart to create soil parameter file
Figure 5 User Interface to generate Soil Parameter file
5. CONCLUSIONS tool that is the best in its domain. The plugin also allows further modifications to be made in order to enhance its efficiency to any other area of interest.
Lastly, this study proves that use of FOSS tools and software libraries have an upper hand over proprietary GIS tools when it comes to developing custom user-specific applications for hydrological modeling. Future works in this area can be concentrated on merging the benefits of semantic assimilation of datasets so as to avoid programming overheads in data conversion.
REFERENCES
Barnsley, M. J., 1999. Digital remote sensing data and their characteristics. Geographical Information Systems: Principles, Techniques, Applications, and Management, pp. 451-466.
Bivand, R., & Lucas, A., 2000. Integrating models and geographical information systems. Geocomputation, pp. 331-364. Taylor & Francis London.
Gao, H., Q. Tang, X. Shi, C. Zhu, T. J. Bohn, F. Su, J. Sheffield, M. Pan, D. P. Lettenmaier, and E. F. Wood, 2010. Water Budget Record from Variable Infiltration Capacity (VIC) Model. In Algorithm Theoretical Basis Document for Terrestrial Water Cycle Data Records (in review).
Goodall, J. L., & Maidment, D. R., 2009. A spatiotemporal data model for river basin‐scale hydrologic systems. International Journal of Geographical Information Science, 23(2), pp. 233-247.
Jolma, A., Ames, D. P., Horning, N., Mitasova, H., Neteler, M., Racicot, A., & Sutton, T., 2008. Free and Open Source Geospatial Tools for Environmental Modelling and Management. Developments in Integrated Environmental Assessment, 3, pp. 163-180.
Neumann, A. and Hugentobler, M., 2008. Open-source GIS libraries. Encyclopedia of GIS, pp.816-820. Springer Science Business Media LLC, NY.
Netcraft, 2011. “May 2011 Web Server Survey | Netcraft,” http://news.netcraft.com/archives/2011/05/02/may-2011-web-server-survey.html (31-Jan-2012).
Sanz-Salinas, J.-G., & Montesinos-Lajara, M., 2009. Current Panorama of the FOSS4G Ecosystem. Novatica, X(2), pp. 43-51.
Stallman, R., 1999. The GNU Operating System and the Free Software Movement. Open Sources: Voices from the open source revolution, pp. 53-70. O‟Reily & Associates CA. International Archives of the Photogrammetry, Remote Sensing and Spatial Information Sciences, Volume XXXIX-B4, 2012
XXII ISPRS Congress, 25 August – 01 September 2012, Melbourne, Australia
Steiniger, S., & Bocher, E., 2009. An overview on current free and open source desktop GIS developments. International Journal of Geographical Information Science, 23(10), pp. 1345-1370.
Steiniger, S., & Hay, G. J., 2009. Free and open source geographic information tools for landscape ecology. Ecological Informatics, 4(4), pp. 183-195.
Sui, D. Z., & Maggio, R. C., 1999. Integrating GIS with hydrological modeling: practices, problems, and prospects. Computers, environment and urban systems, 23(1), pp. 33-51.
ACKNOWLEDGMENT
This work is partly funded by Indian Space Research Organisation – Geosphere Biosphere Program (IGBP). Thanks are due to Dr P.S. Roy, Dr V.K. Dadhwal, Prof P.L.N. Raju, Dr S. K. Srivastav, Dr V. Garg and Drs T. Zahra for their constant guidance, support and encouragement. Thanks to Dr Rajan (IIIT-H) and Dr S. P. Aggarwal who introduced me to Python GUI dev and VIC respectively.
International Archives of the Photogrammetry, Remote Sensing and Spatial Information Sciences, Volume XXXIX-B4, 2012 XXII ISPRS Congress, 25 August – 01 September 2012, Melbourne, Australia