SPATIAL INTERPOLATION AS A TOOL FOR SPECTRAL UNMIXING OF REMOTELY
SENSED IMAGES
Li Xi*, Chen Xiaoling
State Key Laboratory of Information Engineering in Surveying, Mapping and Remote Sensing, Wuhan University, Wuhan, China - [email protected]
Commission VII, WG VII/4
KEY WORDS: Land Cover, Mapping, Analysis, Algorithms, Image, Spectral
ABSTRACT:
Super resolution-based spectral unmixing (SRSU) is a recently developed method for spectral unmixing of remotely sensed imagery, but it is too complex to implement for common users who are interested in land cover mapping. This study makes use of spatial interpolation as an alternative approach to achieve super resolution reconstruction in SRSU. An ASTER image with three spectral bands was used as the test data. The algorithm is evaluated using root mean square error (RMSE) compared with linear spectral unmixing and hard classification. The result shows that the proposed algorithm has higher unmixing accuracy than those of the other comparative algorithms, and it is proved as an efficient and convenient spectral unmixing tool of remotely sensed imagery.
* Corresponding author.
1. INTRODUCTION
Classification of remotely sensed images has long been an issue in remote sensing community, since it is indispensable for land cover mapping which plays an important role in global change studies. Conventional technique of image classification, also called hard classification, labels each remote sensing pixel with a single class, and mixed pixels which comprise two or more classes are not considered. Thus, the problem of mixed pixels hinders precise land cover mapping when using hard classification, since all mixed pixels are classified into single classes.
To overcome the problem of mixed pixels, spectral unmixing was proposed to decompose mixed pixels into several classes and corresponding abundances, which reflect the land cover types more accurately. Typical spectral unmixing algorithms can be categorized into two types, linear spectral unmixing (Roberts, Gardner et al., 1998; Heinz and Chang, 2001) and nonlinear spectral unmixing (Huang and Townshend, 2003; Liu, Seto et al., 2004; Lee and Lathrop, 2006). In linear spectral unmixing, the spectrum of a mixed pixel was viewed as the weighted summation of spectra of different endmembers in the pixel, whereas the weight is the proportion of the endmember in the pixel (Heinz and Chang, 2001). In nonlinear spectral unmixing, the mechanism of the spectral mixture mechanism is more nonlinear or unknown, and a variety of algorithms, including support vector machine model (Brown, Gunn et al., 1999), neural network model (Liu, Seto et al., 2004; Lee and Lathrop, 2006) and physical model (Kimes and Nelson, 1998), were proposed to retrieve the proportions of different endmembers. Both existing linear and nonlinear spectral unmixing focus on how to utilize the spectral information of pixels, and the spatial neighbourhood information is always ignored although a small number of algorithms attempt to utilize the spatial information (Roessner, Segl et al., 2001). Recently, a new model named super resolution based spectral unmixing (SRSU) was proposed to utilize the spatial information in spectral unmixing (Li, Tian et al., 2011). This model is totally different from the conventional models, the
linear and nonlinear models, since it focuses on spatial dimension rather than spectral dimension. SRSU has shown good performance in land cover mapping, and is a potential powerful approach in the spectral unmixing family. However, this model is developed in primary status that an image database providing prior knowledge is required, and this perquisite makes the model inconvenient for use. This study aims to propose a simple way to implement SRSU, and evaluates its performance compared with conventional spectral unmixing.
2. BACKGROUND
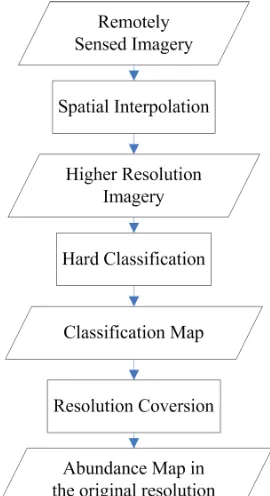
In this section, the previously developed super resolution-based spectral unmixing (SRSU) model is introduced. The essence of SRSU is that downscaling a remotely sensed image helps to reduce spectral mixing in the image and hence the downscaled (super resolution) image can be processed with a hard classification method to produce the land cover proportion map in the original resolution. The SRSU has following steps as following steps 1) Use a super resolution technique to downscale a remotely sensed image to a super resolution image; 2) Classify the super resolution image with a hard classification method; 3) Convert the super resolution classification map to original resolution to produce a set of proportion maps for different endmembers, which are the product of spectral unmixing.
The key technique used in SRSU is super resolution reconstruction, which refers to reconstruct a higher resolution image from the original image. Since this reconstruction is ill-posed from a mathematical perspective, prior information should be introduced to regulate this process. In super resolution reconstruction, prior information is provide by a training database, which reflects the relationship of low resolution images and their corresponding high resolution images in natural scenes. A number of algorithms have been proposed to merge the training database into the super resolution reconstruction (Freeman et al., 2002; Kim and Kwon, 2010), but each algorithm is complex.
International Archives of the Photogrammetry, Remote Sensing and Spatial Information Sciences, Volume XXXIX-B7, 2012 XXII ISPRS Congress, 25 August – 01 September 2012, Melbourne, Australia
3. METHODOLOGY
In SRSU, super resolution reconstruction aims to improve the spatial resolution of images, therefore spatial interpolation may be an alternative way to achieve this purpose, although a lot of detail information in the higher resolution image can not be restored. At a first glance, simple interpolation of an image will not perform well in downscaling an image. Fortunately in SRSU, the super resolution classification map will be converted into the original resolution, and this conversion may alleviate the impact of downscaling error on the SRSU. Therefore, it is interesting to evaluate the role of spatial interpolation instead of super resolution reconstruction in SRSU, because this alternative technique is particularly simple.
The spatial interpolation based spectral unmixing (SISU) has similar steps as the SRSU, the only difference is replacing the super resolution reconstruction with spatial interpolation. The SISU has following steps as
1) Use spatial interpolation to downscale a remotely sensed image to higher resolution.
2) Classify the obtained higher resolution image.
3) Convert the classification map into the proportion maps of different endmembers in original resolution, and the final spectral unmixing result is derived.
The algorithm is also illustrated in Figure 1. In this study, a bilinear interpolation method was employed for spatial interpolation, since it is the easiest interpolation method to achieve image downscaling.
Figure 1. The flowchart of spatial interpolation-based spectral unmixing
4. EXPERIMENTS
4.1 Study area and data
The study area and data are the same as the initial work of super resolution-based spectral unmixing (Li, Tian et al., 2011). The study area was located in a lake in Massachusetts, U.S.A. An
ASTER image patch was selected as the study material for spectral unmixing. To make the image comprise enough mixed pixel, the ASTER image was resampled to 30 m resolution. Finally the ASTER image has 120×102 pixels and three
spectral bands (Figure 2).
Besides, an aerial photograph with resolution of 0.5 m was used to generate the reference data. At first, the aerial photograph was visually interpreted to three types, evergreen tree, bare soil / deciduous tree and water. Then the high resolution interpreted map was converted into 30 m resolution, which was viewed as the reference data for the spectral unmixing result, as shown in Figure 3.
Figure 2. The ASTER image (Band 2) for spectral unmixing, at 42°25’ 32’’N , 72°16’ 39’’ W
4.2 Procedure
The procedure of the experiments has following steps: 1) Manually select sample of the three land cover types from
the ASTER image.
2) The ASTER image processed for spectral unmixing, using the endmember spectrum in step 1. The image magnification time varies from 2 to 6, thus there are five results for the spectral unmixing.
3) Linear spectral unmixing method was also used to generate spectral unmixing result to compare with the proposed algorithm. The LSU was achieved with fully constrained least square (FCLS) algorithm (Heinz and Chang, 2001) and multiple endmember spectral mixture analysis (MESMA) (Roberts, Gardner et al., 1998), which are two kinds of widely used spectral unmixing algorithms. 4) Hard classification was used as another comparative
algorithm. And a support vector machine was employed as the classifier.
4.3 Results
Using the proposed spectral unmixing algorithm and three comparative algorithms, the ASTER image was finally unmixed as Figures 4-6 show. For the proposed algorithm, only the result with magnification factor of four is shown. Since MESMA has resulted in some negative values, result of MESMA is inconvenient to show.
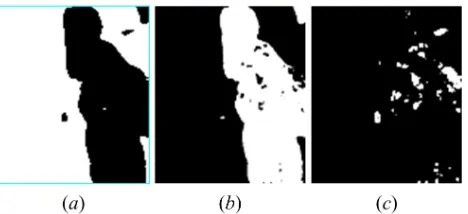
Figure 3. The fractional abundance map of reference data (a) water, (b) bare soil / deciduous tree and (c) evergreen tree
International Archives of the Photogrammetry, Remote Sensing and Spatial Information Sciences, Volume XXXIX-B7, 2012 XXII ISPRS Congress, 25 August – 01 September 2012, Melbourne, Australia
Figure 4. The fractional abundance derived from spatial interpolation-based spectral unmixing, where magnification factor was set to four (a) water, (b) bare soil / deciduous tree and (c) evergreen tree
Figure 5. The fractional abundance derived from FCLS (a) water, (b) bare soil / deciduous tree and (c) evergreen tree
Figure 6. The fractional abundance derived from hard classification (a) water, (b) bare soil / deciduous tree and (c) evergreen tree
As the ASTER image was unmixed, it is necessary to evaluate accuracy of different unmixing algorithms. Root mean square error (RMSE) was used as the error index using the following formula:
2 1
ˆ
(
)
m
ij ij
i i
p
p
R
m
=
−
=
∑
(1)
where Ri is the RMSE value of ith endmember, pij is the real
fractional abundance of ith endmember in jth pixel, pˆij is the estimated fractional abundance of ith endmember in jth pixel. In addition, to evaluate the total RMSE value of all endmembers, RMSE values of all endmembers should averaged as the average RMSE. Then RMSE values of the proposed spatial interpolation (SI) algorithm and other algorithms were listed in Table 1.
RMSE Algorithm Evergreen
tree
Deciduous tree /
bare soil Water Average SI (M=2) 0.0599 0.1807 0.1748 0.1385 SI (M=3) 0.0539 0.1136 0.1084 0.0920 SI (M=4) 0.0499 0.0826 0.0768 0.0698 SI (M=5) 0.0542 0.1130 0.1082 0.0918 SI (M=6) 0.0583 0.1178 0.1119 0.0960 FCLS 0.0844 0.2025 0.1705 0.1525 MESMA 0.1560 0.2408 0.2904 0.2291
Hard
classification 0.0819 0.1965 0.1905 0.1563
Table 1. RMSE values of different spectral unmixing algorithms, where M denotes the magnification factor
From Table 1, it is found that spatial interpolation-based spectral unmixing has higher accuracy than that of the MESMA, FCLS and hard classification, as the average RMSE values show. However, the performance of the proposed algorithm depends on the parameter, the magnification factor. The unmixing error reaches the bottom line when the magnification factor is equal to four, whereas other values of the factor resulted in different average RMSE values with large variation. Nevertheless, the proposed algorithm has higher accuracy than that of the LSU whatever the magnification factor is chosen. The result is interesting because only using a simple spatial interpolation is efficient to retrieve endmember proportion from mixed pixels, as this study shows. Although the spatial interpolation will absolutely ignore some detail information in the required higher resolution image, it is also effective since the resolution conversion in SRSU has reduced the impact of detail information in higher resolution. Thus spatial interpolation has great potential for spectral unmixing of remotely sensed imagery as this experiment shows.
5. CONCLUSION
SRSU is a new arising method for spectral unmixing of remotely sensed imagery, and has shown good performance in previous studies. However, training database in SRSU is a big obstacle for convenient use of SRSU. In this study, spatial interpolation, much easier to implement, is used as an alternative approach to achieve super resolution reconstruction. An experiment using ASTER image shows that this simplified version of SRSU also performs better than that of linear spectral unmixing and hard classification, since the RMSE of the proposed algorithm is smaller than that of the linear spectral unmixing. Among the different values of magnification factor, it was discovered that when the image is resampled to four times of the original size, the proposed algorithm shows the highest spectral unmixing accuracy.
This study opens a door to convenient use of SRSU, which will make more scholars to recognize the importance and power of SRSU. Admittedly, some important issues, such as the optimal spatial interpolation method and magnification factor, should be considered carefully in future studies. As a result, the land cover mapping from remotely sensed imagery will be more accurate by use of the improved SISU.
International Archives of the Photogrammetry, Remote Sensing and Spatial Information Sciences, Volume XXXIX-B7, 2012 XXII ISPRS Congress, 25 August – 01 September 2012, Melbourne, Australia
ACKNOWLEDGEMENTS
This research was supported by National Natural Science Foundation of China under grant no. 41101413 and Ph.D. Programs Foundation of Ministry of Education of China under grant no. 20110141120073.
REFERENCES
Brown, M., S. R. Gunn and H. G. Lewis, 1999. Support vector machines for optimal classification and spectral unmixing. Ecological Modelling, 120(2-3): pp. 167-179.
Freeman, W. T., T. R. Jones and E. C. Pasztor, 2002. Example-based super-resolution. IEEE Computer Graphics and Applications, 22(2): pp. 56-65.
Heinz, D. C. and C. I. Chang, 2001. Fully constrained least squares linear spectral mixture analysis method for material quantification in hyperspectral imagery. IEEE Transactions on Geoscience and Remote Sensing, 39(3): pp. 529-545.
Huang, C. and J. R. G. Townshend, 2003. A stepwise regression tree for nonlinear approximation: applications to estimating subpixel land cover. International Journal of Remote Sensing, 24(1): pp. 75-90.
Kim, K. I. and Y. Kwon, 2010. Single-Image super-resolution using sparse regression and natural image prior. IEEE Transactions on Pattern Analysis and Machine Intelligence, 32(6): pp. 1127-1133.
Kimes, D. S. and R. F. Nelson, 1998. Attributes of neural networks for extracting continuous vegetation variables from optical and radar measurements. International Journal of Remote Sensing, 19(14): pp. 2639-2663.
Lee, S. and R. G. Lathrop, 2006. Subpixel analysis of Landsat ETM+ using Self-Organizing Map (SOM) neural networks for urban land cover characterization. IEEE Transactions on Geoscience and Remote Sensing, 44(6): pp. 1642-1654.
Li, X., L. Tian, X. Zhao and X. Chen, 2011. A super resolution approach for spectral unmixing of remote sensing images. International Journal of Remote Sensing, 32(21): pp. 6091-6107.
Liu, W. G., K. C. Seto, E. Y. Wu, S. Gopal and C. E. Woodcock, 2004. ART-MMAP: A neural network approach to subpixel classification. IEEE Transactions on Geoscience and Remote Sensing, 42(9): pp. 1976-1983.
Roberts, D. A., M. Gardner, R. Church, S. Ustin, G. Scheer and R. O. Green, 1998. Mapping chaparral in the Santa Monica Mountains using multiple endmember spectral mixture models. Remote Sensing of Environment, 65(3): pp. 267-279.
Roessner, S., K. Segl, U. Heiden and H. Kaufmann, 2001. Automated differentiation of urban surfaces based on airborne hyperspectral imagery. IEEE Transactions on Geoscience and Remote Sensing, 39(7): pp. 1525-1532.
International Archives of the Photogrammetry, Remote Sensing and Spatial Information Sciences, Volume XXXIX-B7, 2012 XXII ISPRS Congress, 25 August – 01 September 2012, Melbourne, Australia