STUDY OF DISCRIMINATION BETWEEN PLANTATION AND DENSE SCRUB BASED
ON BACKSCATTERING BEHAVIOR OF C BAND SAR DATA
M. Iyyappan, S.S. Ramakrishnan and K. Srinivasa Raju
Institute of Remote Sensing, Anna University, Chennai, Tamil Nadu, India [email protected]
Commission VI, WG VI/4
KEY WORDS: Polarization, RISAT-I, ENVISAT ASAR
ABSTRACT:
The study about on landuse and landcover classification using multi polarization and multi temporal C-band Synthetic Aperture Radar (SAR) data of recently launched multi-mode of RISAT-1 (Radar Imaging Satellite) by Indian Space Research Organization (ISRO) and European satellite, Envisat ASAR data. The backscattering coefficient were extracted for various land features from C-band SAR data. The training sample collecting from satellite optical imagery of study and field visit for verification. The training samples are used for the supervised classification technique of maximum Likelihood (ML) algorithms, Neural Network (NN) and Support Vector Machine (SVM) algorithms were applied for fourteen different polarizations combination of multi temporal and multiple polarizations. The previous study was carried only four band combination of RISAT 1 data, the continuation of work both SAR data were used in this study. The Classification results are verified with confusion matrix. The pixel based classification gives the good results in the dual polarization of CRS - HH and HV of RISAT -1 compared to dual polarization Envisat ASAR data. Meanwhile the quad Polarization combination of Envisat ASAR data got better classification accuracy. The SVM classifiers has given better classification results for all band combination followed by ML and NN. The Scrub are better identified in EnviSat ASAR - VV & VH Polarization and Plantation are better identified in EnviSat ASAR - HH, HH-HV & HV Polarization. The classification accuracy of both Scrub and Plantation is about 80% in EnviSat ASAR - HH, VH & VV Polarization combination.
1. INTRODUCTION
Microwave remote sensing is an active remote sensing system and operates in microwave region of electromagnetic spectrum with different band has able to penetrate in adverse weather conditions and acquiring information at both day and nighttime. The basic principle of polarimetry is a science, acquiring, processing and analyzing the polarization state of a wave by a system (radar system or sensor or antenna). Polarization describes the nature of electromagnetic wave (EM waves) describes as transverse and longitudinal waves. Among these transverse wave are travel perpendicular to the wave propagation – up and down like ropes describes and dissection of the oscillation. The direction of polarization is based on the electric field vector of Electromagnetic waves. The wave equation used for Electromagnetic radiation therefore takes on the general form.
E (z,t) = E0 sin(k2-wt+Ø0) = E0 eiØ (1) Where,
E0– amplitude W = 2πν
Ø0– Phase difference
Ex (z,t) = E0x sin(k2-wt+Ø0) = E0 xeiØ (2) Ey(z,t) = E0y sin(k2-wt+Ø0+ε) = E0 eiØ (3)
1.1 Radar Polarimetry
Polarimetry is used in remote sensing for acquisition of polarimetric properties of objects or target, under observation and it’s possible to determine the physical properties of objects. A radar system is designed for transmit the horizontal and vertical components of electromagnetic wave and receive the
echoes or backscattered of these components from the scatters of the earth surface. On earth surface, different types of scatters are there, such as single scatter or single bounce scatter, even bounce or double bounce scatter and volume scattering or multiple scatter. These scattering mechanism changes the polarization behaviour of incident electromagnetic wave. The polarization modes such as HH, HV, VV and VH have changes with respect to different surface characteristic and properties. Wavelength, polarization, incident angle, look direction and spatial resolution are considering for acquiring information about an objects or targets and related to each other. The longer wavelength is used in radar system because it’s penetrating the cloud, raining season, vegetation and subsoil.
The surface factors are dielectric constant, geometry and surface roughness change the radar signals. The radar signal is more sensitive to surface roughness with high incidence angle than at low incidence angle. The surface roughness is a relative concept dependent on incident microwave wavelength. The dielectric constant describes the ability of materials to absorb, reflect and transmit microwave energy. Increase in high dielectric constant gives the strong radar returns pulse, which helps in orientation and look direction or incidence angle. The dielectric constant changes with soil moisture condition, wet soil having high soil moisture content and also has strong return pulse. The healthy vegetation biomass will increase with increase in dielectric properties as the multi-polarization SAR image is particularly useful for detecting land cover changes over large areas (Chinatsu Yonezawa et al 2004).
2.STUDY AREA
The study area (Theni district of Tamil Nadu) is geographically encompassed by Latitude 9◦39’N to 10◦30’N and Longitude 77◦00’E to 78◦30’E and it is a part of the Western Ghats, with mostly hilly area with intermittent plain, where
agriculture is a primary activity and 67% of the population lives in rural area. It is a semi-arid region covers maximum temperature is 38.5◦ C and the minimum temperature is 26.3◦ C. The average normal rainfall is about 829.8 mille meter (Agriculture University, TamilNadu). The district falls on southwest monsoon accounts for 21% North east monsoon being 46%, winter being 6% and summer being 27% of total annual rainfall. The district depends on Northeast monsoon rains, which are brought by the troughs of low pressure establishing in south Bay of Bengal between October and December. The maximum amount of water supply is fulfilled by Periyar River.
3. MATERIALS AND METHODS
The data sets are used in this research includes RISAT I, Envisat ASAR and Resourcesat II LISS IV data. The resolution of RISAT I CRS and MRS are 36m and 18m respectively, the resolution of Envisat ASAR is 20m and resolution of Resourcesat II data is 5.8m. The optical data of Resourcesat II data is mainly used for the selection of training sample for supervised classification. The software Envi 4.8 and ArcGIS 10.2 are used for processing, Classification and accuracy assessment of SAR data and mapping and output generation respectively.
3.1 Data Used
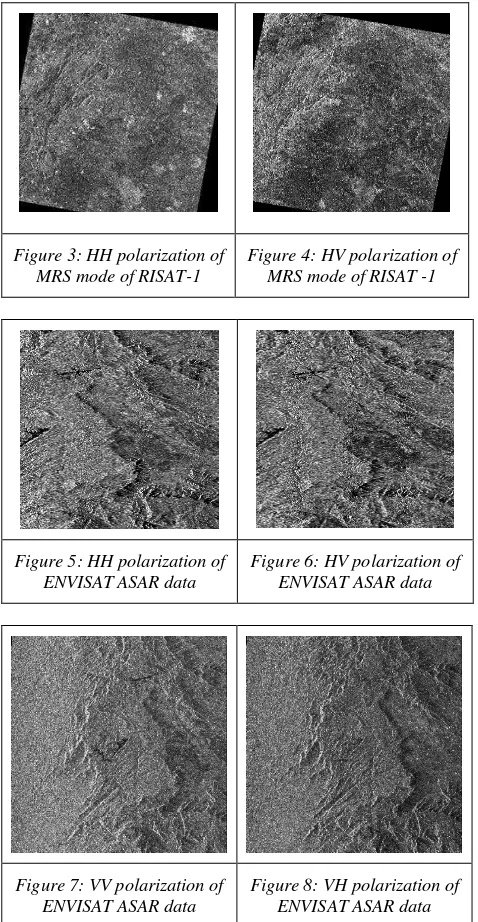
The Satellite imagery are generated by clipping for 410 square kilometers area for the study due to insufficient data sets for fully covers Theni districts. The Data sets are shown in figure (1 to 8) and it's characteristics are shown in Table 1.
Table 1: The data details of RISAT and ENVISAT ASAR
Figure 1: HH polarization of
In the operation of RISAT I, transmits and receives signals from objects and observed the incidence angles simultaneously. It is available in txt format with RISAT 1 data products. The Table 1 shows the incidence angle variation in different modes of RISAT 1 and Envisat ASAR data. The txt format file is converted into image by interpolation technique based on kriging method of interpolation. The RISAT1 data and incidence angle image are layered stack using band math function in ENVI 4.8. The backscattering values are calculated using this formula is given below.
σ0 (dB) = 20 log10 (DNp) – KdB +
10log10 (Sin (ip) /Sin (icenter)) (4) Where,
σ0 (dB) - backscatter coefficient i.e sigma 0 in dB
DNp- digital number or pixel gray-level count for the pixel p KdB -calibration constant in dB
ip - incidence angle for the pixel position p icenter - incidence angle at the scene center Satellite Mode Polariza
Similarly the backscattering values are extracted from Envisat ASAR data in SARSCAPE module in ENVI software. The classification results of single polarization is not satisfactory in distinguish the features because of automatic classification of SAR images is more complicated than interpretation of optical images (Salim Chitroub et al., 2002). In order to improve the classification accuracy the backscattering values with combination of multi temporal and mutli polarization of RISAT -1 and EnviSat ASAR are used for primary level of classification. Maximum likelihood(Lee et al., 1994), Neural Network (Chen et al., 1996, Ito et al., 1998) and Support Vector Machine (Fukuda et al., 2002) algorithms were carried out for fourteen different polarization band combination are
1) RISAT -1 CRS - HH & HV Polarization 2) RISAT -1 CRS - HH, HH-HV & HV Polarization 3) RISAT -1 MRS - HH & HV Polarization 4) RISAT -1 MRS - HH, HH-HV & HV Polarization 5) EnviSat ASAR - HH & HV Polarization
6) EnviSat ASAR - HH, HH-HV & HV Polarization 7) EnviSat ASAR - VV & VH Polarization
8) EnviSat ASAR - VV, VV-VH & VH Polarization 9) RISAT -1 CRS - HH & MRS - HV Polarization 10)RISAT -1 MRS - HH & CRS - HV Polarization 11)EnviSat ASAR - HH & VV Polarization 12)EnviSat ASAR - HH, VH & VV Polarization 13)EnviSat ASAR - HH, HV & VV Polarization 14)EnviSat ASAR - HH, HV, VH & VV Polarization
The training sets (ROI) were chosen from the imagery with help of ground truth and optical imagery of Resourcesat 2 LISS IV data (09-Nov-2011) for supervised classification and applied for all the combination. The supervised classifiers namely ML, NN and SVM work carried out in Envi 4.8 image processing software. The accuracy assessment carried out for the classified output of three classifiers using confusion matrix. with same ROI are used for the classification. The detailed methodology of the research is depicted in figure 9.
Figure9: Methodology Chart
4. RESULTS WITH DISCUSSION
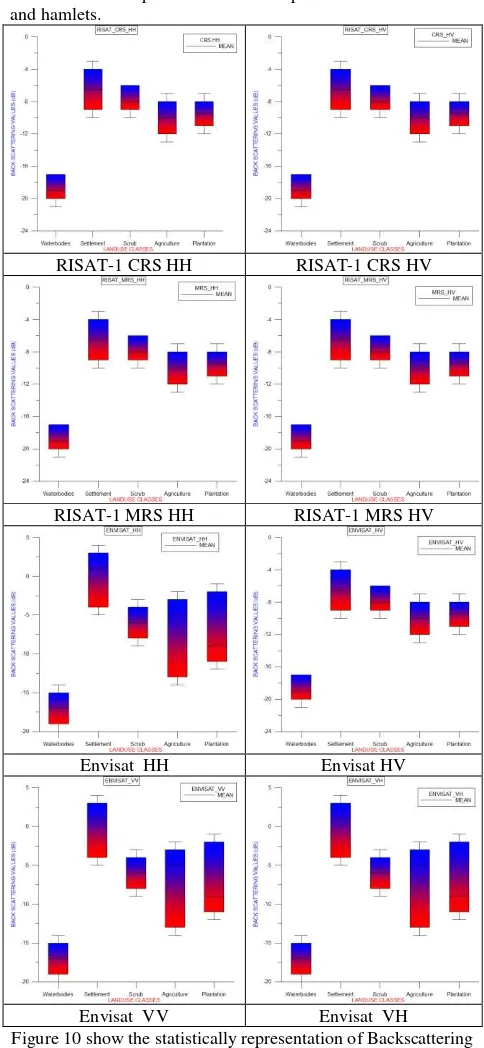
The Land cover classification were carried out using multi temporal/multi polarization of Envisat ASAR dual polarization of VV and VH data and Radarsat 1 HH polarization data (No-Wook Park et al., 2006). The same principle is adopted in this study, as the backscattering values (σ0) derived for natural landscape such as plantation, scrub, agriculture, water bodies and settlement are taken in account for the comparison between different polarization of RISAT-1 and ENVISAT ASAR data. The relative changes in satellite derived backscattering values (σ0) are clearly seen, as shown in figures10 and 11. Even though, backscattering values (σ0) for vegetation classification
show some discrepancies with mixed pixels due to settlements and hamlets.
RISAT-1 CRS HH RISAT-1 CRS HV
RISAT-1 MRS HH RISAT-1 MRS HV
Envisat HH Envisat HV
Envisat VV Envisat VH
Figure 10 show the statistically representation of Backscattering Values
Figure 11 represents the relationship between Backscattering coefficients, Polarization and Landuse classes The International Archives of the Photogrammetry, Remote Sensing and Spatial Information Sciences, Volume XL-8, 2014
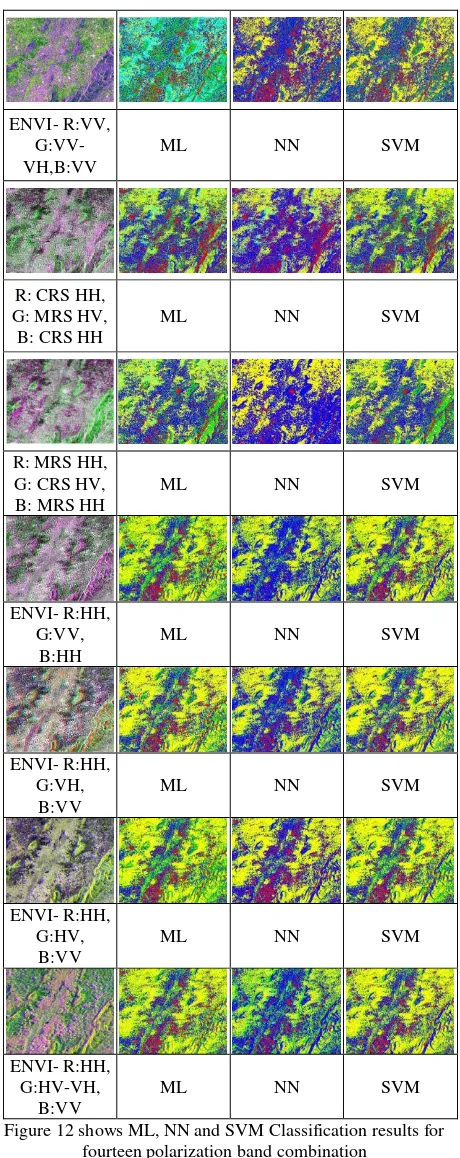
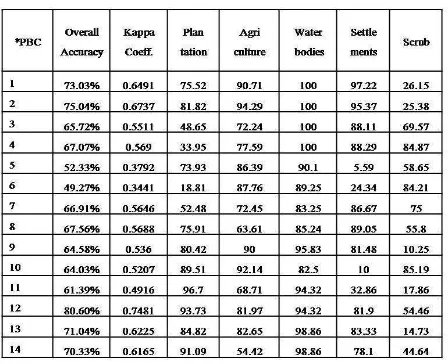
The classification results were barely satisfactory to distinguish landuse/cover classes as agriculture, plantation, scrub, water bodies and settlement as shown in figure 12. The accuracy assessments for three classifier using confusion matrix are carried out with same ROI and results are shown table 2,3 and 4. The dual polarization of RISAT-1 was achieved better classification results for all the features when compared with dual polarization of Envisat ASAR data. The dual polarization mode RISAT -1 CRS mode got better classification results and overall accuracy is 79.08%, 73.03% and 79.26% for maximum likelihood, Neural Network and Support Vector Machine are respectively. Whereas the Quad polarization combination of multi temporal and multi polarization of Envisat ASAR was achieved better classification with accuracy of 84.54%, 80.60 and 84.62%for maximum likelihood, Neural Network and Support Vector Machine are respectively.
Figure 12 shows ML, NN and SVM Classification results for fourteen polarization band combination
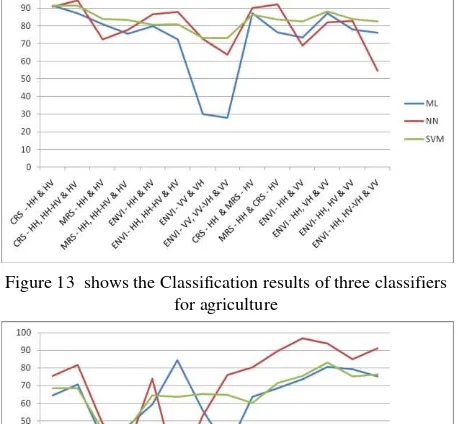
In this study, the agricultural classification was obtained good results in the SVM classifiers for all the band followed by NN classifier. The vertical polarization of VV and VH in Envisat ASAR data got very low values in the ML classifier. The orientation of agriculture of paddy fields are like horizontal surface so the presence of horizontal polarization having high classification results. The presence of vertical polarization got very low classification results as shown in figure 13.
The plantations of coconut trees having above 70 percentage of classification results in the combination of co polarized (HH & CRS R:HH,
VV) and Cross Polarized (HV & VH) of Envisat ASAR data and band combination of CRS Mode of RISAT data band. SVM Classifier giving the constant results compared to other classifier as shown in figure 14.
Figure 13 shows the Classification results of three classifiers for agriculture
Figure 14 shows the Classification results of three classifiers for Plantation
In Scrub, vertical polarization gives good results in volume scattering so that scrub gets maximum classification accuracy in vertical polarization combination VV and VH of Envisat ASAR and MRS - HH and CRS – HV of RISAT 1 in three classifiers. Similarly combination of CRS - HH and MRS – HV and combination of ENVISAT co-polarization of HH and VV has provided very less classification accuracy as shown in figure 15. Scrub is a vertical structure of vegetation having a volume scattering behavior as gives the high backscattering values when interacts with microwave polarization. The cross-polarized band gives good response related to multiple reflections within the vegetation volume (Brisco and Brown, 1998 and Wagner F. Silva et.al. 2009).
Figure 15 shows the Classification results of three classifiers for Scrub
The overall results for water bodies are classified with good results in all three classifiers with certain limitations as shown in figure 16. The shadow effects are also classified as water bodies. Water bodies like as smooth surface so SAR imagery get less strength of back scattering values. It is appearing as black in the imagery so the classification of water bodies is very easy to discriminate from other features.
Figure 16 shows the Classification results of three classifiers for Water bodies
The settlement has achieved good classification results in all band combination in SVM classifier. The combination of HH and HV of Envisat ASAR data got very low classification results as shown in figure 17. Further, more significant study is planned to explore the mixed pixel classification based on decomposition techniques.
Figure 17 shows the Classification results of three classifiers for Settlements
Table 2. The accuracy assessment results of confusion matrix for Maximum Likelihood Classification
*PBC: Polarization Band Combination
Table 3. The accuracy assessment results of confusion matrix for Neural Network Classification
Table 4: The accuracy assessment results of confusion matrix for Support Vector Machine Classification
5. CONCLUSION
The study expressed the pixel based classification of microwave SAR data for conventional approach for landuse/cover classification. The landuse/cover classification has certain limitation in this study such as the coarse resolution data set are used, pixel values mixed with other classes, the hilltop as classified as a settlement and shadow as classified as water body. Based on the classification results, the RISAT-1 dual polarization of CRS and MRS data has provided better classification results compared to the Envisat ASAR dual polarization data. The combination of fully polarimetric data of Envisat ASAR data has achieved good classification results. The fully polarimetric data of RISAT-1 data are will provide better classification accuracy when the data are accessible to the Indian user. The Quad polarization data is under process for the calibration. The fully polarimetric data provide significantly more information than conventional or multi-polarized images. Need to improve the classification results with polarimetric decomposition techniques for fully polarimetric data as well as high resolution SAR imagery. The Technology of SAR is increasing in use of Landuse/cover mapping and important role in the operational monitoring of changes underlying with Polarimetric data. The Scrub are better identified in dual polarization data of RISAT MRS mode, and EnviSat ASAR
Quad polarization combination. Plantation are better identified in RISAT CRS mode data and both dual & quad polarization EnviSat ASAR data. The classification accuracy of both Scrub and Plantation is about 80% in EnviSat ASAR - HH, VH & VV Polarization combination.
ACKNOWLEDGEMENT
The author would like to thank the Space Application Center (SAC), Ahmedabad (ISRO) providing satellite data set and also the authors are grateful to Institute of Remote Sensing, Anna University – Chennai for providing Lab facilities. I would like to thank Mr.B.Balaguru and Mr.P.Thanabalan Research scholar of Institute of Remote Sensing, Anna University, Chennai.
REFERENCES
Brisco, B., & Brown, R.J. Agricultural applications with Radar. In: Henderson, F.M. & Lewis, A.J. (Eds.)., Principles and Applications of Imaging Radar: Manual of Remote Sensing, third edition. JohnWiley& Sons, NewYork.
Chen, K.S., Huang, W. P., Tsay, D.H., & Amar, Nat, F., 1996. Classification of MultifrequencyPolarimtric SAR Imagery Using a Dynamic Learning Neural Network. IEEE Transactions on Geoscience and Remote Sensing, 34, pp. 814–820.
Chinatsu Yonezawa., NobuhiroTomiyama., & Takao Yamakoshi., 1998. Land Surface Observation Using Multi-polarization ENVISAT ASAR Data. IEEE, 4564-4567, pp.381406, chapter 7.
Fukuda, S., Kataqiri, R., & Hirosawa, H., 2002. Unsupervised approach for polarimetric SAR image classification using support vector machines. International Geoscience and Remote Sensing Symposium, 5, pp.2599-2601.
Ito, Y., & Omatu, S., 1998. Polarimetric SAR data classification using competitive neural networks. International Journal of Remote Sensing, 19, pp. 2665–2684.
Lee, J.S., Grunes, M. R., & Kwok, R., 1994. Classification of multi-look polarimetric SAR imagery based on complex Wishart distribution. Int. J. Remote Sensing, Vol. 15, No. 11, 2299–2311.
No-Wook Park., & Kwang-Hoon Chi., 2006. Land-cover Classification using Multi-temporal/polarization C-band SAR Data. IEEE, 188- 191.
Salim Chitroub., 2002. Statistical characterisation and modelling of SAR images. Signal Processing, 82, 69 – 92.
Ulaby, F.T., & Elachi. C., 1990. Radar Polarimetry for GeoscienceApplications. Artech House, Norwood, MA.
Wagner, F., Silva, Bernardo F.T. Rudorff., Antonio R. Formaggio., Waldir R. Paradella., & Jose C. Mura., 2009. Discrimination of agricultural crops in a tropical semi-arid region of Brazil based on L-band polarimetric airborne SAR data. ISPRS Journal of Photogrammetry and Remote Sensing, 64, 458-463.