Pull vs. Push: How OmniEarth Delivers Better Earth Observation Information to
Subscribers
C. Fish a, , S. Slagowski a, L.Dyrud a, J. Fentzke a, B. Hargis a, M. Steerman b1 a OmniEarth Inc., Arlington, VA, United States – [email protected]
b Johns Hopkins University Applied Physics Laboratory, Laurel, MD, United States – [email protected]
KEY WORDS: Constellation-Measurements, Geoinformatics, Analytics, Data Fusion, Agriculture, Energy
ABSTRACT:
Until very recently, the commercialization of Earth observation systems has largely occurred in two ways: either through the detuning of government satellites or the repurposing of NASA (or other science) data for commercial use. However, the convergence of cloud computing and low-cost satellites is enabling Earth observation companies to tailor observation data to specific markets. Now, underserved constituencies, such as agriculture and energy, can tap into Earth observation data that is provided at a cadence, resolution and cost that can have a real impact to their bottom line. To connect with these markets, OmniEarth fuses data from a variety of sources, synthesizes it into useful and valuable business information, and delivers it to customers via web or mobile interfaces. The “secret sauce” is no longer about having the highest resolution imagery, but rather it is about using that imagery – in conjunction with a number of other sources – to solve complex problems that require timely and contextual information about our dynamic and changing planet. OmniEarth improves subscribers’ ability to visualize the world around them by enhancing their ability to see, analyze, and react to change in real time through a solutions-as-a-service platform.
1 Corresponding Author.
1. INTRODUCTION: PUSH vs. PULL
The commercial Earth observation market is relatively young. In 1993, the U.S. Department of Commerce granted DigitalGlobe (then WorldView) the first license allowing a private enterprise to build and operate a commercial satellite system to collect high-resolution Earth observation imagery (DigitalGlobe, 2015). Since then, a number of competitors have entered the market – with companies competing to offer the highest-resolution imagery for the lowest price per pixel. Their operations model is largely based on the government tasking model wherein a customer identifies an area to be observed and pays for the satellite to be “tasked” to capture an image over a defined pass or series of passes.
Scientific Earth observation satellites have been around nearly twice as long. While Landsat is arguably the oldest, with Landsat 1 launched in 1972 (GSFC, 2015), a number of other scientific Earth observation platforms exist, such as MODIS Aqua and Terra. These systems were developed by and for the science community; industry has access to the valuable information provided by these systems but has had little or no input into their formulation.
The concept of putting out existing product, in this case Earth imagery, for consumption is known as “push marketing”. An enormous body of knowledge has thus been made available in the form of tasked imagery libraries and multispectral datasets of our evolving planet from both the commercial and scientific communities.
However a number of industries require more than the Earth observation data that is being pushed to them … they require information tailored to their needs, at a resolution, cadence, and cost appropriate for their business model. Further, since customers in these industries are neither scientists nor
programmers, they require such data in an easily-digestible form. As such, we believe the future of Earth observation lies with a fusion of multiple sources of information – from satellites, aerial imagery, and even a customer’s own proprietary data – into customized products.
1.1 Enter “Pull” Marketing
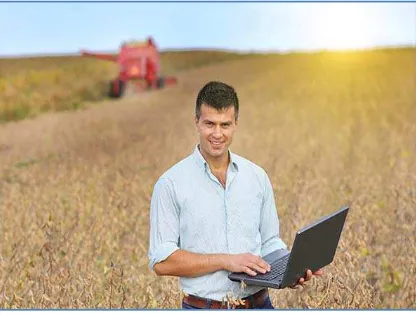
Advances in fields such as precision agriculture have provided a tantalizing glimpse of the possibilities provided by remote sensing. But they have also illustrated the need for better information products. For mass appeal, Earth observation data must be packaged in a useable format. The new consumers of Earth observation data require an intuitive user interface and integration into their standard business practices. To achieve this, they will seek out or “pull” partners to them who can help develop the information products best suited for their business.
Figure 1. New consumers of Earth observation data are not mathematicians or scientists. They require information tailored
2. THE NEED FOR CONSTELLATION MEASUREMENTS AND FUSED DATA
2.1 Earth as a Dynamic System
More than 1,000 satellites circle our planet. Some provide high-resolution, multi- or hyper-spectral imaging, giving us insight into plant biologies. Some are weather related, alerting us to potential storms. Still others provide information about space weather that affect our planet. Each provides valuable information about Earth.
Yet the Earth is a vibrant, interactive system full of complexity like insect and animal life, pollution, and varying human populations. None of the many satellites above our planet look at Earth – all of it – as a system. How does an insect infestation affect plant life? How does plant life affect man-made structures? How do fast-evolving phenomena, like storms or volcanoes, affect all of these?
Each satellite system is limited … by budgets, by mission constraints, by available technology. They were all launched with the best of intentions, but they were launched to perform very narrowly-defined missions. As such, no one system can provide the information needed by industrial leaders and policy makers to formulate decisions on a truly informed basis.
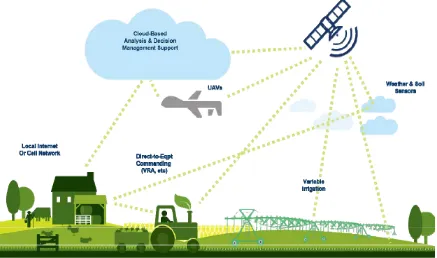
Additionally, some information cannot be gained from orbiting satellites or even aerial imagery. Localized sensors, such as hand-held or vehicle-mounted equipment, might be needed as well as links to other land parcel data, such as tax records, maps, or utility information. Figure 2 shows that, in the case of smart agriculture, information gained from many sensors must be employed and also sent back out to equipment such as irrigation systems and fertilizer distribution units, to be truly effective. At the heart of such a system is a web-based user
interface that incorporates all of the necessary components and is also easy to use.
2.2 Starting From an Earth Science Background
Because Earth is such a dynamic system, approaches to observation and remote sensing must be managed from an Earth science perspective. OmniEarth is one of a handful of emerging companies who approach remote sensing from an Earth science perspective. We help customers, primarily in the agriculture, energy, and municipal government sectors, take advantage of available Earth observation data and use it to assess, manage, and predict how their businesses interact with a changing world.
As Earth scientists, our team has worked on a number of global-scale sensing projects, including radiation monitoring, measuring electric currents in the atmosphere, and Earth radiation imbalance. We understand the value of look-down data that satellite-based constellations offer.
Yet we also recognize that the best resolution for a client’s needs is not necessarily the highest resolution. Figure 3 illustrates the balance between resolution that is high enough to provide necessary detail, but low enough to provide cost-effective storage and distribution of the massive amounts of data that will be collected by our planned constellation as it captures images everywhere on Earth, every day.
Until now, remote sensing systems have been based on government and scientific models, where the cost of the end product has been largely disregarded. OmniEarth’s business model starts with the end user product – including its easy-to-use interface – and works backward to the required data. We pull data and information from a number of sources, including working with the customer’s information systems.
Figure 2. Satellite-based Earth observation is just one component of smart agriculture. To be truly effective, remote sensor information must be linked to localized sensors, such as those which are hand-held or vehicle-mounted, aerial imagery,
Working backward from the end product, using available data sets in the existing marketplace, we discovered that we could not acquire multispectral data at the temporal and spatial cadence required to address many industry needs, such as smart agriculture and pipeline monitoring.
Many of our partners were using Landsat data that is delivered with a revisit of approximately two weeks. We’ve improved this with a synthesized Landsat product that incorporates more frequent, but lower resolution, data. However, our goal is to incorporate daily revisit data into our analytics products.
Another problem we found with existing tasked imagery was inconsistent viewing angles which complicated comparisons with previous views of the same area. Thus, while we can work with existing imagery, OmniEarth is developing a constellation of 15 satellites that will capture every location on Earth, every day. Unlike existing tasked systems, this will give us the ability to compare before and after images for unpredicted events. Further, this system will provide a nadir-looking view with a wide swath area. However, to store the massive amounts of data associated with the multispectral data needed by our customers, we employ only the resolution necessary by our applications, some of which are described below.
We start, not by asking what applications can use our images, but rather how can we help our customers grow and thrive and, only then, what resources do we need to address those requirements?
2.3 Fused Data, Tailored for Industry
OmniEarth focuses on industries underserved by the traditional remote sensing. We offer solutions that fuse common business and parcel information that they are already using with Earth observation data to help them better assess, manage and predict the world around them. Following are several product examples.
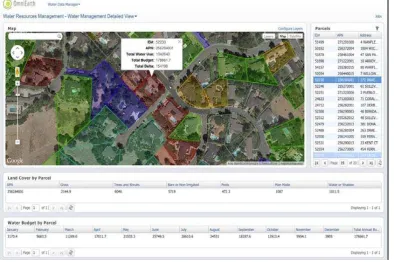
Water Resource Management. OmniEarth’s water resource management tool (Figure 4) combines water usage data (from metering data), satellite and aerial imagery, and parcel boundary records to put water usage – and waste – into context, helping resource managers and policy makers guide future use.
Information is overlaid on Google™ maps, the world’s most Figure 3.OmniEarth balances image resolution with the data demands of continuous imaging. Our planned constellation will
feature 2-5m GSD multispectral images (Panel C), providing maximum value for our customers. Images show Zonguldak,
Turkey from Topan, Büyüksalih and Jacobsen (2005).
Figure 4. Screenshot of OmniEarth’s Water Resource Management tool. This tool combines water usage data, satellite and aerial imagery, and parcel boundary information to put water usage – and waste – into context, helping resource managers and policy makers guide future use. Parcels are highlighted based on over- or under-use. In this example, red indicates users in the top 20% of
familiar and accurate base maps. User-configured views allow customers to display maps containing imagery and usage layers side-by-side with parcel characteristics and historical water usage. Our analytics monitor vegetation changes to help predict future usage and compare actual usage against ideal water budgets, aiding in conservation efforts.
High Consequence Area Mapping and Seep Detection. Pipelines running through high-consequence areas – particularly near day-care centers, hospitals or schools – must be monitored by federal law. OmniEarth lowers the cost and improves the timeliness and confidence of such reporting with automated notifications and convenient dashboards. Our analytics combine powerful satellite and aerial imagery with other relevant information, such as tax records and building permit applications, to track variables and identify actionable changes in and around pipelines.
However, high consequence areas are not the only locations energy companies wish to monitor. They must also monitor thousands of miles of pipeline. Using multispectral imagery with high revisit rates, OmniEarth provides pipeline operators and environmental agencies with timely knowledge of pipeline status and surrounding vegetation. By monitoring vegetation health in pipeline corridors, we help identify small leaks before they become huge disasters.
Crop Yield Forecasting. Smart agriculture isn’t just for farmers and large agriculture concerns. OmniEarth also delivers regular updates on the status of crops and fields to futures traders. Our analytics extract crop health information from imagery using a proprietary combination of known vegetative indices to derive information more accurate than any single index. These crop forecast models can be delivered weekly, bi-weekly, or monthly for areas as small as a single farm or for an entire region.
3. NEW MODEL REQUIRES STRONG PARTNERSHIPS
3.1 Future of Earth Observation Will Be Pull vs. Push
Northern Sky Research (2014) forecasts that information products, such as those described above, will be the fastest growing segment of the Earth observation market over the next ten years (the other two categories were imagery and data). Our experience supports this forecast. Our partners and customers are clamouring for analytics and information products that they can purchase without hiring in-house mathematicians and scientists.
The product examples above, as well as the lack of success experienced by most imagery providers dabbling in the analytics market, suggests that the future of Earth observation information products will be a pull rather than push marketplace
3.2 Strong Partnerships Needed Within Targeted Markets
But, as stated earlier, strong partnerships are needed to create better information products. Just as our customers are not scientists, we are not farmers or roughnecks on an oil rig.
To fully understand the needs of a marketplace, one must either be an insider or partnered with an insider. We worked for nearly a year with a large water municipality in California to
develop and refine our water management tool. To better understand the energy market, one of our founders worked as a consultant to a large energy company for more than a year and we are working closely with several energy companies as we refine our products. And, for agriculture, we are working with two of the largest agricultural concerns in the world; it is, in fact, their needs which are largely driving our constellation design.
To compete effectively in the Earth observation market, companies will need to narrow their product line and tailor their offerings to specific markets.
4. REMOVING the UNCERTAINTY from the ANALYTICS MARKET
4.1 Providing a Menu of Options (Netflix Model)
The consumer market offers a number of excellent models on which to base an Earth observation sales solution.
OmniEarth is building our sales solution based on the Netflix™ business model wherein a customer will arrive at our website and select a “genre” of analytics, such as agriculture or energy (comparable to comedy or drama on the Netflix site). Next, the customer will select the analytic solution desired, such as seep detection or asset monitoring, and then select options. Options include choices like how much area will be included or how long the subscription will last. The important thing is that customers will have predictability in pricing.
4.2 Predictability of Pricing
The current geoanalytics market relies heavily on “custom” solutions which, most of the time, come with custom pricing. Businesses, however, tend to be risk averse and the unknowns associated with custom solutions can deter participation in such markets. Thus, in addition to product tailoring and easy-to-use interfaces, OmniEarth is removing the voodoo from the analytics market.
Our analytics share many common components across applications. This allows us to provide standardized pricing on most products and confidence in achieving a solution for our customers on budget and on time – our development is accomplished before the sale. Shortly, our online store will offer published prices for industry-tailored analytics tools, as well as for imagery buys.
By anticipating the types of common proprietary data that will be integrated into our analytics, such as metering data or tax parcel information, we can build in an entry point for the data without creating a custom solution each time, keeping prices predictable and low.
5. CONCLUSIONS
The commercialization of Earth observation data has resulted in an unprecedented level of data about our planet being pushed out for consumption. But industry needs more than the Earth observation data being pushed to them. They require information tailored to their needs at a resolution, cadence, and cost appropriate for their business model.
products specifically for their businesses with easy-to-use interfaces that work with existing business architectures. The Information Products segment is anticipated to be the fastest-growing segment of the Earth observation market. To compete effectively, companies will need to narrow their product lines and tailor their offerings to specific markets and be “pulled” toward customers.
REFERENCES
DigitalGlobe, 2015. Company website https://www.digitalglobe.
com/about-us/company (9 Mar. 2015).
Goddard Space Flight Center (GSFC), 2015. Landsat Science
http://landsat.gsfc.nasa.gov/?p=3172 (9 Mar 2015).
Northern Sky Research, 2014. Energy Markets via Satellite 4th Edition.
Satnews Daily, 2013. Northern Sky Research (NSR) – Growth Ahead (EO). http://www.satnews.com/story.php?number=
729097980 (11 Mar 2015),