ALIGNMENT OF HYPERSPECTRAL IMAGERY AND FULL-WAVEFORM LIDAR
DATA FOR VISUALISATION AND CLASSIFICATION PURPOSES
M. Miltiadou a,b *, M. A. Warren a, M. Grant a, M. Brown b
a Plymouth Marine Laboratory (PML), Remote Sensing Group, Prospect Place, Plymouth, PL1 3DH UK - (mmi, mark1,
mggr)@pml.ac.uk b
Centre for Digital Entertainment (CDE), University of Bath, Claverton Down Road, Bath, BA2 7AY UK – (mm841, m.brown)@bath.ac.uk
Commission VI, WG VI/4
KEY WORDS: Integration, Hyperspectral Imagery, Full-waveform LiDAR, Voxelisation, Visualisation, Tree coverage maps
ABSTRACT:
The overarching aim of this paper is to enhance the visualisations and classifications of airborne remote sensing data for remote forest surveys. A new open source tool is presented for aligning hyperspectral and full-waveform LiDAR data. The tool produces coloured polygon representations of the scanned areas and aligned metrics from both datasets. Using data provided by NERC ARSF, tree coverage maps are generated and projected into the polygons. The 3D polygon meshes show well-separated structures and are suitable for direct rendering with commodity 3D-accelerated hardware allowing smooth visualisation. The intensity profile of each wave sample is accumulated into a 3D discrete density volume building a 3D representation of the scanned area. The 3D volume is then polygonised using the Marching Cubes algorithm. Further, three user-defined bands from the hyperspectral images are projected into the polygon mesh as RGB colours. Regarding the classifications of full-waveform LiDAR data, previous work used extraction of point clouds while this paper introduces a new approach of deriving information from the 3D volume representation and the hyperspectral data. We generate aligned metrics of multiple resolutions, including the standard deviation of the hyperspectral bands and width of the reflected waveform derived from the volume. Tree coverage maps are then generated using a Bayesian probabilistic model and due to the combination of the data, higher accuracy classification results are expected.
* Corresponding author. This is useful to know for communication with the appropriate person in cases with more than one author.
1. INTRODUCTION
The integration of hyperspectral and full-waveform (FW) LiDAR data aims to improve remote forest surveys. Traditional ways of forest health monitoring suggest collecting ground information with fieldwork, which is time consuming and lacking in spatial coverage. Multiple sensors have been developed to improve forest health monitoring, including Airborne Laser Scanning (ALS) systems. ALS data contains huge amount of information, and the lack of tools handling these data (particularly FW LiDAR) in an integrated way makes interpretation difficult. This research aims to enhance the visualisation of FW LiDAR data and hyperspectral imagery and investigate the benefits of combining them in remote forest survey applications and classifications.
The visualisation part of this paper is looking into enhancing the current visualisation and using the hyperspectral images to improve the visual output of the scanned area. Visualisations are important for understanding the remote sensing data and disseminating complicated information, especially to an audience with no scientific background.
Some of the current FW LiDAR visualisation tools and approaches are given below:
1. Voxelisation, proposed by Persson et al in 2005: This approach inserts the waveforms into a 3D volume and visualising it using different transparencies across the voxels.
1. FullAnalyze: for each waveform sample, a sphere with radius proportional to its amplitude is created (Chauve et al, 2009).
2. SPDlib: It visualises either the samples which are above a threshold level as points coloured according to their intensity value or a points cloud extracted from the waveforms using Gaussian decomposition.
3. Lag: a visualisation tool for analysis and inspection of LiDAR point clouds. But it only supports two perspectives top-down and side view, limiting the visual perception of the user.
Some of the visualisation tools for hyperspectral imagery are: ENVI, ArcGIS and other GIS, Matlab and GDAL.
Regarding the integration of FW LiDAR and hyperspectral in remote forest surveys, Clark et al attempted to estimate forest biomass but no better results were observed after the integration (Clark et al, 2011). While the outcomes of Aderson et al for observing tree species abundances structures were improved after the integration of data (Anderson, et al., 2008).
used in Heizel and Koch, 2012 to handle the high dimensionality of the metrics (464 metrics). In that research a combination of FW LiDAR, discrete LiDAR, hyperspectral and colour infrared (CIR) images are used. Each of the 125 hyperspectral bands is directly used as a feature in the classifier, contributing to the high dimensionality. Here, some of the FW LiDAR and LiDAR features are used but in a digested form (i.e. the width of the waveform), and matches to the spectral signatures of each class are used to reduce the dimensionality.
2. DASOS – THE INTEGRATION SYSTEM The system implemented for this research is named DASOS, which is derived from the Greek word δάσος (=forest) and it has been released as an open source software. It is available at: https://github.com/Art-n-MathS/DASOS .
The software takes as input full-waveform (FW) LiDAR data and hyperspectral images and returns
1. A coloured polygon representation
2. Aligned metrics from both datasets with user-defined resolution Environment Research Council’s Airborne Research & Survey Facility (NERC ARSF) and are publicly available. They were acquired on the 8th of April in 2010 at New Forest in UK. For every flightline, two airborne remote sensing datasets are captured: FW LiDAR data and hyperspectral images. But since the data are collected from different instruments they are not aligned.
The LiDAR data are captured using a small foot-print Leica ALS50-II system. The system emits a laser beam and collects information from its return. It records both discrete and full-waveform LiDAR data. For the discrete LiDAR data, points are recorded for peak reflectances. Every peak reflectance corresponds to a hit point and the position of the hit point is calculated by measuring the round trip time of beam. The system records up to four peak returns with a minimum of 2.7m distance from each other.
Once the 1st return is received the Leica system starts recording the waveform. Each waveform in the dataset contains 256 samples of the returned backscattered signal digitised at 2ns intervals. This corresponds to 76.8m of waveform length. Each wave sample has an intensity value, which is related to the amount of radiation returned during the corresponding time interval. The position of each sample’s hit point is calculated using the first discrete return and a given offset.
Here it worth mentioning two of the main drawbacks of the LiDAR data. When the Leica system operates at a pulse rate greater than 120KHz, it starts dropping every other waveform. This applies to the data used in this project, so there are waveforms for about half of the emitted pulses and discrete returns for all of them. Further, the intensities recorded are not
calibrated. As mentioned at Vain et al (2009) the emitted radiation of the pulse is usually unknown in Airborne laser scanning system and it depends on the speed or height of the flight.
The hyperspectral images are collected from two instruments:
1. The Eagle, which captures the visible and near infra-red spectrum, 400 - 970nm.
2. The Hawk, which covers short wave infrared wavelengths, 970 - 2450nm
Around 250 bands are captured by each instrument and, after post-processing, each pixel has a calibrated radiance spectrum and a geolocation.
4. VISUALISATION
To enhance the visualisation of FW LiDAR data, a volumetric approach of polygonising the data was proposed by Miltiadou et al, 2014. First, the waveforms are inserted into a 3D discrete LiDAR. Further hyperspectral imagery is introduced to improve the visual output and allow parallel interpretation of the data.
4.1 Efficient representation of FW LiDAR
Similar to Persson et al, the waveforms are converted into voxels by inserting the waves into a 3D discrete density volume. In this approach the noise is removed by a threshold first. When a pulse doesn’t hit any objects, the system captures low signals which are noise. For that reason, the samples with amplitude lower than the noise level are discarded. Further, to overcome the uneven number of samples per voxel, the average amplitude of the samples that lie inside each voxel is taken, instead of
Iv is the accumulated intensity of the voxel.
The main issue with this approach is that the intensities of the LiDAR data haven’t been calibrated. Non calibrated intensities do not significantly affect the creation of polygon meshes, because during polygonisation, the system treats the intensities as Booleans; is that voxel empty or not? Nevertheless, the noise threshold could be set lower if the intensities were calibrated and more details would be preserved into the polygon meshes.
4.2 Generating a polygon representation
represent the 3D volume using a discrete density function (f(X),α) that satisfies the following conditions:
f(X) = α , when X lies on the surface of the object f(X) > α , when X lies inside the object and
f(X) < α , when X lies outside the object (2)
where X = a 3D point (x, y, z) representing the longitude, latitude and height respectively
f(X) = the discrete density function that takes X as input and returns the accumulated intensity value of the voxel that X lies in
α = the isosurface of the object, which defines the boundary of the object. f(X) is equal to α iff X lies on the surface of the object.
Even though numerical implicitization is beneficial in reducing storage memory and for various resolution renderings of the same object, visualising numerical/algebraic objects is not straight forward, since they contain no discrete values. This problem can be addressed either by ray-tracing or polygonisation. In 1983, Hanraham suggested a ray-tracing approach, which used the equation derived from the ray and surface intersection to depict the algebraic object into an image. The Marching Cubes algorithm was later introduced for polygonising implicit objects. The Marching cubes algorithm constructs surfaces from implicit objects using a search table. Assume that f(X) defines an algebraic object. At first the space is divided into cubes, named voxels. Each voxel is defined by eight corner points, which lie either inside or outside the object. By enumerating all the possible cases and linearly interpolating the intersections along the edges, the surface of the implicit object is constructed (Lorensen and Cline, 1987).
According to Lorensen and Cline, the normal of each vertex is calculated by measuring the gradient change. But in our case, due to the high gradient changes inside the volume, calculating the normal in that way leads to a non-smooth visualisation. For that reason, in this research the normal of each vertex is equal to the average normal of its adjacent triangles.
4.3 Selecting the Sampling
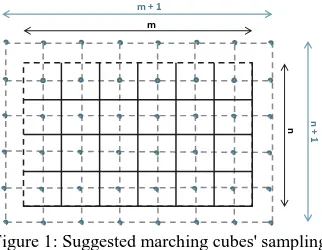
Figure 1: Suggested marching cubes' sampling
Further the sampling of the Marching cubes is independent from the sampling of the 3D density volume, but consistency between the two is required. Let’s assume the discrete volume has (n * m * k) voxels. The volume can be sampled into cubes at any rate but to reduce aliasing a ((n+1) *(m+1) * (k+1)) dimensional sampling is suggested. Please note that every point that lies outside the volume is considered to be below the boundary threshold and set to a value lower than the isosurface value. An example of the corresponding sampling in 2D is
shown on Figure 1, where the black grid represents a 2D density table and the blue grid represents the sampling used in during polygonisation.
The following table shows the effects of oversampling during polygonisation. The right image was oversampled and the second one was sampled as explained above.
Figure 2: Oversampling versus suggested sampling
4.4 Full-waveform versus discrete LiDAR data
Furthermore, DASOS allows the user to choose whether the waveform samples or the discrete returns are inserted into the 3D density volume. Each sample or each return has a hit point and an intensity value. So, in both case the space is divided into 3D voxels and the intensity of each return or sample is inserted into the voxel it lies inside.
In general the results of discrete returns contain less information compared to the results from the FW LiDAR, even though the FW LiDAR contain information from about half of the emitted pulses (Section 3). As shown on the 1st example of table 3 the polygon mesh generated from the FW LiDAR contains more details comparing to the one created from the discrete LiDAR. The forest on the top is more detailed, the warehouses in the middle have a clearer shape and the fence on the right lower corner is continuous while in the discrete data it is disconnected and merged with the aliasing.
FW LiDAR polygons, compared to the discrete LiDAR ones, contain more geometry below the outlined surface of the trees. On the one hand this is positive because they include much information about the tree branches but on the other hand the complexity of the objects generated is high. A potential use of the polygon representations is in movie productions: instead of creating a 3D virtual city or forest from scratch, the area of interest can be scanned and then polygonised using our system. But for efficiency purposes in both animation and rendering, polygonal objects should be closed and their faces should be connected. Hence, in movie productions, polygons generated from the FW LiDAR will require more post-processing in comparison with object generated from the discrete LiDAR.
shader of Meshlab. The brighter the surface appears the more geometry exists below the top surface. The brightness difference between area 1 and area 2 appears less in the discrete polygon. Nevertheless, the trees in area 2 are much taller than in area 1, therefore more geometry should have existed in area 2 and sequentially be brighter. But the two areas are only well-distinguished in the FW LiDAR. On average the FW polygon is brighter than the discrete polygon, which implies higher geometry complexity in the FW polygon.
The comparison example 3 is rendered using the Radiance Scaling shader of Meshlab (Vergne et al, 2010). The shader highlights the details of the mesh, making the comparison easier. Not only the FW polygons are more detailed but also holes appear on the discrete polygons. The resolution of the voxels of those examples is 1.7m3 and the higher the resolution is, the bigger the holes are, while the full-waveform can be polygonised at a resolution of 1m3 without any significant holes. Figure 4 shows an example of rendering the same flightline of examples 3 at the resolution of 1m3 using FW LiDAR data.
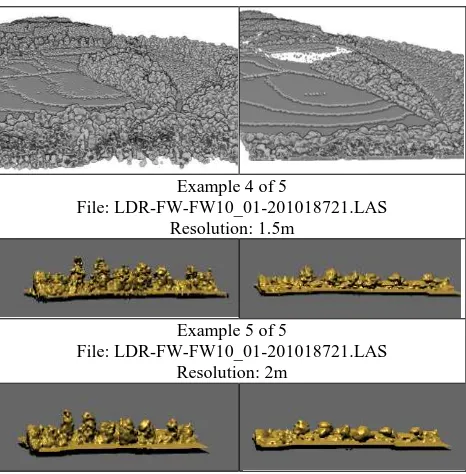
The last two examples (4 and 5) compare the side views of small regions. On the one hand the top of the trees are better-shaped in the discrete data. This may occur either because the discrete data contain information from double pulses than the FW data (Section 3) or because the noise threshold of the waveforms is not accurate and the top of the trees appear noisier on the FW LiDAR data. On the other hand more details appear close to the ground on the FW LiDAR data.
FW LiDAR
Discrete LiDAR
Example 1 of 6
File: LDR-FW-FW10_01-201018722.LAS Resolution: 4.4m
Example 2 of 5
File: LDR-FW-FW10_01-201018721.LAS Resolution: 1.7m
Example 3 of 5
File: LDR-FW-FW10_01-201018721.LAS Resolution: 1.7m
Example 4 of 5
File: LDR-FW-FW10_01-201018721.LAS Resolution: 1.5m
Example 5 of 5
File: LDR-FW-FW10_01-201018721.LAS Resolution: 2m
Table 3: Full-waveform versus discrete LiDAR data
4.5 Integrating hyperspectral Images
When the hyperspectral images are loaded along with the LiDAR files, then the outputs are:
1. the 3D geometry, which contains all the information about the vertices, edges, faces, normal and texture coordinates, and
2. a texture, which is an RGB image which is aligned with the texture coordinates of the polygon mesh.
For every scanned area, there are both FW LiDAR and hyperspectral data, but since the data are collected from different instruments they are not aligned. To integrate the data geospatially, aligning the data is required. In order to preserve the highest possible quality and avoid blurring that occurs during georectification, data in original sense of geometry (level 1) are used.
Here it worth mentioning that the texture coordinates (u, v) of each vertex lies in the range [0, 1] and if they are multiplied by the height/width of the texture, then the position of the corresponding pixel of the 2D texture is given. The 2D texture is simply an image generated from three user-selected bands for the RGB colours and its width is equal to the number of samples per line while its height is equal to the number of lines. Further the values of the three user-defined bands are normalised to lie in the range [0,255].
DASOS projects level 1 hyperspectral images by adjusting the texture coordinates of the polygon according to the geolocation of the samples. That is, for each vertex (xv, yv, zv) we find the pixel, whose geolocation (xg, yg) is closest to it. Then by using the position of the pixel on the image (xp, yp), the texture coordinates of the vertex are calculated accordingly.
For speed up purposes, we first import the pixels into a 2D grid, similar to Warren et al, 2014. The dimensions of the grid and the length of squares are constant, but in our case the average
1
2
1
number of pixels per square (Aps) can be modified and the dimensions (nx, ny) of the grid are calculated as follow:
(3)
where ns = the number of samples and
nl = the number of lines in the hyperspectral images.
Furthermore, while Warren et al use a tree-like structure, here a structure similar to hash tables is used to speed up searching. Hash table is a data structure, which maps keys to values. In our case, we utilise the unordered_multimap of c++11 (a version of the c++ programming language), where for every key there is a bucket with multiple values stored inside. Each square (xs, ys)
has a unique key, which is equal to (xs + ys *nXs) and each pixel
is associated with the square it lies inside. In other words, every key with its bucket corresponds to a single square of the grid and every bucket includes all the pixels that lie inside that square. The next step is for every vertex (xv, yv, zv) to find the
pixel whose geolocation is closest it. First we project each vertex into 2D by dropping the z coordinate and then we find the square (xs, ys) that its projection (xv, yv) lies in, as follow:
(4)
(5)
where maxX, minX, maxY, minY = the geolocation boundaries of all the hyperspectral image.
From the square (xs, ys) we can get the set of pixels that lie inside the same square with the vertex of our interest. Let’s assume that the positions and geolocations of these pixels are defined by p1, p2, p3, … , pn and g1, g2 g3, … , gn respectively. Then, by looping through only that set of pixels, we can find the pixel i that lies closest to the vertex v(xv , yv):
(6)
Finally, we need to scale the pixel position pi = (xp, yp), such that it lies in the range [0,1]. The scale factors are the number of samples (ns) and lines (nl) of the hyperspectral image. So, the texture coordinates (u, v) of each vertex v(xv , yv) are given by the following:
(7)
4.6 Results
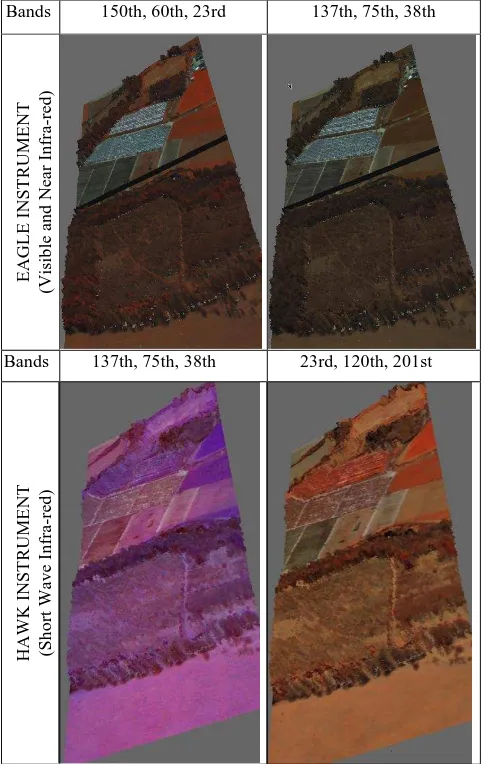
Some coloured polygon representations of flightlines from New Forest are shown in this section. Figure 4, shows the results before and after projecting the hyperspectral images and Table 5 shows the results of the same flightline while projecting hyperspectral images captured with different instruments or using different bands.
Figure 4. Visualisation results before and after projecting hyperspectral images on the polygon representation
Bands 150th, 60th, 23rd 137th, 75th, 38th
EAGLE
INST
RUME
NT
(Visib
le an
d
Ne
ar
In
fra
-re
d
)
Bands 137th, 75th, 38th 23rd, 120th, 201st
HA
WK
INST
RUME
NT
(S
h
o
rt
Wav
e
In
fra
-re
d
)
5. INTEGRATION FOR REMOTE FOREST SURVEY 5.1 Metrics and Sampling
In Anderson et al, 2008, an inverse distance weighted algorithm is used to raster the hyperspectral images and the pixel size is constant, 15.8m. While in this study an approach similar to Warren el is used and the resolution is changeable.
Further, the metrics generated from both hyperspectral and LiDAR are 2D aligned pictures. In other words, the pixel (x, y) has the same geographical coordinates in every metric. Further the resolution of the metrics depends on the resolution of the 3D volume. If the dimensions of the volume are (x, y, z) then the dimensions of the metrics are (x, y). For LiDAR each pixel is coloured according to the information derived from the corresponding column. For Hyperspectral metrics level 1 data are used to preserve the highest possible quality. The same method as section 4.5 is used for finding the pixels from the hyperspectral data that are closest to the centre of the every column of the 3D discrete density volume.
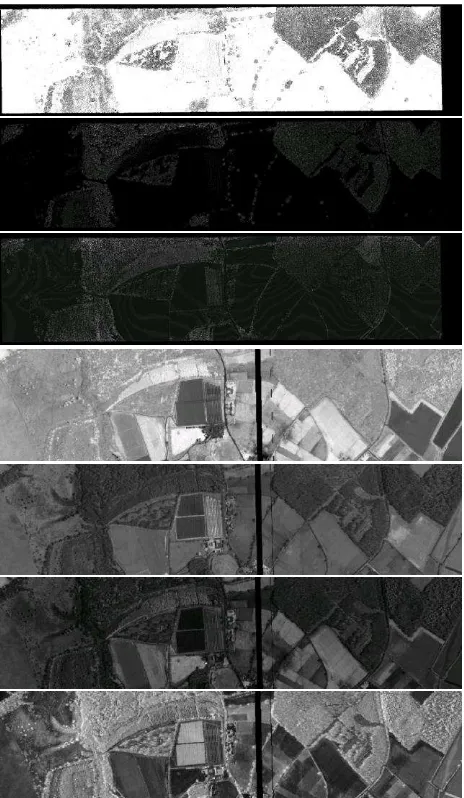
The metrics used in this project are shown in the following table, but the list of the metrics can easily be extended. The metrics L1 to L4 are generated from the FW LiDAR data while the metrics H1 to H4 are generated from the hyperspectral images.
Description
L1 The thickness map, defined as the distance between the first and last non empty voxels in every column of the 3D volume. This map corresponds to the width of the reflected waveform.
L2 Density map: Number of non-empty voxel over all voxels within the range from the first to last non-empty voxels.
L3 First/Top continued batch of non-empty voxels; the number of non-empty adjacent voxels, starting from the first/top non-empty voxel in that column. L4 Last/Lower continued batch of non-empty voxels; the number of non-empty adjacent voxels, starting from the last/lower non-empty voxel in that column.
H1 NDVI: Normalised Difference Vegetation index H2 Mean of all bands: the average of all the
hyperspectral bands
H3 The standard deviation of the complete spectrum at the pixel
H4 The squared spectral difference between each pixels’ spectrum and the generalised vegetation signature retrieved from USGS Digital Spectral Library (Clark et al, 2003).
Table 6. Available Metrics
The following figure shows an example of all the metrics derived from a flightline at resolution 1.8m (the metrics follow the same order as Table 6):
Figure 7. Metrics (Table 6) from the same flightline, with brighter intensity indicating a higher-valued metric
5.2 Tree Coverage Maps
To demonstrate the usefulness of DASOS, tree coverage maps are generated using a classifier and the results projected back into the polygon representations as shown in the following figure:
Figure 8. 3D tree coverage model
A Naïve Bayesian classifier using a multi-variance Gaussian model is applied for distinguishing tree covered areas from the ground. The main idea is for each pixel/column to find the class that is more likely to belong to (Tree or Ground).
(8)
where x = a column of the volume and the corresponding pixels of the metrics to be classified
A = one of the classes, i.e. ground
P(A|x) = the probability of x to belong to class A P(x|A) = the likelihood function that gives the probability of x given A
P(A) = the prior probability of a pixel to belong in A P(x) = the probability of that pixel x
The probability of x to belong to each one of the classes of our interest is calculated and then the pixel/column x is assigned to the class that is most probable to belong to. The probability P(x|A) is a likelihood function and a Gaussian probabilistic model is used for calculating it. By calculating the covariance (C) and mean (µ) of the class cluster, the Gaussian probabilistic model is given as follow (Murphy, 2012):
(9)
5.3 Results and Testing
As expected the total accuracy was increased with the integration of FW LiDAR data and hyperspectral images. For validating the results, ground truth data were hand painted using 3D models generated with DASOS. Further there are three test cases and for each test case the following metrics are used:
1. L1-L4: Metrics generated from the FW LiDAR 2. H1-H4: Metrics generated from the hyperspectral imagery
3. L1-L4 & H1-H4: A combination of metrics generated from either FW LiDAR or hyperspectral imagery
An error matrix represents the accuracy of the classifications (Congalton, 1991). Each row shows the number of pixels assigned to each class relative to their actual class. For example, the first row of Table 9 shows that 130445 pixels were classified as trees, where 125375 were actual trees and the rest 5070 were ground.
For each test case, an error matrix is generated to indicate the accuracy of the classification results as verified on the ground truth data (Table 9-11). From the error matrices the classification accuracy of each test case was calculated and is presented in the Table 12.
Table 9. Error Matrix of the 1st test case (FW LiDAR)
Table 10. Error Matrix of the 2nd test case (Hyperspectral Imagery)
Table 11. Error Matrix of the 3rd test case (FW LiDAR and Hyperspectral Imagery)
Table 12. Classification accuracy of each test case
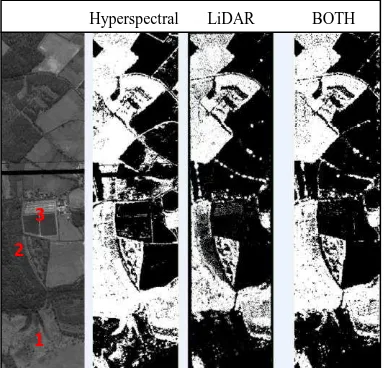
Figure 13 depicts the coverage maps generated for each test case. Three areas were also marked for comparison. Area 1 has been wrongly classified when only the hyperspectral data were used; nevertheless with the height information of the LiDAR data, area 1 was correctly classified. Similarly, area 2 was wrongly classified using the FW LiDAR because the height of the trees were less than the training samples but since the hyperspectral images do not contain height information, the trees were better labelled at the related test cases. By the end area 3 contains greenhouses, which seems to confuse the first two classifications in different ways, while the combination is much improved.
6. SUMMARY AND CONCLUSIONS
In this paper we showed an efficient way of aligning the FW LiDAR data and hyperspectral images. The voxel representation of the FW LiDAR data eases the handling of data as well as the alignment with the hyperspectral images. Furthermore, the spatial representation of hyperspectral pixels into a grid contributes to the efficiency of the alignement.
The visualisation of FW LiDAR data and hyperspectral images has been improved by introducing computer graphics approaches to remote sensing. While the state-of-the-art FW LiDAR visualisations talks about points clouds and transparent voxels, the output of DASOS is a coloured polygon representation which can be exported and interpretated in modeling softwares, like Meshlab.
It was also showed that the integration of the data has great potentials in remote forest surveys. This was demonstrated using a Bayesian probabilistic classifier for generating tree coverage maps. Positive results were shown by improved classification accuracy when both datasets were used.
By the end, the tools developed for this research are now openly available (Section 2).
ACKNOWLEDGEMENTS
The data are provided by the Natural Environment Research Council’s Airborne Research & Survey Facility (NERC ARSF).
REFERENCES
Anderson, J. E., Plourde, L. C., Martin, E. M., Braswell, H. B., Smith, M.-L., Dubayah, R. O., et al., 2008. Integrating waveform lidar with hyperspectral imagery for inventory of a northern temperate forest. ScienceDirect, Remote Sensing of Enviroment 112, 1856-1870.
Blinn, J. F., 1982. A Generalization of Algebraic Surface Drawing. ACM Trans.Graph, pp. 235-256.
Buddenbaum, H., Seeling, S., & Hill, J. (2013). Fusion of full-waveform lidar and imaging spectroscopy remote sensing data for the characterization of forest stands. International Journal of Remote Sensing, Vol. 32, No. 13, pp. 4511-4524.
Chauve, A., Bretar, F., Durrieu, S., Pierrot-Deseilligny, M., & Puech, W., 2009. FullAnalyze: A research tool for handling, processing and analysing full-waveform LiDAR data. IEEE International Geoscience & Remote Sensing Symposium.
Clark, M. L., Roberts, D. A., Ewel, J. J., & Clark, D. B., 2011. Estimation of tropical rain forest aboveground biomas with small-foorprint lidar and hyperspectral sensors. ScienceDirect, Remote Sensing of Enviroment 115, 2931-2942.
Clark R.N, Swayze G.A., Wise R., Livo K.E., Hoefen T.M., Kokaly R.F., Sutley S.J., 2003, USGS Digital Spectral Library splib05a, U.S. Geological Survey, Open File Report 03-395
Congalton, R. G., 1991. A Review of Assessing the Accuracy of Classifications of Remotely Sensed Data. Remote Sensing of Enviroment, Vol 37, No.1, pp. 35-46.
Hanrahan, P., 1983. Ray tracing algebraic surfaces. ACM SIGGRAPH Computer Graphics, Vol 17, No. 3.
Heinzel, J., & Koch, B., 2012. Investigating multiple data sources for tree species classification in temperate forest and use for single tree delineation. International Journal of Applied Earth Observation and Geoinformation, Vol. 18, pp. 101-110.
Lag, (Computer Software). Available at arsf.github.io/lag/ [ Accessed 5th March 2015]
Lorensen, W. E., & Cline, H. E. 1987. Marching cubes: A high resolution 3D surface construction algorithm. ACM Siggraph Computer Graphics, Vol 21, No 4 pp. 163-169.
Miltiadou, M., Grant, M., Brown, M., Warren, M., & Carolan, E., 2014. Reconstruction of a 3D Polygon Representation from full-wavefrom LiDAR data. RSPSoc Annual Conference 2014, "New Sensors for a Changing World". Aberystwyth
MeshLab (Computer Software), Available at Meshlab.sourceforge.net [Accessed 18th March 2015]
Murphy, K. P., 2012. Machine Learning: A Probabilistic Perspective. Cambridge, England: The MIT Press.
Persson, A., Soderman, U., Topel, J., & Ahlberg, S., 2005. Visualisation and Analysis of full-waveform airborne laser scanner data. V/3 Workshop "Laser scanning 2005". Enschede, the Netherlands.
SPDlib. (Computer Software). Available at: http://www.spdlib.org/doku.php [Accessed 1st September 2014].
Vain, A., Kaasalainen, S., Pyysalo, U., & Litkey, P., 2009. Use of naturally available reference targets to calibrate airborne laser scanning. Sensors 9, no. 4: 2780-2796.
Vergne, R., Pacanowski, R., Barla, P., Granier, X., & Schlick, C., 2010. Radiance scaling for versatile surface enhancement.
ACM SIGGRAPH symposium on Interactive 3D Graphics and Games, pp. 143-150