A comparison of Landsat 8 (OLI) and Landsat 7 (ETM+) in mapping geology and visualising
lineaments: A case study of central region Kenya
M. W. Mwaniki a, *, M. S. Moeller b, and G. Schellmann c a
Bamberg University, Storkower Strasse 219.04.21, 10367 Berlin, Germany – [email protected] b
Beuth Hochschule für Technik, Luxembuger Straße 10, 13353 Berlin, Germany – [email protected] c
Otto Friedrich Universität Bamberg, Am Kranen 1 (Kr/111), D-96045 Bamberg – [email protected]
THEME: Energy and Geological resources.
KEY WORDS: : Band rationing, False colour Combinations (FCC), Principal Component Analysis (PCA), Intensity Hue
Saturation (IHS), Independent Component Analysis (ICA), Knowledge base classification, Enhanced Thematic mapper Plus (ETM+), Operational Land Imager (OLI)
ABSTRACT:
Availability of multispectral remote sensing data cheaply and its higher spectral resolution compared to remote sensing data with higher spatial resolution has proved valuable for geological mapping exploitation and mineral mapping. This has benefited applications such as landslide quantification, fault pattern mapping, rock and lineament mapping especially with advanced remote sensing techniques and the use of short wave infrared bands. While Landsat and Aster data have been used to map geology in arid areas and band ratios suiting the application established, mapping in geology in highland regions has been challenging due to vegetation land cover. The aim of this study was to map geology and investigate bands suited for geological applications in a study area containing semi arid and highland characteristics. Therefore, Landsat 7 (ETM+, 2000) and Landsat 8 (OLI, 2014) were compared in determining suitable bands suited for geological mapping in the study area. The methodology consist performing principal component and factor loading analysis, IHS transformation and decorrelation stretch of the FCC with the highest contrast, band rationing and examining FCC with highest contrast, and then performing knowledge base classification. PCA factor loading analysis with emphasis on geological information showed band combination (5, 7, 3) for Landsat 7 and (6, 7, 4) for Landsat 8 had the highest contrast and more contrast was enhanced by performing decorrelation stretch. Band ratio combination (3/2, 5/1, 7/3) for Landsat 7 and (4/3, 6/2, 7/4) for Landsat 8 had more contrast on geologic information and formed the input data in knowledge base classification. Lineament visualisazion was achieved by performing IHS transformation of FCC with highest contrast and its saturation band combined as follows: Landsat 7 (IC1, PC2, saturation band), Landsat 8 (IC1, PC4, saturation band). The results were compared against existing geology maps and were superior and could be used to update the existing maps.
*
Corresponding author. This is useful to know for communication with the appropriate person in cases with more than one author.
1. INTRODUCTION
Geology is a key factor contributing to landslide prevalence and hence the need to map the structural pattern, faults and river channels in a highly rugged volcanic mountainous terrain. Availability of medium resolution multispectral data (e.g. Aster, Landsat) and the advancement in digital image processing (DIP) has facilitated geophysical and environmental studies thereby providing timely data for managing disasters and monitoring resources. Multispectral data has the advantage of gathering data in the visible, near infrared and mid infrared regions thus enabling investigation of the physical properties of the earths surface such as geology, soil and minerals. Further, the use of DIP image enhancements including transformed data feature space (PCA, ICA), band ratioing, colour composites (real or false), decorrelation stretch, edge enhancements, image fusion, data reduction (tasseled cap, PCA, ICA), spectral index have facilitated the differentiation and characterization of various elements of structural geology, mineralization and soil application studies (Chen and Campagna, 2009; Gupta, 2013; Prost, 2001).
Advances in image classification and the ability to integrate multiple data sources have further enhanced geological studies using remote sensing technologies. Such classification
algorithms that have successfully been used in geological mapping include: Artificial Neural Networks (ANN) (e.g. Rigol-Sanchez et al., 2003; Ultsch et al., 1995), evidential reasoning (e.g. Gong, 1996) , Fuzzy contextual (Binaghi et al., 1997) Knowledge base classification (e.g. Mwaniki et al., 2015).The ability to incoporate ancillary data in a classification system using expert rules has greately reduced spectral confusion among target classes in a complex biophysical environment. For example, Zhu et al., (2014) implemented expert knowledge base approach to extract landslide predisposing factors from domain experts while Gong, (1996) integrated multiple data sources in geological maping using evidential reasoning and artificial neural networks. Knowledge based systems are considered to be model based systems utilizing simple geometric properties of spatial features and geographic properties of spatial features and geographic context rules (Cortez et al., 1997). Thus, they require that each class is uniquely defined using geographic variables that represent spectral characteristics, topography, shape or environmental unit.
of Landsat data including agriculture, land-cover mapping, fresh Landsat 8 performed better than its Normalised vegetation Index (NDVI) and Modified Normalized Water Index (MNDWI). However it was shown that both sensors can be used to complement each other. The aim of this research was to compare the ability of Landsats ETM+ and OLI in mapping geology and visualizing lineaments using remote sensing techniques. The uniqueness of the study is that while previous researches such as (Ali et al., 2012; Gad and Kusky, 2006; Kenea, 1997; Novak and Soulakellis, 2000; Sultan et al., 1987) have used Landsat to map geology in Arid regions, the study area in this study had both semi arid and highland conditions. Also given that Landsat 8 has narrower spectral bands compared to Landsat 7, it was of interest to investigate their ability in distinguishing various lithology classes. Image enhancements techniques using false colour composites of PCs, band ratios were therefore explored for use in knowledge based classification with each sensor data (Landsat OLI and ETM+).
2. UTILITY OF DIP OF MULTISPECTRAL MEDIUM RESOLUTION DATA TO GEOLOGY APPLICATIONS
The use of enhanced images, hybrid classifiers, integration of GIS and remote sensing data, and use of narrower spectral band width data has aided geological mapping, an application where the mineralogy, weathering characteristics and geochemical signatures are useful in determining the nature of rock units (Kruse, 1998). The success of a classification relies on the seperability of training data into the various target classes. Thus multi and hyperspectral data allowing individual rock type to be studied spectrally and signature or spectral index be obtained have greatly boosted geological investigation. Such studies have explored the utility of band ratios using Landsat and ASTER data owing their availability. Hence, Landsat bands are known for particular applications: band 7 (geology band), band 5 (soil and rock discrimination) and band 3 (discrimination of soil from vegetation) (Boettinger et al., 2008; Campbell, 2002, 2009; Chen and Campagna, 2009). Band ratios are also known for eliminating shadowing and topographic effects and therefore suit complex terrain. The need to normalize band ratios to ease scaling, has paved way for spectral indices while still –metavolcanics (Rajendran et al., 2007), 5/4 –ferrous minerals (Carranza and Hale, 2002). Other band ratios possible with ASTER data and hyperspectral data are discussed by (van der Meer et al., 2012; Ninomiya et al., 2005).
RGB combinations are image enhancement techniques which provide powerful means to visually interpret a multispectral image (Novak and Soulakellis, 2000) and they can be real or false (i.e. FCC) utilizing individual bands or band ratios. In these respect, band ratios, band or PC combinations have been explored as a means to distinguish lithology. Examples using band ratios are: Kaufmann ratio (7/4, 4/3, 5/7), Chica–Olma ratio (5/7, 5/4, 3/1) using Landsat bands (Mia and Fujimitsu, 2012), Sabin’s ratio (5/7, 3/1,3/5) (Sabins, 1997), while Abdeen
et al., (2001) investigated ASTER band ratio combinations in mapping geology for arid regions and concluded that the ratios (4/7, 4/1, 2/3*4/3) and (4/7, 4/3, 2/1) were equivalent to Landsat Sultan (5/7,5/1, 5/4*3/4 ) and Abrams (5/7, 3/1, 4/5) combinations respectively. Similarly using band combinations, ASTER combination (731) was found to be the equivalent of Landsat (742), the ARAMCO combination by (Abdeen et al., 2001) and was used to outline lithological units as well as structural and morphological features. Laake, (2011) using Landsat multi-band RGB 742, distinguished clearly between the basement rocks, the Mesozoic clastic sedimentary rocks and coastal carbonates, while the difference between bands 4 and 2 highlighted difference in lithology between pure limestone and more sand cover. However, ASTER sensor having 6 bands in the SWIR and 5 bands in the thermal region, has many possible combinations and performs better in lithology discrimination compared to Landsat imagery (van der Meer et al., 2012).
The use transformed data space using methods such as PCA and ICA, help to decorelate band information while separating data along new component lines which can further be enhanced by visualizing the new components in FCC. Abdeen and Abdelghaffar, (2008) used PCs (123) in a FCC and was able to discriminate among sepentinites, basic metavolcnics, cal-alkaline granites and amphibolites rock units. Wahid and Ahmed,( 2006) using PCP (321) identified most promonent geomorphologic units and various landform features among them: fluvial terraces, fossili-ferous reefs, alluvial fans, desert wadis, salt pans and sabkhas, spits and sand bars, and submerged reefs. Perez et al., (2006) who tested various image processing algorithmns including tasseled cap and NDVI spectral indices, recommended the following enhancement techniques for geological applications: image sharpening, PCA, decorrelation stretch, Minimum Noise fraction, Band ratio, shaded relief and epipolar stereo. The use of PC can serve as optimized input data for guiding a classification in geology mapping. Ott et al., (2006) implemented such a classification using GIS analysis to implement favourability mapping for the exploration of copper minerals. Other analysis which have been utilized are neural networks (e.g. Harris et al., 2001) and use of DEM to aid lineament extraction (e.g. Chaabouni et al., 2012; Favretto et al., 2013).
Figure 3: FCC {IC1,PC5, Saturation Band (573)} Landsat 7 urbanization, extensive weathering and recent non-consolidated
deposits may hinder the detection of lineaments thus the need for ground truthing or earlier satellite images (Ramli et al., 2010).
3. METHODOLOGY
3.1 Study area
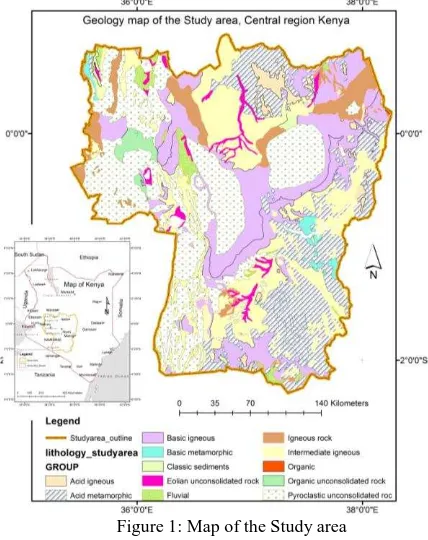
The study area covers the central region, part of the Rift-valley and Eastern provinces of Kenya and ranges from longitude 35°34´00"E to 38°15´00"E and latitudes 0°53´00"N to 2°10´00"S (Figure 1). Within the study area are three important water towers forming the Kenya highlands thus the terrain varies from highly rugged mountainous terrain, with deep incised river valleys and narrow ridges to gently sloping savannah plains and plateau. The altitude ranges from 450m to 5100m above mean sea level. Soil formation is mainly attributed to deep weathering of rocks where, (Ngecu et al., 2004) noted three main soil types: nitosols, andosols and cambisol. Landslides triggered by rapid soil saturation are common during the wet seasons (March-May, October to December) and thus factors affecting landslides have gained increasing attention by many researchers (Maina-Gichaba et al., 2013; Mwaniki et al., 2011; Ngecu and Mathu, 1999; Ogallo et al., 2006).
Figure 1: Map of the Study area
3.2 Data description and image enhancements
Landsat 8, (OLI , year 2014) and Landsat 7, (ETM+, year 2000) , scenes p168r060, p168r061 and p169r060 free of cloud cover for the year 2000 were downloaded from USGS web site page and pre-processed to reduce the effects of haze before mosaicing and subsetting. The following image enhancement techniques were applied to each of the Landsat imagery: PCA, ICA, Band rationing, RGB band combinations, decorrelation stretch, IHS transform of RGB combinations having the highest contrast. In general combinations involving bands from each spectral region (i.e. visible, mid infrared and SWIR II) were found to have most contrast on lithological features, thus Landsat 7, RGB 573 and Landsat 8, RGB 674 were enhanced
further using decorrelation stretch and IHS transformation. PCA was formed using all Landsat bands and Factor loading done to determine the PC containing most information from bands 7,5,3 for Landsat 7 and bands 674 for Landsat 8. PC combination (1,3,5, Figure 2) for Landsat 7 and combination (2,4,5) and (3,4,5) for Landsat 8 were found to enhance lithological features and were compared to band ratio combinations. A slight variation of the same was achieved using an FCC comprising: IC and PC with the most geological information as the Red and green channels while the blue channel was the saturation band the IHS transform of RGB combinations (573) for Landsat 7 (Figure 3) and (674) for landsat 8.
Figure 5: Geology classification map, Landsat 7
Figure 6: Geology classification map, Landsat 8 Band rationing and combinations with most contrast were also
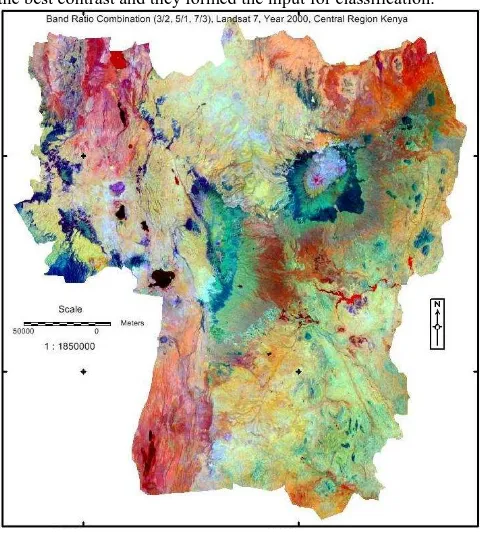
investigated using Drury, (1993) principle whereby, for bands ratios involving geology, a higher band is divided by a lower band. From Algebra combinations and permutations, Landsat 7 having 6 bands (1-5,7) and only 3 bands in an RGB combination, there were possible 20 combinations. However, it was observed that contrast increased with use of bands in different spectral regions and using the bands 5,7,3 as numerator for Landsat 7 and bands (6,7,4) as numerator for Landsat 8. Thus combinations (3/2, 5/1, 7/3, Figure 4) or (3/2, 5/1, 7/4) for Landsat 7 and (4/3, 6/2, 7/3) were found to have the best contrast and they formed the input for classification.
Figure 4: Band ratio combination (3/2, 5/1, 7/3), Landsat 7
3.3 Knowledge based classification using band ratios
The classification utilised band ratios (5/1, 5/4, 7/3 and 3/2) for Landsat 7 and band ratios (4/3, 6/2, 7/3) for Landsat 8. Colour contrast in the band ratio combination, formed the basis for the classes to be mapped. Enquiry of the RGB values was done at possible classes to establish class boundaries which were entered in to the knowledge base engineer and saved. The Landsats subset images were then input and the classification run specifying the knowledge base engineer files. The boundaries were adjusted each time after a trial classification until all the cells were classified. The results are presented in section 4.
3.4 Lineament extraction
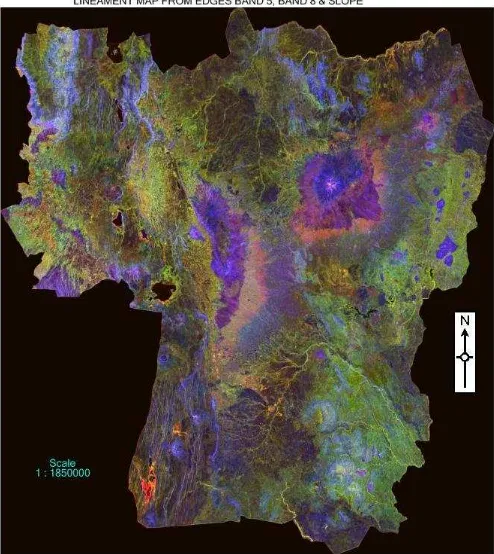
The basis for lineament extraction was enhanced texture property which was found in band ratio 5/1 and 6/2 for Lands 7 and 8 respectively. In addition, using band 8 which has 15m spatial resolution increased the chances of extracting a higher number of lineaments. Thus, a non directional, sobel edge detector was applied to both band 8 and band ratios ratio 5/1 and 6/2 with a multiplicative factor of 3 for slight enhancement. Thresholding was applied to the resulting files and band 8 and band ratio results for each year were combined into a single file. The result was overlaid to the classified geological map as presented in section 4. Another method which was found to
emphasize lineament features was extracting edges from bands 5 and 8 using sobel edge detector and combining them in RGB combination where slope was the third band.
4. RESULTS AND DISCUSSIONS
Figures 5 and 6 compare well visually to their input RGB combinations e.g. Figure 4. However it can be noted that slight improvement was realised by using band 5/4 in the classification so that water clay minerals were mapped out and consequently more water types discrimination was possible with Landsat 7. On the other hand, Landsat 8 classification only used only one band in the visible region and therefore it discriminated more lithology components compared to Landsat 7. This can be explained by the use of two band in the SWIR spectral region (Bands 6 and 7) in the ratio combination for Landsat 8 while, Landsat 7 has only band 7 as the geology band.
Landsat 8 classification therefore mapped out the following extra rock classes: Basic metamorphic, classic sediments, organic and organic unconsolidated. To achieve a complete structural geology map, the classifications were overlaid with the extracted lineaments as shown in figures 7 and 8 below.
Figure 7: Structural geology map, Landsat 7
It can be noted that while image enhancement method through principal component analyses enhanced feature discrimination as in figure 2, band ratio combination performed better both in the visualisation and discrimination ability. This is explained by the fact that PCA is also a data reduction/compression method while band ratio involves the use of the particular bands contributing to the spectral discrimination of a rock type. On the other hand, the use of RGB combination involving an IC, PC and saturation band of the RGB bands contibuting most to enhancing geology (i.e. Figure3), achived slightly better visulization of lineaments and landforms compared to RGb with PCs only (Figure 2). Therefore it has better texture while still discriminating the major rock units. This idea was bore from Mondini et al., (2011) who mapped landlides using a multichange detection technique involving an FCC comprissing: change is NDVI, IC4 and PC4 using Formasat image.
Figure 8: Structural geology map, Landsat 8
The RGB comprising edges from band ratio 5/1, band 8 and slope (Figure 9), achives visualization of the lineaments through a shaded relief. However, band 8 effect is captured as it overlaps with bands 4 and 2, which are mainly vegetation bands. Therefore the lineamnets on vegetated areas are not as clear.
5. CONCLUSIONS
The main aim of this research was to compare the performance of Landsat 7, ETM+ and Landsat 8, OLI in mapping geology which has been successful with Landsat 8 performing better at discriminating more lithological units compared to Landsat 7. The success can be attributed to Landsat 8, narrower band widths and the fact that 2 SWIR bands were used in the RGB band ratio combination as numerators. Image enhancement through band ratio combination has also been shown to be more effective in discriminating rock units and their visualization compared to PCA image enhancement. Knowledge based expert classification using band ratios was applied with success and the resulting classification improved band ratio combination which can only utilize 3 bands at a time.
The use of RGB combination involving an IC, PC and saturation band of the RGB bands contibuting most to enhancing geology, was explored as an image enhacement technique and it has better visualization of lineaments compared to PC RGB combinations. The extraction of lineaments depended on the ability to enhance texture which was better in band ratios 5/1 and 6/2 for Landsat 7 and 8 respectively.
ACKNOWLEDGEMENTS
We wish to thank all our reviewers who have ensured the quality of this paper is improved. We also thank DAAD/NaCOSTI cooperation for their continued support in this postgraduate research study.
REFERENCES
Abdeen, M.M., and Abdelghaffar, A.A. (2008). Mapping Neoproterozoic structures along the central Allaqiheiani suture, Southeastern Eqypt, using remote sensing and field data. (Colombo, Sri Lanka: Curran Associates, Inc),.
Abdeen, M.M., Thrurmond, K.A., Abdelsalam, G.M., and Stern, J.R. (2001). Application of ASTER Band-ratio Images for Geological Mapping in Arid Regions: The Neoproterozoic Allaqi Suture, Egypt (Boston, USA).
Abdullah, A., Nassr, S., and Ghaleeb, A. (2013). Remote Sensing and Geographic Information System for Fault Segments Mapping a Study from Taiz Area, Yemen. J. Geol. Res. 2013, 1–16.
Ali, E.A., El Khidir, S.O., Babikir, A.A., and Abdelrahnam, E.M. (2012). Landsat ETM+7 Digital Image Processing Techniques for Lithological and Structural Lineament Enhancement: Case Study Around Abidiya Area, Sudan. Open Remote Sens. J. 5, 83–89.
Argialas, D., Mavrantza, O., and Stefouli, M. (2003). Automatic mapping of tectonic lineaments (faults) using methods and techniques of Photointerpretation /Digital Remote Sensing and Expert Systems.
Binaghi, E., Madella, P., Grazia Montesano, M., and Rampini, A. (1997). Fuzzy contextual classification of multisource remote sensing images. IEEE Trans. Geosci. Remote Sens. 35, 326–340.
Boettinger, J.L., Ramsey, R.D., Bodily, J.M., Cole, N.J., Kienast-Brown, S., Nield, S.J., Saunders, A.M., and Stum, A.K. (2008). Landsat Spectral Data for Digital Soil Mapping. In
Digital Soil Mapping with Limited Data, A.E. Hartemink, A. McBratney, and M. de L. Mendonça-Santos, eds. (Dordrecht: Springer Netherlands), pp. 193–202.
Campbell, J.B. (2002). Band ratios. In Introduction to Remote Sensing, (New York: Guilford Press), p. 505.
Campbell, J.B. (2009). Remote sensing of Soils. In The Sage Handbook of Remote Sensing, (Thousand Oaks, CA: Sage), pp. 341–354.
Carranza, E.J.M., and Hale, M. (2002). Mineral imaging with Landsat Thematic Mapper data for hydrothermal alteration mapping in heavily vegetated terrane. Int. J. Remote Sens. 23, 4827–4852.
Chaabouni, R., Bouaziz, S., Peresson, H., and Wolfgang, J. (2012). Lineament analysis of South Jenein Area (Southern Tunisia) using remote sensing data and geographic information system. Egypt. J. Remote Sens. Space Sci. 15, 197–206.
Chen, X., and Campagna, D.J. (2009). Remote Sensing of Geology. In The Sage Handbook of Remote Sensing, (Thousand Oaks, CA: Sage), pp. 328–340.
Cortez, L., Durão, F., and Ramos, V. (1997). Testing some Connectionist Approaches for Thematic Mapping of Rural Areas. In Neurocomputation in Remote Sensing Data Analysis, I. Kanellopoulos, G.G. Wilkinson, F. Roli, and J. Austin, eds. (Berlin, Heidelberg: Springer Berlin Heidelberg), pp. 142–150. Drury, S.A. (1993). Image interpretation in geology (London ; New York: Chapman & Hall).
Favretto, A., Geletti, R., and Civile, D. (2013). Remote sensing as a preliminary analysis for the detection of active tectonic structures: an application to the Albanian orogenic system. Geoadria 18, 97–111.
Gad, S., and Kusky, T. (2006). Lithological mapping in the Eastern Desert of Egypt, the Barramiya area, using Landsat thematic mapper (TM). J. Afr. Earth Sci. 44, 196–202.
Gong, P. (1996). Integrated Analysis of Spatial Data from Multiple sources: Using Evidential reasoning and Artificial Neural network Techniques for Geological mapping. Photogramm. Eng. Remote Sens. 62, 513–523.
Gupta, R.P. (2013). Remote Sensing Geology (Berlin,
Hung, L.Q., Batelaan, O., and De Smedt, F. (2005). Lineament extraction and analysis, comparison of LANDSAT ETM and ASTER imagery. Case study: Suoimuoi tropical karst catchment, Vietnam. In Proceedings of SPIE Remote Sensing for Environmental Monitoring, GIS Applications and Geology, M. Ehlers, and U. Michel, eds. (International Society for Optics and Photonics), p. 59830T – 59830T – 12.
Kavak, K.S. (2005). Determination of palaeotectonic and neotectonic features around the Menderes Massif and the Gediz Graben (West. Turkey) using Landsat TM image. Int. J. Remote Sens. 26, 59–78.
Kruse, A.F. (1998). Advances in Hyperspectral Remote Sensing for Geologic Mapping and Exploration. In 9th Australasian Remote Sensing Conference, (Sydney, Australia),.
Laake, A. (2011). Integration of satellite Imagery, Geology and geophysical Data. In Earth and Environmental Sciences, (INTECH Open Access Publisher), pp. 467–492.
Li, P., Jiang, L., and Feng, Z. (2013). Cross-Comparison of Vegetation Indices Derived from Landsat-7 Enhanced Thematic Mapper Plus (ETM+) and Landsat-8 Operational Land Imager (OLI) Sensors. Remote Sens. 6, 310–329.
Maina-Gichaba, C., Kipseba, E.K., and Masibo, M. (2013). Overview of Landslide Occurrences in Kenya. In Developments in Earth Surface Processes, (Elsevier), pp. 293–314.
Marghany, M., and Hashim, M. (2010). Lineament mapping review. Int. J. Appl. Earth Obs. Geoinformation 14, 112–128.
Mia, B., and Fujimitsu, Y. (2012). Mapping hydrothermal altered mineral deposits using Landsat 7 ETM+ image in and around Kuju volcano, Kyushu, Japan. J. Earth Syst. Sci. 121, 1049–1057.
Mondini, A.C., Chang, K.-T., and Yin, H.-Y. (2011). Combining multiple change detection indices for mapping landslides triggered by typhoons. Geomorphology 134, 440– 451.
Mwaniki, M.W., Ngigi, T.G., and Waithaka, E.H. (2011). Rainfall Induced Landslide Probability Mapping for Central Province. In Fourth International Summer School and Conference, (JKUAT, Kenya: Publications of AGSE Karlsruhe, Germany), pp. 203–213.
Mwaniki, M.W., Moeller, M.S., and Schellmann, G. (2015). Application of remote sensing technologies to map the structural geology of central Region of Kenya. IEEE J. Sel. Top. Appl. Earth Obs. Remote Sens. soon.
Ngecu, W.M., and Mathu, E.M. (1999). The El-Nino- triggered landslides and their socio-economic impact on Kenya. Eng. Geol. 38, 277–285.
Ngecu, W.M., Nyamai, C.M., and Erima, G. (2004). The extent and significance of mass-movements in Eastern Africa: case studies of some major landslides in Uganda and Kenya. Environ. Geol. 46, 1123–1133.
Ninomiya, Y., Fu, B., and Cudahy, T.J. (2005). Detecting lithology with Advanced Spaceborne Thermal Emission and Reflection Radiometer (ASTER) multispectral thermal infrared “radiance-at-sensor” data. Remote Sens. Environ. 99, 127–139. Novak, I.D., and Soulakellis, N. (2000). Identifying geomorphic features using Landsat-5/TM data processing techniques on Lesvos, Greece. Geomorphology 34, 101–109.
Ogallo, S.N., Gaya, C.O., and Omuterema, S.O. (2006). Landslide Hazard Zonation Mapping for Murang’a District, Kenya. In Proceedings of the 1st International Conference on Disaster Management & Human Security in Africa, (Masinde Muliro University of Science & Technology, Kakamega, Kenya: Center for Disaster Management & Humanitarian Assisstance), pp. 303–308.
Ott, N., Kollersberger, T., and Tassara, A. (2006). GIS analyses and favorability mapping of optimized satellite data in northern Chile to improve exploration for copper mineral deposits. Geosphere 2, 236.
Perez, F.G., Higgins, C.T., and Real, C.R. (2006). Evaluation of use of remote sensing imagery in refinement of geological mapping for seismic hazard zoning in northern loss angeles county, California. In Proceedings of ISPRS XXXVI Congress,.
Prost, L.G. (2001). Remote sensing for geologists: a guide to image interpretation ([Amsterdam]; New York; Abingdon: Gordon & Breach ; Marston).
Rahnama, M., and Gloaguen, R. (2014). TecLines: A MATLAB-Based Toolbox for Tectonic Lineament Analysis from Satellite Images and DEMs, Part 1: Line Segment Detection and Extraction. Remote Sens. 6, 5938–5958.
Rajendran, S., Thirunavukkaraasu, A., Poovalingaganesh, B., Kumar, K.V., and Bhaskaran, G. (2007). Discrimination of low-grade magnetite ores using remote sensing techniques. J. Indian Soc. Remote Sens. 35, 153–162.
Ramli, M.F., Yusof, N., Yusoff, M.K., Juahir, H., and Shafri, H.Z.M. (2010). Lineament mapping and its application in landslide hazard assessment: a review. Bull. Eng. Geol. Environ. 69, 215–233.
Rigol-Sanchez, J.P., Chica-Olmo, M., and Abarca-Hernandez, F. (2003). Artificial neural networks as a tool for mineral vision for terrestrial global change research. Remote Sens. Environ. 145, 154–172.
Sabins, F.F. (1997). Remote sensing: principles and interpretation (New York: W.H. Freeman and Company).
Sabins, F.F. (1999). Remote sensing for mineral exploration. Ore Geol. Rev. 14, 157–183.
Sultan, M., Arvidson, R.E., Sturchio, N.C., and Guinness, E.A. (1987). Lithologic mapping in arid regions with Landsat networks and their rules for classification in marine geology. In Raum Und Zeit in Umweltinformationsystemen, (Marburg: Metropolis), pp. 676–693.
Wahid, M., and Ahmed, R.E. (2006). Identifying Geomporphic Features between Ras Gemsha and Safaga, Red Sea Coast, Egypt, Using Remote Sensing Techniques. Mar. Geol. 17, 23.