The Topographic Data Deluge
–
Collecting and Maintaining Data in a 21
stCentury Mapping
Agency
D. A. Hollanda*, C. Pooka, D. Capsticka, A. Hemmingsa
a Ordnance Survey, Adanac Drive, Southampton SO16 0AS, UK (david.holland, claire.pook, dave.capstick,
angus.hemmings)@os.uk
UN-GGIM Forum
KEY WORDS: Mobile mapping, UAVs, Oblique Imagery, Terrestrial Laser Scanning
ABSTRACT:
In the last few years, the number of sensors and data collection systems available to a mapping agency has grown considerably. In the field, in addition to total stations measuring position, angles and distances, the surveyor can choose from hand-held GPS devices, multi-lens imaging systems or laser scanners, which may be integrated with a laptop or tablet to capture topographic data directly in the field. These systems are joined by mobile mapping solutions, mounted on large or small vehicles, or sometimes even on a backpack carried by a surveyor walking around a site. Such systems allow the raw data to be collected rapidly in the field, while the interpretation of the data can be performed back in the office at a later date. In the air, large format digital cameras and airborne lidar sensors are being augmented with oblique camera systems, taking multiple views at each camera position and being used to create more realistic 3D city models. Lower down in the atmosphere, Unmanned Aerial Vehicles (or Remotely Piloted Aircraft Systems) have suddenly become ubiquitous. Hundreds of small companies have sprung up, providing images from UAVs using ever more capable consumer cameras. It is now easy to buy a 42 megapixel camera off the shelf at the local camera shop, and Canon recently announced that they are developing a 250 megapixel sensor for the consumer market. While these sensors may not yet rival the metric cameras used by today’s photogrammetrists, the rapid developments in sensor technology could eventually lead to the commoditization of high-resolution camera systems. With data streaming in from so many sources, the main issue for a mapping agency is how to interpret, store and update the data in such a way as to enable the creation and maintenance of the end product. This might be a topographic map, ortho-image or a digital surface model today, but soon it is just as likely to be a 3D point cloud, textured 3D mesh, 3D city model, or Building Information Model (BIM) with all the data interpretation and modelling that entails. In this paper, we describe research/investigations into the developing technologies and outline the findings for a National Mapping Agency (NMA). We also look at the challenges that these new data collection systems will bring to an NMA, and suggest ways that we may work to meet these challenges and deliver the products desired by our users.
1. INTRODUCTION
1.1 Today’s Mapping Agency
Until recently, the methods available to a National Mapping Agency for the collection of topographic data were restricted to a few options. Generally, surveyors on the ground use total stations, combining distance and angle measurement. These are often augmented using Real Time Kinematic Global Navigation Satellite Systems (RTK GNSS), using services such as the OS NET® or SmartNet GNSS base station networks in the UK.
Image interpreters in the office use stereo viewing software to capture data from aerial imagery, flown to produce multi-overlapping nadir images.
One common element in the capture of topographic data is the manually-intensive nature of the tasks. Whether in the field or in the office, a large proportion of the data collection process requires people actively viewing, interpreting and capturing topographic features in a largely non-automated way.
1.2 New technologies for the surveyor
Today, there are many more options available to the topographic data collector, from many different sources. These include new ground survey equipment that can capture large amounts of data in a short time; new airborne platforms and sensors that can deliver imagery more cheaply and quickly than traditional systems, and new ways of interpreting and extracting information from raw data. In this paper we will explore some of these
options and consider how they can be used within a mapping agency of the near future.
2. GROUND-BASED SURVEY
2.1 GNSS
Global Navigation Systems, usually in the form of GPS, are now part of everyday life. Every smart phone and even many new cameras have built-in GPS to allow the user to capture positional information wherever they go and whenever they take a photograph. The accuracy of the GNSS position recorded by these devices, generally at a level of around 5-10 metres, is good enough for the general consumer, but not for a surveyor. To obtain a positional accuracy suitable for large scale mapping applications, a survey-grade GPS device is required, which inevitably means a cost of several thousand pounds.
In between these two extremes, there are now several solutions which provide sub-metre-level accuracy and which could be accurate enough for many mapping applications. These systems often rely on an external service to provide corrections to the GNSS position recorded directly on the device. The Real Time Kinematic (RTK) solution requires a network of base-stations, spaced at intervals of several tens of kilometres while the Precise Point Positioning solution requires a much sparser network of globally distributed base stations. Other GNSS augmentation services use networks of monitoring stations to improve The International Archives of the Photogrammetry, Remote Sensing and Spatial Information Sciences, Volume XLI-B4, 2016
accuracy, the corrections are then normally sent to the user via geostationary satellites. These include the European Commission’s European Geostationary Navigation Overlay Service (EGNOS) and Trimble’s OmniSTAR services.
Table 1 shows the results of a recent test of several GPS receivers, compared with the high-accuracy survey-grade GPS receivers used by OS Surveyors. Leica’s Zeno device was used with the OS Net RTK service, while Trimble’s R1 and R2 receivers were used together with the Trimble RTX service (the medium-accuracy ViewPoint and high-medium-accuracy CentrePoint options).
GNSS Kit Configuration RMSE (m)
Leica Zeno hand-held RTK 0.23
Leica Zeno pole-mounted RTK 0.02
Trimble R1 pole-mounted ViewPoint RTX
0.35
Trimble R2 pole-mounted CentrePoint RTX
0.08
Table 1. GPS positional accuracy
As can be seen in table 1, sub-metre accuracy was achieved with all the systems, while the high-accuracy systems were at the sub 10-cm level. With the growth of GNSS satellite constellations and the development of new methods of processing GNSS data, high-precision hand-held GNSS is likely to become more readily available. OS continues to monitor these changes, to determine if and when such systems will become suitable for operational use in topographic survey and asset collection.
2.2 Mobile mapping and terrestrial scanners
2.2.1 Mobile mapping systems: Mobile mapping systems are now quite familiar to anyone who has seen the Google Street View vans in action. Ordnance Survey has reviewed mobile mapping systems several times in the past and each time has concluded that the systems were not yet cost-effective enough to be deployed. One reason for reaching this conclusion was that the technology was being used to answer a single use case (such as capture of road restriction information) and the use case in question could never justify the capital and running costs of a mobile mapping solution. In 2014 Ordnance Survey tested a mobile mapping system on a variety of use cases, to determine whether the needs of multiple users could be met, cost-effectively, using a single system.
For the trial, a survey of Eastleigh (a town just to the north of Southampton in southern England) was commissioned from Korec, using a Trimble MX8 van. This system uses two laser scanners and six cameras to capture 3D point clouds and images. The use cases addressed the capture of street signs, street furniture, bridge heights, road widths & other road restriction information; the identification of changes to business names and addresses; the verification of existing topographic and height data; the creation of 3D building models and the development of a viewer to allow browsing of the 3D data. Each of the use cases was tested using Trimble Trident software.
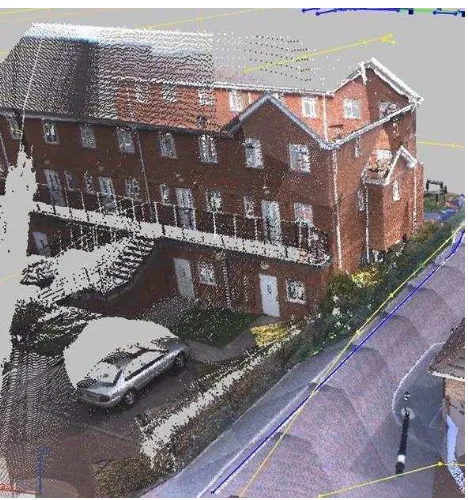
Figure 1. A coloured point cloud of a building in Eastleigh, captured using the MX8 mobile mapping system
Some of the use cases showed that mobile mapping is a viable method of data capture – road signs, parking restrictions, road widths and bridge heights can all be easily identified or measured, manually, using Trident. Other use cases proved more problematic – e.g. the capture of 3D buildings, using Trident or 3D modelling software, is only possible for those building facades directly visible from the road (Figure 1). A beautiful 3D model of a house front, automatically coloured using the MX8 imagery, is somewhat spoiled by the lack of any data for the side and back walls, and for parts of the roof not in direct line of sight of the mobile mapping sensors. This could be overcome by combining data from multiple sources, with the front of the building captured via mobile mapping and the back and sides captured from aerial (nadir or oblique) imagery or airborne lidar.
Our experience of the MX8 and also the Leica Pegasus mobile mapping system has shown that such systems can be used to capture data for a variety of use cases. One advantage of these techniques over traditional survey practices is that the data, once collected, can be stored and reviewed many times. This means that, if a future use case is identified, it can be tested on the data without having to carry out another field visit. The disappointing aspect of the systems we tested is the lack of automation in the software. Although the systems have algorithms for detecting features such as lamp-posts and road signs, in practice we found that these automated algorithms were no faster at capturing the features than a manual process, due to the large number of false positives and errors of omission.
As with all ground-based data capture techniques, the mobile mapping systems are relatively slow when compared with airborne image capture. Driving every road in an urban area such as Eastleigh proved to be quite time consuming. Ensuring that every road is captured will inevitably require a degree of back-tracking and duplication, especially in areas with many one-way systems and other traffic restrictions. To drive the entire road network of the urban areas of Great Britain with a single van would take many decades at considerable cost. Consequently, although the results of the trials were largely positive, the high The International Archives of the Photogrammetry, Remote Sensing and Spatial Information Sciences, Volume XLI-B4, 2016
costs of setting up and running a mobile mapping system have prevented us from bringing such systems into production at the present time.
2.2.2 Terrestrial Scanning: In addition to the total stations and GPS solutions traditionally provided by survey equipment companies, there are now many laser scanning and imaging devices which may be used by topographic surveyors. Some of these are high-end and expensive, while others are simpler, less accurate, but more portable and much cheaper. All of the systems we have tested are capable of producing 3D views of a scene, either as a point cloud or a 3D interactive image. Survey equipment such as the Leica Scanstation P40 and the Trimble TX8 laser scanners can capture one million points per second, at a positional accuracy of 2 or 3 mm. When capturing data over a large area, such as a new commercial building, these scanners can rapidly produce extremely large datasets. For topographic mapping purposes such equipment may be a little excessive, although mapping agencies could use them for detailed capture of iconic buildings and on projects which require more detail and higher accuracy than traditional mapping data. Multistations, such as the Leica Nova MS60, combine a total station with a laser scanning system to produce 3D point clouds augmented by surveyed points from a single device. Figure 2 shows a 3D coloured point cloud of the OS Headquarters building, captured using the MS60.
Developments in miniaturization have recently led to the production of systems that take the best of the mobile mapping and terrestrial scanning worlds and combine them into a single-person mobile solution. Leica’s Pegasus:Backpack and Vexcel’s Ultracam Panther use both cameras and laser scanners, mounted within a backpack to allow the surveyor to walk around a site, capturing 3D data automatically in the process. Although we have only seen demonstrations of these systems, they appear to provide a happy medium between the static terrestrial sensors and vehicle-mounted systems, with the added bonus that they can be used to collect data indoors and in areas where a vehicle would have no access. Figure 3 shows a 3D point cloud of the OS headquarters building in Southampton, Explorer House, captured using the Leica Pegasus backpack (on a dull and very wet day). The data were captured at a brisk walking pace, allowing a large volume of 3D data to be collected in a short period of time (when compared with a static terrestrial scanner).
A simpler solution to the capture of 3D point clouds in an indoor environment is provided by Geoslam’s Zeb Revo system. This uses a hand-held laser scanner to capture (X, Y, Z) data as the user walks around the target area. A cloud-processing system is then used to take the raw scans and produce a 3D point cloud. The initial results of such a system are impressive – a quick walk around a room can produce an accurate 3D point cloud within a few minutes of capture.
Figure 2. OS Explorer House mesh and point cloud from a Leica MS60 Multistation
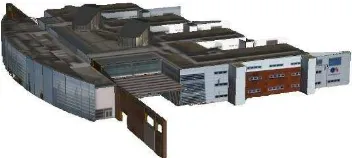
As with any 3D point cloud capture system the question arises as to what to do with the points once they are collected and what form of products to generate from them. Software does of course exist to view point clouds, but users are generally not familiar with such software, nor the concept of a point cloud as a spatial entity. Users who are used to dealing with points, lines and polygons in 2D will have to learn different methods of accessing and extracting meaningful information from point clouds. Point clouds can of course be used to extract 2D data, e.g. computer aided design (CAD) drawings showing the position of walls, doors etc. may be derived from indoor laser scanned data. Alternatively, the point clouds could be transformed into another form, such as a 3D mesh or a 3D city model. The 3D mesh can look very good, but it is not easy to partition into real world features. Attaching an attribute (e.g. an address or a topographical feature type such as “building” or “road”) to a mesh is not straightforward, as the mesh may not be cleanly partitioned between the features it represents. The 3D city model, such as a CityGML dataset, is easier to attribute, as the model explicitly represents physical features such as buildings. An example of a 3D city model of the Explorer House building is shown in Figure 4. Each of the different ways of representing 3D data has its advantages and disadvantages and different mapping agencies may well take different approaches to the most appropriate model for their own circumstances.
Figure 3. OS Explorer House point cloud captured using a Leica Pegasus backpack
During the next few months, OS researchers will examine the datasets from the different terrestrial scanning technologies discussed in this section, to determine which ones give us the data we require to update our existing products and to generate new ones.
Figure 4. OS Explorer House 3D city model The International Archives of the Photogrammetry, Remote Sensing and Spatial Information Sciences, Volume XLI-B4, 2016
3. AIRBORNE SURVEY
3.1 Oblique imagery
Data collection from airborne sensors plays a major role in many mapping agencies. At Ordnance Survey, digital photogrammetry has been the main source of topographic data collection since the mid 1990s (Allan & Holland, 2000, Holland and Allan, 2008). The current process uses two aircraft, each with a Vexcel UltraCam Xp camera, flying to achieve a ground sample distance of around 15 cm and an overlap of 80% (fore/aft) and 30% (side). Imagery from these cameras is used within several data capture flowlines to update topographic vector data, ortho-imagery and digital terrain models. The imagery is also used as input to other processes, for semi-automated change detection and land cover classification.
Oblique imagery has been used for aerial photography since the very early days – in fact the very first aerial photographs, taken from balloons, were of oblique views (PAPA International, 2016). Digital oblique camera systems, typically composed of three to five separate sensors, have been available for several years. Recently, several large camera manufacturers have developed oblique cameras, as the demand has grown for high resolution urban imagery and associated 3D models. For a discussion on oblique imagery in European mapping agencies, see Remondino et al. (2016).
3.2 Unmanned Aerial Vehicles
Anyone attending a conference on photogrammetry and remote sensing over the last few years will have noticed a significant interest in Unmanned Aerial Vehicles (UAVs) for mapping and monitoring. UAVs potentially offer a fast and low-cost method of producing high resolution aerial imagery. Such imagery may be used to supplement traditional survey methods in areas where it is difficult to access on the ground or in situations where it is not cost-effective to fly over using a conventional survey aircraft. There is some debate over whether a UAV and a simple camera can produce data suitable for a mapping agency. Haala et al. (2013) have shown that dense image matching of UAV imagery can produce 3D point clouds with an absolute elevation accuracy (RMSE) of around half the GSD of the images. Perez et al. (2013) also showed how a small UAV with a non-metric camera can be used to produce orthophotos and digital surface models. The accuracy of these products showed that the low-cost UAV solution could fill in the gap between conventional aerial photogrammetry and terrestrial surveying techniques.
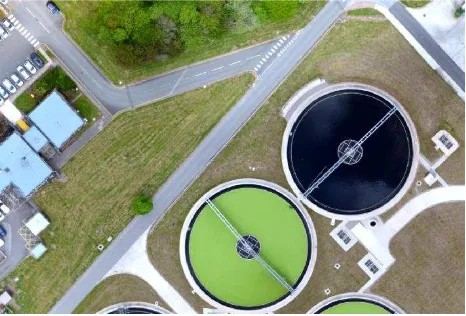
Ordnance Survey has tested UAVs in the past, namely a Sensefly Swinglet UAV, carrying a Canon IXUS camera (12 MPixels). Although capable of producing orthomosaics, such a system was not found to be a practical solution to a mapping agency because it has limitations on its operational use due to the weather (wind and rain). More robust UAVs are now available, which we will soon be testing in operational situations. In 2015 a preliminary test was carried out using a dataset kindly provided by PrecisionHawk using a Nikon 1 J3 camera (14 MPixels). The test site was a sewage treatment plant with new settling tanks that required surveying for inclusion in the OS MasterMap®
Topography Layer product. The imagery was orthorectified and mosaicked using Pix4D software. Figure 5 shows an example of the resulting imagery, from which topographic vectors were captured by a photogrammetric surveyor. The resulting data has yet to be compared with topographic vectors captured using conventional stereo aerial imagery, but initial impressions are that there is potential for using such UAV imagery in an
operational process. To test this further, OS have recently purchased a fixed wing UAV (Germap G180) and a multi-copter UAV (Aibot X6) which will be used to test the viability of UAVs for topographic survey of areas including:
• Small targets of known change (e.g. sewage treatment works)
• Prestige targets (e.g. corporate headquarters) • Coastal stretches (e.g. areas of cliff erosion)
Different camera and lens combinations and different processing software will also be tested to determine which give the most cost-effective results. From these tests we will decide whether or not UAVs will form a part of our future data collection toolbox.
Figure 5. A view of the new features in the Strongford sewage treatment works, captured by the PrecisionHawk UAV
One thread of our research will look at the use of standard off-the-shelf consumer cameras for topographic data capture. While we do not expect to be replacing our metric large format aerial cameras with DSLRs bought from the local camera shop in the near future, we do want to know how far we can take such consumer cameras and what level of accuracy we can expect from them. The performance of cameras continues to improve, as imaging sensors are developed with greater light gathering capabilities and higher pixel resolutions. For our UAV we opted for a full frame 42 Megapixel camera with a CMOS sensor (Sony Alpha 7R mark II) and a lower specification 24 Megapixel Sony A6000. These will be tested in different field conditions to find the combination of hardware, software, settings and processing systems which give us the best results for our topographic data collection requirements.
Other sensors, which have until now been too heavy or power-hungry to be used on a small UAV, are now becoming viable options. Lightweight Synthetic Aperture Radar (SAR) and Lidar sensors may provide an alternative method of data collection from UAVs in future. Camera manufacturers are constantly developing new sensors with, for example, Phase One offering a 100 megapixel camera for airborne surveys and Canon producing a 250 Megapixel sensor. If such sensors can be used in small format cameras, it will be interesting to see if they may eventually replace full frame metric cameras for aerial survey.
4. CONCLUSION
With so many new developments in the systems used to capture 3D data it can be a daunting task to keep up with them. No sooner have we tested a new scanner or camera, than another one comes on the market with a slightly higher resolution, or a richer The International Archives of the Photogrammetry, Remote Sensing and Spatial Information Sciences, Volume XLI-B4, 2016
specification. Customers for 3D data may want a point cloud, or a beautifully visualised 3D mesh, or a full 3D city model complete with attribution. The challenge for a mapping agency is to work out what data needs to be captured and how that data must be processed to provide the most appropriate products to satisfy the needs of our customer base. At the moment, we do not have a definitive answer to this challenge and it may be that there is no single answer. As a result we are developing a range of potential products, based on several different technologies. We will continue to test new systems, investigate new processes and develop new products, in order to give our customers a richer experience of 3D data.
ACKNOWLEDGEMENTS
Ordnance Survey would like to acknowledge the help and cooperation of the survey companies and hardware manufacturers who have contributed data to be used in our research. This includes Leica Geosystems, Korec, GeoSLAM and PrecisionHawk. We also acknowledge the help of colleagues at Ordnance Survey, especially Richard Milner and Jon Horgan for their work on 3D data processing.
REFERENCES
Allan, L. & Holland, D., 2000. Digital Photogrammetry, Developments at Ordnance Survey, The International Archives of Photogrammetry and Remote Sensing. Amsterdam, Vol. XXXIII, Part B2, pp. 46-51
Haala, N., Cramer, M., and Rothermel, M., 2013. Quality of 3D Point Clouds From Highly Overlapping UAV Imagery, The International Archives of the Photogrammetry, Remote Sensing and Spatial Information Sciences, vol. XL-1/W2, pp 183-188.
Holland, D. and Allan, L.E., 2008. The Digital National Framework and Digital Photogrammetry at Ordnance Survey. The Photogrammetric Record 17(98) pp. 291-301
PAPA International, 2016, website sourced April 2016, History of Aerial Photography,
http://professionalaerialphotographers.com/content.aspx?page _id= 22&club_id= 808138&module_id= 158950
Pérez, M., Agüera, F., and Carvajal, F. 2013. Low Cost Surveying Using an Unmanned Aerial Vehicle, The International Archives of the Photogrammetry, Remote Sensing and Spatial Information Sciences XL-1/W2, pp 311-315.
Remondino, F., Toschi, I., Gerke, M, Nex, F., Holland, D., McGill, A., Talaya Lopez, J. and Magarinos, A., 2016. Oblique Aerial Imagery for NMA – Some Best Practices. The International Archives of Photogrammetry and Remote Sensing. Prague.