AUTOMATIC REGISTRATION OF MULTIPLE LASER SCANS USING
PANORAMIC RGB AND INTENSITY IMAGES
M. Alba*, L. Barazzetti*, M. Scaioni*, F. Remondino**
* Politecnico di Milano, Department of Building Environmental Science and Technology, Milan, Italy Email: {mario.alba, luigi.barazzetti, marco.scaioni}@polimi.it, web: http://www.icet-rilevamento.lecco.polimi.it
** 3D Optical Metrology Unit, Bruno Kessler Foundation, Trento, Italy Email: [email protected], web: http://3dom.fbk.eu
Commission V - WG 3
KEY WORDS: Feature Extraction, Matching, Robust Estimation, Scan Registration, Terrestrial Laser Scanning
ABSTRACT:
This paper presents an automated methodology able to register laser scanning point clouds using their panoramic images derived from intensity values or RGB data, the latter obtained from a co-registered camera. Starting from the panorama of each laser scan, a Feature-Based Matching (FBM) algorithm is pairwise applied to extract corresponding key-points. Robust estimators are then used to remove outliers through a generalized rejection procedure encompassing several geometric models. After tracking the twofold key-points across different scan pairs in order to increase the local redundancies, a global Least Squares block adjustment is computed for all scans. Ground control points can also be included at this stage for datum definition and control of block’s stability. The proposed method was tested on real case studies and the experiments showed that the procedure is able to deliver the registration of all scans in a fully automatic way. On the other hand, if a higher accuracy is required this solution needs a further ICP refinement.
1. INTRODUCTION
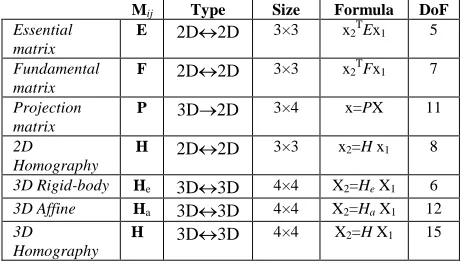
In the current practice of terrestrial laser scanning (TLS) the term scan registration is intended as the task to transform point clouds taken from different stand-points into a common reference system. In the case a TLS point cloud has to be registered to a ground reference system (GRS), the operation of mapping each scan into the GRS is called geo-referencing. Disregarding the method adopted for registration (see Table 1), most of them work in a pair-wise manner, i.e. first the scans are organized in pairs according to their relative overlap or proximity. Then each pair is co-registered. At the end all pairs are concatenated together using a minimization criterion. A comprehensive discussion and overview of the literature about this topic can be found in Vosselman and Maas (2010), and Barnea and Filin (2010). Despite the fact that the research community has been developing and testing new approaches for about a decade, at the moment practitioners still rely on a small subset. In particular, the target-based approach (Table 1, group A) plays a blockbuster role, followed by the use of surface matching techniques (B), among which the ICP algorithm (Besl and McKay, 1992; Chen and Medioni, 1992; Zhang, 1994) is the most widely exploited.
In the registration process, more than one technique can be used in a combined workflow. This is motivated by the fact that minimization algorithms like ICP require initial approximations for the rigid-body transformation parameters,
that can be provided by manual measurements of few correspondences, or derived using other automated methods (Pfeifer and Böhm, 2008).
In the latest years, the release of commercial laser scanners equipped with tools enabling the direct geo-referencing (F2) has increased the interest towards this technique, that hitherto was bounded to low-precision applications because it was based on the use of external sensors (F1). In dynamic applications of TLS like in mobile mapping vehicles, geo-referencing is also based on direct techniques. In this case, they are supported by an integrated IMU/GNSS navigation system (F3).
Other techniques (C-D-E) have been applied for scientific testing only, especially to improve the automation degree of the whole registration process. As the scan registration process is based on the extraction and measurement of corresponding features, the presence of any kind of natural texture on the scene can be exploited by applying an automatic and target-less method. Unfortunately, not all surveyed objects show a geometry suitable for application of surface matching algorithms (B). For this reason, other kinds of information (like intensity and RGB data) has been explored by different authors. In the category D, RGB images are adopted (Al-Manasir and Fraser 2006; Dold and Brenner, 2006; Barnea and Filin, 2007; González-Aguilera, 2009).
Registration method Typology of data used
Ground geo-referencing
Diffusion among practitioners
Number of scans
Degree of automation
Overlap between scans
A Target-based R/R+I Possible High Many Medium Very small
B Surface matching R/R+I/R+RGB Requires targets Medium-High Many Medium Large
C Intensity image-based R+I Requires targets Very-low Few High Large
D RGB image-based R+RGB Requires targets Low Few High Large
E Range+intensity+RGB R+I+RGB Requires targets Low Many High Large
F1 Static External sensors Possible Low Medium Low Very small
F2 Static Internal sensors Possible Medium Many Medium Very small
F3
Direct geo-referencing
Dynamic IMU/GNSS Possible Medium-High Many High Not needed
Table 1. Different categories of scan registration techniques with related characteristics; acronyms in the column ‘Typology of data used’ mean: R=range data, I=intensity data, RGB=color images.
Images are oriented using common features and a DLT approach. This task is carried out in an automatic way by means of Feature-Based Matching (FBM) techniques (Barnea and Filin, 2007; Kang et al., 2007) and removing the wrong correspondences with robust estimators.
Instead of using RGB data, a similar approach can be based on intensity (I) data recorded in correspondence of any 3D point (Table 1, group C). This solution has an important advantage, because the intensity information is natively co-aligned to each 3D point of the scan. Moreover, mapping the RGB images on the point cloud might suffer from co-registration or parallax errors, and from different spatial resolutions of both datasets. Unfortunately, the radiometric response of the laser return may largely change from one scan to another. Due to this motivation, this approach is limited to blocks with few scans, as can be found in the examples reported e.g. in Böhm and Becker (2007), Wang and Brenner (2008), Kang et al. (2009). The most advanced method currently in use is probably the one proposed by Barnea and Filin (2010), which has been proved to register several scans. It also incorporates the option to work with both RGB and intensity data. In the quoted paper, the use of diverse data sources is mainly aimed to registration purpose. It should be mentioned that the same method could be used for other goals, like RGB texturing of a point cloud (see e.g. Meierhold, 2010).
Usually, different kinds of images are related to laser scans:
1. pinhole images (RGB) captured by a camera integrated to the laser sensor; they could allow the indirect registration of scans from the orientation of images (Ullrich et al., 2003), otherwise they could be used for texturing purposes;
2. panoramic intensity images (“pano-I”) generated from the laser scan;
3. RGB panoramic images (“pano-RGB”) generated with an integrated digital camera.
Both kinds of panoramic images associate the range measurement in correspondence of each pixel.
The method for scan registration proposed in this paper is based on two considerations: (i) the possibility to develop a unique workflow able to integrate different data sources in order to extend the number of successful applications; (ii) the increasing automation of techniques C, D, E. The proposed method automatically registers, in a pairwise mode, all the aforementioned kinds of images, without interactive measurements (excluding geo-referencing in a common GRS). In a second stage, multiple correspondences between different image pairs are sought to increase the block reliability. This leads to the computation of a block adjustment including all scans and external constraints (Scaioni and Forlani, 2003). A final registration refinement can be afterwards carried out by means of surface matching.
2. SCAN REGISTRATION USING MULTIPLE DATA
Multiple scans are normally needed to capture the geometry of a complex object. This means that many stations must be aligned. This operation is called scan registration and requires the estimation of a 6-parameter rigid-body transformation between two scans i and j, where the spatial rotation matrix Rij and the translation vector Tij have to be worked out. Given a sufficient number of 3D point correspondences (at least 3), these parameters can be
estimated. In the case of several scans, these can be concatenated together by using a set of pairwise rigid-body transformations. The same transformation can be used for geo-referencing one or more scans to a GRS.
The availability of 3D positions, intensity and RGB data per each point can be exploited to generate panoramic images termed as ‘pano-I’ and ‘pano-RGB’, respectively. These data can be independently matched in order to obtain a set of image-to-image correspondences, whose 3D coordinates give a set of corresponding 3D points for the estimation of Rij and Tij. The panoramic images can be automatically co-registered with the method described in this section, which tries to combine 3D laser information with RGB or intensity information to extract corresponding points and to estimate the rigid-body transformation. Matching can be therefore carried out between the same kind of panoramic images (‘pano-I’ & ‘pano-I’ or ‘pano-RGB’ & ‘pano-RGB’) for co-registration purposes. To complete the remaining tasks, FBM operators are used to extract scale invariant features between pairs of images, disregarding their typology (subsect. 2.2). As FBM results in a large fraction of outliers, a following pairwise robust filtering has to be applied (subsect. 2.3). Even though different geometric models must be used per each kind of images, a common formalization is proposed here, which allows one to use all possible combinations with a common linear approach.
Two other categories of data can be integrated in the registration process, i.e. the original pinhole images acquired with the integrated laser camera (if available) and the images taken with an auxiliary camera. All these images can be used to form a photogrammetric block around the object, whose orientation can be carried out in fully automatic way e.g. using the method described in Barazzetti et al. (2010a). The knowledge of the laser camera orientation with respect to the IRS of TLS allows one to derive the geo-referencing parameters of each scan.
2.1 Data pre-processing
The first preliminary pre-processing step is the generation of the cylindrical panoramic image from intensity or RGB data, according to the following equations:
θ θ θ α α π
α)=(2 − )⋅∆ , ( )= ⋅∆
( v
u (1)
where u and v are the image coordinates in panorama, α the horizontal angle and θ the vertical angle measured by TLS (both anti-clockwise), ∆α and ∆θ the angular resolutions of panorama.
2.2 Key-point detection and matching
In Barazzetti et al. (2010b) a method to automatically extract corresponding key-points between pinhole and spherical RGB images is presented. The process is here extended towards panoramic images generated from laser scanning data, in which the vertical and horizontal pixel positions are defined on the basis of angles, and the numerical value of each cell is given by laser intensity or RGB data coming from a co-registered camera. In this case, 3D coordinates corresponding to each pixel are also available.
Given a pair of images, SIFT (Lowe, 2004) or SURF (Bay et al., 2008) operators are implemented to extract the key-points. Both are made up of a detector and a descriptor. The SIFT descriptor is a vector of 128 elements, while SURF has several descriptors with different lengths, although in this work we use a 128-element descriptor. After the extraction of the pixel coordinates from the panoramic images, a descriptor is created for each
detected point. Matching with these operators is based on the analysis of the differences between the descriptors of an image pair, using the L2 norm of the differences.
Given two panoramic images i and j and the extracted features with descriptors vi and vj, the image correspondences can be matched according to the following criterion:
min
where t = [0.65-0.75] in our experiments.
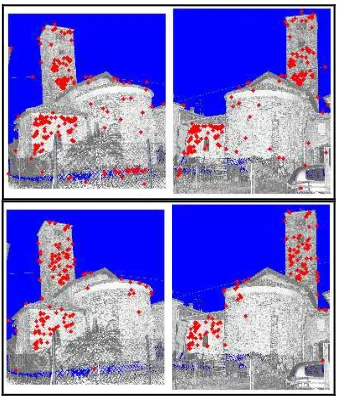
Fig. 1 shows the intensity images of two ‘pano-I’ matched with SIFT and SURF operators, respectively. They have a geometric resolution equal to 1,559×1,700 and 1,323×1,336 pix, thus smaller than 3 Mpix. If compared with the RGB images of the up-to-date digital cameras, these intensity images will feature a low resolution. Table 2 shows the numerical values of both processes. As can be seen, SURF is faster but finds less correspondences. However, the difference in terms of time is remarkable: few minutes for SIFT and some seconds for SURF.
To speed up data processing with SIFT a kd-tree search can be used (Arya et al., 1998). This leads to a processing time of 4.3 s for the comparison of descriptors, i.e. 45 times faster minute) because few features were available in these images. Points visible in three images were also found.
Figure 1. Key-points matched with both SIFT (top) and the two intensity images in Fig. 1.
Figure 2. Key-points for a ‘pano-RGB’ triplet matched with SIFT in less than 1 minute.
2.3 Removal of wrong correspondences in each pair
The key-point extraction procedure is independent from the geometric model of the specific images adopted. However, a FBM algorithm usually provides several mismatches. Thus a fully automated approach works with partially incorrect data and must be able to detect and remove any outlier from the dataset to process.
Generally, an automated matching with SIFT (or SURF) between image pairs taken with pinhole cameras is followed by an outlier removal based on the estimation of the fundamental (F) or essential matrix (E), depending on the fact the camera is uncalibrated or calibrated (Hartley and Zisserman, 2003). Indeed, the stereo geometry of a pair of images is encapsulated into these 3×3 matrices, which allow for the removal of wrong correspondences by checking the distance between a point and the corresponding epipolar line. The resulting system of equations is processed with high breakdown-point estimators (Barazzetti et al., 2010b). The only purpose of this estimation is to remove outliers, as the final orientation parameters can be computed at a later stage.
Any pair of corresponding points found in two panoramic images with the FBM procedure described in subsection 2.2 corresponds to a Cartesian triplet of coordinates xi:
strategy adopted to remove wrong correspondences follows the same approach adopted for 2D↔2D transformations (like those geometric relationships can be encompassed, as shown in Table 3. The resulting equations in the parameters mij are linear, property which simplifies their estimation as initial approximations are not required. Three different robust techniques are available in the current implementation, i.e.
RANSAC (Fischler and Bolles, 1981), Least Median Squares (Rousseeuw and Leroy, 1987) and MAPSAC (Torr, 2002). The analysis of outliers per each solution is computed on the basis of the residuals or by using a distance between generalized model for outlier rejection.
2.4 Outlier rejection
To remove all mismatches from the set of key-points, a procedure based on an affine transformation was used. This can be written as a linear transformation of homogenous vectors xi,j = [xi,j yi,j zi,j 1]T in both scans i and j to register. This approach was selected because is formally similar to that implemented for outlier rejection with pinhole camera images, as addressed at the beginning of this subsection. longer a rotation matrix). First of all, for each correspondence a scalar equations may be easily written (here mij = hij):
Similar equations can be written for the other coordinates yi,j and zi,j. These can be rearranged to derive a linear system useful for the estimation of the elements of the matrix Hij, given at least 4 point correspondences.
The unknown elements of the matrix Ha can be grouped into a 12 element vector h=[h11,…, h34]T in order to generate a important at this stage. Indeed, this method was implemented and used with RANSAC in order to discard wrong correspondences. As it is well-known, this high-breakdown
point estimator computes a high number of solutions based on randomly extracted datasets made up of the minimum number of observations. The number of trials must be as large as the probability to find a dataset including inliers only is greater than a fixed threshold (e.g. 95%). In order to avoid instability or degeneracy in the computation of the solution of each dataset, the random selection of points can be driven to obtain a uniform distribution by using bucketing (Zhang, 1995) on the panoramic images; a further test is performed on det(A) that has to largely
After the identification of a good subsample and removal of any outliers, a final Hij matrix can be estimated via Least Squares using all points classified as inliers. It is important to notice that this procedure is not applied to derive the final transformation parameters to be used to map all points in a common GRS.
2.5 Final scan registration
The previous matching procedure provides a set of key-points between all image pair combinations. The selection of scan pairs to be analyzed depends on the block geometry. If a scan block is regularly organized (e.g. a sequence), each scan can be compared to the previous and following scans. Otherwise all combinations of scans could be explored in an exhaustive way (all scan combinations), or manually picked up.
The final registration is computed through a 3D global adjustment of scans by using the whole set of key-points (Scaioni and Forlani, 2003). This approach is convenient if there is multiple overlap between scans, i.e. there are key-points visible in at least three of them. Although key-points have been found on each scan pair independently, the same initial sets of key-points extracted by SIFT or SURF from each panorama are used for the FBM across different pairs. If the overlap is significant, a relevant fraction of manifold key-points is expected. These are sought through the comparison of the image coordinates of key-points in different panoramas. Image key-points with the same coordinates will have a new label, in order to track the same points along as many panoramas as possible.
In the global L.S. block adjustment some ground control points (GCPs) can be introduced in order to define the GRS. If they are not available, the reference system of one scan can be adopted as GRS. First of all, approximate values for registration (Ri,Ti) of each scan to the GRS are computed by using a solution based on Hamilton’s Quaternions. The procedure exploits the availability of GCPs, in the case there is a scan with at least 4 GCPs. This scan is registered and the coordinates of all key-points in the GRS computed. Otherwise, one scan is adopted as reference and the coordinates of key-points in its IRS are used as temporary GCPs. Then all other scans are concatenated to the initial one. Once all approximations have been computed, a L.S. global adjustment is carried out including all key-points and possible GCPs. The adjustment could incorporate a more involved stochastic model, as proposed in Barnea and Filin (2010). Data snooping is adopted to remove remaining outliers from the final dataset.
The results of L.S. adjustment (geo-referencing parameters, ground coordinates of key-points and corresponding covariance matrices) can be refined by using a surface matching algorithm, if needed. For example, the computed parameters can be used as approximations to initialize an ICP registration. Implementation
of ICP including simultaneous registration of multiple point clouds is also possible (Williams and Bennamoun, 2001).
3. APPLICATION TO A REAL CASE STUDY
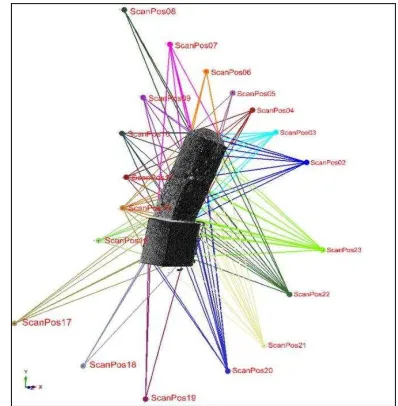
The proposed method for scan co-registration has been applied to a case study represented by an ancient church dating back to the 14-th century. A high number of scans (#20) captured with a Riegl LMS-Z420i scanner was acquired around the church, as shown in Fig. 3. The redundancy in measurements served: (i) to fill gaps and (ii) to obtain largely overlapping scans in order to help automatic search for key-points. A Nikon D100 (6Mpx) integrated into the range system allowed one to generate all ‘pano-RGB’ images in a straightforward manner.
A set of 37 GCPs consisting in retro-reflecting targets were installed and measured with the purpose of: (i) datum definition, (ii) improving the stability of the block of scans, (iii) checking the accuracy of the alignment. The resulting panoramas were generated with an average resolution of 2 cm in both horizontal and vertical directions.
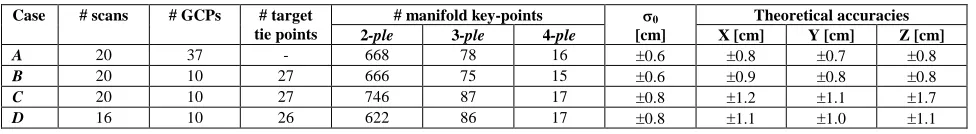
The registration based on ‘pano-RGB’ gave better results than the one based on ‘pano-I’. The block was shaped as a continuous sequence of scans, so that each of them was matched with the previous and the next ones. A variable number of key-points was found, ranging from 17 to 375 per pair. Such diverse results depended on the radiometric differences between scans, which were also due to the change of lighting conditions during the survey. Indeed, all on-site operations lasted a working day. After the measurement of GCPs, different configurations were tried using the same processing workflow described in Section 2. In configuration A (Table 4) all GCPs were used as weighted constraints and all key-points were introduced; in B only 10 GCPs were maintained, while the others played as tie points together with the other key-points; in C the same GCPs as in B were used, but only key-points were employed to link scans. Finally, configuration D is a sub-case of C, where 4 scans with few key-points were discarded.
In every case, even with the smaller set of GCPs, the procedure described in subsection 2.5 was employed to work out approximate geo-referencing parameters. This success demonstrated that the number of key-points was sufficient to link all scans among them. The search for multiple key-points provided many triple or quadruple points as well (as can be seen in Table 4).
These points were important to increase the inner reliability of the observations during the L.S. global adjustment of each block. A data snooping procedure was applied during the adjustment to remove remaining outliers. Finally, each solution was used to evaluate the accuracy with respect to a set of check points (Table 5); here a comparison to the solution obtained by using GCPs only was also accomplished. As can be seen, the quality of the solution slightly drops down when reducing the number of GCPs, as expected. The use of key-points without signalized control points like in case C gave the worst results in term of both theoretical (Table 4) and empirical (Table 6) accuracies. On the other hand, the high level of automation of this procedure can be used to initialize an ICP based registration. If compared to the reference solutions including all GCPs, the configuration C, which represents an ideal condition in a real projects (GCPs reduced to the minimum set to support block stability), does not significantly differ from the configuration based on GCPs only (row ‘targets’ in Table 6), which is
supposed to be the reference. By observing results on cases C and D, the removal of 4 scans with poorer key-point sets improved the accuracies. This result confirms that the success rate of this procedure is not homogeneously distributed across the block. A final ICP refinement provided a global discrepancy similar to the nominal precision of the laser scanner employed. The use of the same procedure for ‘pano-I’ did not provide sufficient key-points for the registration of all scans because of a worse texture with a limited number of key-points. Only a few pairs or triplets of scan could be processed. In Table 5 the results obtained with three ‘pano-I’ images corresponding to scans 1,22,23 are illustrated. The FBM technique allowed one to extract 14, 42 and 28 key-points, respectively. Unfortunately, none of them was visible in three images. Theoretical and empirical accuracies show a quality of registration slightly worse than the one obtained from ‘pano-RGB’.
Figure 3. Overview of the aligned scans with all TSL stations.
4. CONCLUSIONS
The paper presented a procedure for the automated registration of terrestrial laser scans. The method uses panoramic images generated from the intensity values acquired by the range instrument or the RGB values coming from a co-registered camera. The problem of looking for correspondences is initially solved between pairs of scans. A set of key-points is extracted using FBM in the 2D panoramic images, while the pairwise outlier rejection is carried out using the whole 3D point cloud. A generalized model to comprehend several geometric transformation was presented. After tracking key-points across different scan pairs, a final global adjustment including all scans is performed.
The procedure has some advantages, like (i) no requirement of any initial manual alignment of the scans, (ii) fast computing time, (iii) good distribution of key-points across the whole object and (iv) the chance to reduce the final registration error based on algorithms working on the global point cloud (e.g. ICP or others).
On the other hand some drawbacks, found also in similar methods proposed in the literature, have to be considered. Highly convergent scans with wide baselines can difficulty be processed, especially when working with intensity panoramas. Indeed for wide baselines the FBM operators cannot detect valid
correspondences. This means that the proposed procedure performs better when many acquisitions with short baselines are available. The use of RGB panoramas has to be preferred,
even though this option requires a TLS with an integrated camera.
# manifold key-points Theoretical accuracies Case # scans # GCPs # target
tie points 2-ple 3-ple 4-ple
σ0
[cm] X [cm] Y [cm] Z [cm]
A 20 37 - 668 78 16 ±0.6 ±0.8 ±0.7 ±0.8
B 20 10 27 666 75 15 ±0.6 ±0.9 ±0.8 ±0.8
C 20 10 27 746 87 17 ±0.8 ±1.2 ±1.1 ±1.7
D 16 10 26 622 86 17 ±0.8 ±1.1 ±1.0 ±1.1
Table 4. Parameters of the blocks used to test the registration method based on ‘pano-RGB’ and related results. In the column ‘target tie points’ is reported the number of retro-reflective targets used as additional tie points; columns ‘key-points’ refer to points automatically extracted from the ‘pano-RGB’ images
Theoretical accuracies Theoretical accuracies Case # GCPs # check
points
# double key-points
σ0
[cm] X [cm] X [cm] Y [cm] Z [cm] Y [cm] Z [cm]
A 4 7 42 ±0.7 ±0.4 ±0.4 ±0.3 0.2±2.4 -0.5±7.9 0.9±1.0
B 11 - - ±2.3 ±3.3 ±3.3 ±3.1 - - -
Table 5. Results of the registration of 3 scans (1,22,23) based on ‘pano-I’ images.
Case #check Statistics on check points (µ±σ) points X [cm] Y [cm] Z [cm]
A 37 -0.5±1.0 0.2±1.1 0.1±0.4
B 27 -0.7±1.3 -0.1±1.6 -0.4±1.1
C 27 -1.6±9.0 -2.4±5.6 -0.4±2.4
D 26 -0.6±6.1 0.0±2.8 -0.1±1.7
targets 37 0.0±0.5 0.0±0.4 0.0±0.6
Table 6. Residuals on check points according to different configurations and to the retro-reflective target registration, assumed as reference (last row).
REFERENCES
Al-Manasir, K., and C.S. Fraser, 2006. Registration of terrestrial laser scanner data using imagery. The Photogrammetric Record, 21(115), pp. 255-268.
Arya, S., Mount, D.M., Netenyahu, N.S., Silverman, R., and A.Y. Wu, 1988. An optimal algorithm for approximate nearest neighbour searching fixed dimensions. Journal of the ACM, 45(6), pp. 891-923.
Barazzetti, L., Remondino, F., and M. Scaioni, 2010a. Orientation and 3D modelling from markerless terrestrial images: combining accuracy with automation. The Photogrammetric Record, 25(132), pp. 356-381.
Barazzetti, L., Remondino, F., and M. Scaioni, 2010b. Extraction of accurate tie points for automated pose estimation of close-range blocks. In: IAPRSSIS, Saint Mandé, France, Vol. XXXVIII, Part 3A, pp. 151-156.
Barnea, S., and S. Filin, 2007. Registration of Terrestrial Laser Scans via Image Based Features. In: IAPRSSIS, Enschede, The Netherlands, Vol. XXXVI, Part 3/W52, pp. 26-31.
Barnea, S., and S. Filin, 2010. Geometry-Image-Intensity Combined Features for Registration of Terrestrial Laser Scans. In: IAPRSSIS, Saint Mandé, France, Vol. XXXVIII, Part 3A, pp. 145-150. Bay, H., Ess, A., Tuytelaars, T., and L. Van Gool, 2008. SURF:
Speeded up Robust Features. CVIU, 110(3), pp. 346-359. Besl, P.J., and N.D. McKay, 1992. A method for registration of 3-D
shapes. IEEE Trans. PAMI, 14(2), pp. 239-256.
Böhm, J., and S. Becker, 2007. Automatic marker-free registration
of terrestrial laser scans using reflectance features. In: Proc. 8th
Conf. on “Optical 3-D Measurement Techniques”, Zurich, Switzerland, pp. 338-344.
Chen, Y., and G. Medioni, 1992. Object modelling by registration of multiple range images. Image and Vision Computing, 10(3), pp. 145-155.
Dold, C., and C. Brenner, 2006. Registration of terrestrial laser scanner data using planar patches and image data. In: IAPRSSIS, Dresden, Germany, Vol. XXXVI, Part 5, pp. 78-83.
Fischler, M.A. and Bolles, R.C., 1981. Random sample consensus: a
paradigm for model fitting with applications to image analysis and automated cartography. Communications of the ACM, 24(6), pp.
381-395.
González-Aguilera, D., Rodríguez-Gonzálvez, P., and J. Gómez-Lahoz, 2009. An automatic procedure for co-registration of terrestrial laser scanners and digital cameras. ISPRS JPRS, 64(3), pp. 308-316. Hartley, R., and A. Zisserman, 2003. Multiple View Geometry in
Computer Vision – 2nd Ed. Cambridge University Press, UK.
Kang, Z., Zlatanova, S., and B. Gorte, 2009. Automatic registration of terrestrial laser scanning data based on registered imagery. In: Proc. 2007 FIG Working Week, 13-17 May, Hong Kong, China (CD-Rom). Kang, Z., Li, J., Zhang, L., Zhao, Q., and S. Zlatanova, 2009. Automatic
registration of terrestrial laser scanning point clouds using panoramic reflectance images. Sensors, 9, pp. 2621-2646.
Lowe, D., 2004. Distinctive image features from scale-invariant keypoints. Int. J. Computer Vision, 60(2): 91-110.
Meierhold, N., Spehr, M., Schilling, A., Gumhold, S., Maas, H.-G., 2010. Automatic feature matching between digital images and 2D representations of a 3D laser scanner point cloud. In: IAPRSSIS, Newcastle u.Tyne, UK, Vol. XXXVIII, Part 5, pp. 446-451.
Pfeifer, N., and J. Böhm, 2008. Early stages of LiDAR data processing. ISPRS Book Series "Advances in Photogrammetry, Remote Sensing and Spatial Information Sciences", Li, Chen and Baltsavias (Eds.), CRC Press, UK, Vol 7, pp. 169-184.
Rousseeuw, P.J. and Leroy, A.M. ,1987. Robust Regression and Outlier
Detection. John Wiley, New York. 329 pages.
Scaioni, M., and G. Forlani, 2003. Independent Model Triangulation of Terrestrial Laser Scanner Data. In: IAPRSSIS, Ancona Portonovo, Italy, Vol. XXXIV, Part 5/W12, pp. 308-313.
Torr, P.H.S., 2002. Bayesian model estimation and selection for epipolar geometry and generic manifold fitting. IJCV, 50(1): 35-61.
Ullrich, A., Schwarz, R., and H. Kager, 2003. Using Hybrid Multi-Station Adjustment for an Integrated Camera Laser-Scanner System.
In: Proc. 6th Conf. on “Optical 3-D Measurement Techniques”, Zurich,
Switzerland, pp. 298-304.
Vosselman, G., and H.-G. Maas, 2010. Airborne and Terrestrial Laser
Scanning. Whittles Publishing, Caithness, Scotland (UK).
Wang, Z., and C. Brenner, 2008. Point based registration of terrestrial laser data using intensity and geometry features. In: IAPRSSIS, Beijing, China, Vol. XXXVII, Part B5, pp. 583-590.
Williams, J., and M. Bennamoun, 2001. Simultaneous registration of multiple corresponding point sets. CVIU, 81(1), pp. 117-142. Zhang, Z.1994. Iterative point matching for registration of free-form
curves and surfaces. Int. J. of Computer Vision, 13 (2), pp. 119-152. Zhang, Z., 1995. Parameter Estimation Techniques: A Tutorial with
Application to Conic Fitting. Technical Report INRIA, n. 2676, Sophia-Antipolis, France.