IDENTIFICATION OF GEOMORPHIC SIGNATURES OF NEOTECTONIC ACTIVITY USING DEM IN THE PRECAMBRIAN TERRAIN OF WESTERN GHATS, INDIA
K. S. Jayappa*, Vipin Joseph Markose, Nagaraju M.
Dept. of Marine Geology, Mangalore University Mangalagangothri, Karnataka, India – 574 199
Working Group VIII/5
KEY WORDS: DEM, Geomorphology, GIS, Identification, Geology, Stream length gradient (SL) index
ABSTRACT:
To assess the relative tectonic activity classes, five geomorphic indices such as stream-gradient index (SL), drainage basin asymmetry (Af), hypsometric integral (Hi), valley floor width – valley height ratio (Vf) and drainage basin shape (Bs) of ninety-four sub-basins of Valapattanam river basin have been analysed by applying the standard formulae. Relative tectonic activity classes (Iat) obtained by the average (S/n) of different classes of geomorphic indices have been classified into three groups. Group I shows high tectonic activity with values of S/n < 2; group II shows moderate tectonic activity with S/n > 2 to < 2.5; and group III shows low tectonic activity with values of S/n ≥ 2.5. Field evidences such as deep valleys, sudden changes in the river course and waterfalls at fault planes clearly agree with the values and classes of tectonic geomorphic indices.
* Corresponding author.
1. INTRODICTION
Digital Elevation Model (DEM) supported morphometric analysis of landscape represents an active field of research in many geomorphological applications which aim to model surface processes. Landscapes in tectonically active areas result from a complex integration of the effects of vertical and horizontal motions of crustal blocks and erosion or deposition by surface processes (Burbank and Anderson, 2001). As a consequence, geomorphic investigation in regions of active tectonics is a powerful tool for studies of tectonic geomorphology (Azor et al., 2002). Significant improvement in spatial and spectral resolutions of satellite data, image processing techniques and advancement in computing resources have enabled the geomorphologists to carry out more quantitative and precise analysis of morphometric, morphotectonic and geomorphic indices. In recent studies related to morphotectonics, a mixture of geomorphologic and morphometric analyses of landforms and topographic analyses are utilized to obtain active tectonics (Della Seta et al., 2008). Perez-Pena et al. (2010) have used geomorphic indices and drainage pattern analysis for evaluating the Quaternary tectonic activity in the Sierra Nevada mountain range of SE Spain. Geomorphic indices computed by using GIS, are used for evaluating the geomorphic anomalies and tectonic activity (Dehbozorgi et al., 2010). Font et al. (2010) have used SL analysis for detecting the impact of differential uplift on drainage systems using DEM to understand landforms in relation to the tectonics of Normandy intra plate area of NW France. The objective of the preset study is to analyze various geomorphic indices and their influence on neotectonic activity of the Valapattanam river basin using SRTM DEM in GIS environment.
2. STUDY AREA
The Valapattanam river basin extending from 14059’49.46” to 15012’58.85” N latitudes and 74017’2.32” to 74036’46.35” E
longitudes in Kannur district of northern Kerala, India forms the study area (Figure 1). Valapattanam river originates in the Brahmagiri Ghat reserve forest in Karnataka at an altitude of 900-1350 m above mean sea level and drains into Kannur district of Kerala state. Major tributaries of this river are the Sreekantapuram river, Bavalipuzha, Venipuzha, and Aralam puzha. The total drainage area of this river basin is 1867 sq.km., of which 546 sq.km is outside the Kerala state. The basin is nearly level surface near the coast, undulating in the midland and steep sided hills and mountain in the east. The basin forms the Pre-Cambrian terrains of southern India occupied by hornblnde-biotite gneisses and hornblende diopside granulite which constitute the litho-units of migmatite complex.
3. METHDOLOGY
SRTM images were downloaded from GLCF website (http://glcf.umiacs.umd.edu) is used to extract the drainage networks and sub-basins of the area. After creating the DEM, errors such as sinks and peaks were removed using ‘fill sinks’ option available in ArcGIS hydro tools and created a Hydro DEM. Flow direction i.e. the direction in which water will flow out of the pixel to the eight surrounding pixels (Fairfield and Leymarie, 1991) was calculated for each pixel using the Hydro DEM as an input. In order to generate a drainage network, it is necessary to determine the ultimate flow path of every cell on the landscape grid. Flow accumulation was used to generate a drainage network, based on the direction of flow of each cell. The Stream Definition function takes a flow accumulation grid as input and creates a Stream Grid for a user defined threshold of 50. This threshold value represents the minimum upstream drainage area (threshold area) necessary to maintain a stream. Using smaller threshold value will include more tributaries in stream networks than using a larger threshold value. The stream grid will have a value of ‘‘1’’ for all the cells in the input grid that have a value greater than the given threshold. All other cells in the Stream Grid contain no data. Stream links, where streams join together, were calculated using stream segmentation
function. Stream links were used for stream order calculation by giving input of flow direction. The resulting stream order grid was converted into ESRI line format by using raster to feature conversion tool. Sub-watersheds were delineated by giving an outlet or pour point, which is the lowest point along the boundary of the watershed. The cells in the source raster are used as pour points above which the contributing area is determined. The drainage systems of 94 tributaries of Valapattanam river basin have been extracted and analyzed (Figure 1).
Figure 1. Map showing location and sub-basins of valapattanam river.
3.1 Geomorphic indices
Geomorphic indices applicable to fluvial systems in different regions and of varying size correlate with independently derived uplift rates (Kirby and Whipple, 2001) and are applicable to a variety of tectonic settings where topography is being changed (Bull and McFadden, 1977; Azor et al., 2002). The present study is based on the calculation of five geomorphic indices: Stream-length gradient index (SL), asymmetry factor (AF), hypsometric integral (Hi), drainage basin shape (Bs) and valley floor width-to-height ratio (Vf) for 94 sub-basins of the Valapattanam river basin. All the measurements have been carried out by using drainages and contours extracted from SRTM DEM in GIS environment.
4. RESULTS AND DISCUSSION
The results of analyzed geomorphic indices of the Valapattanam river basin are discussed in the following sections.
4.1 Stream length-gradient index (SL)
The SL index is a practical tool for measuring perturbations along stream longitudinal profiles, as it is sensitive to changes in channel slope (Burbank and Anderson, 2001). Furthermore, SL index may be used to detect recent tectonic activity by identifying anomalously high index values on a specific rock type (Chen et al., 2003; Zovoili et al., 2004). The SL index of each segment of the river was calculated by the equation (1)
SL= (Δh/Δl) L (1)
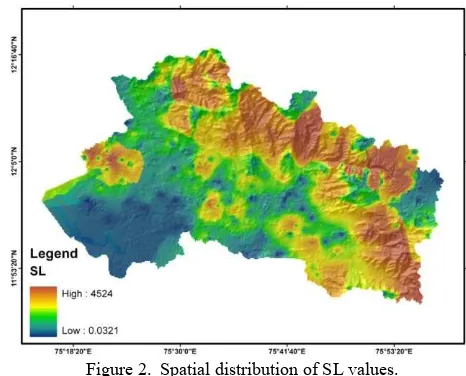
The SL index was calculated for all the 94 sub-basins covering the whole study area and the spatial distribution of SL map was prepared by Inverse Distance Weighted (IDW) interpolation method (Figure 2). High SL values are observed in sub-basins
located at the upper part of the river. Several locations along the head water regions of the river basin show anomalous SL values where the river crosses the fault planes, but in the downward part of the river, SL values are found to be distributed uniformly. The values were classified into three categories: SL ≥500; 300≤ SL<500; and <300. The anomalous SL values that are observed in uniform lithological conditions are due to tectonic activities. The SL index value will increase as rivers and streams flow over an active uplifts, and may have lesser values when they are flowing parallel to features such as valleys produced by strike-slip faulting (Keller and Pinter, 2002).
Figure 2. Spatial distribution of SL values.
4.2 Asymmetry factor (Af)
Af is an areal morphometric variable used to detect the presence or absence of regional tilt on basin or regional scale. The Af is determined by using the equation (2) (Keller and Pinter, 2002).
Af=AR/AT×100 (2)
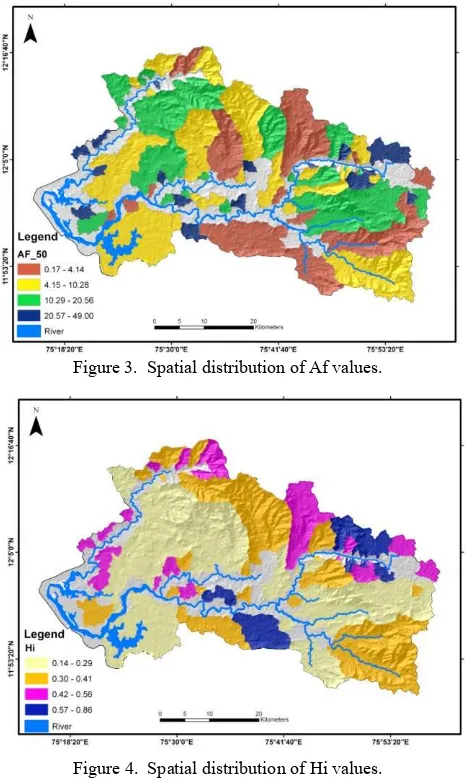
where, AR is the area of the basin to the right (facing downstream) of the trunk stream, and AT is the total area of the drainage basin. An Af factor above or below 50 may result from basin tilting, resulting either from active tectonics or lithologic/structural control, for example the stream slipping down bedding plains over time. The asymmetry factor was computed for selected 94 sub-basins with well developed drainage network. The difference between calculated Af values and neutral value i.e. 50 of the sub-basins vary between 0.17 and 49 (Figure 3). Higher values of Af in the NE-NW regions of the river basin are due to tectonic activity, whereas those near the estuary are due to lithological control. The values were classified into three categories: AF >16; Af <16Af>7; and Af <7.
4.3 Hypsometric curve and Integral (Hi)
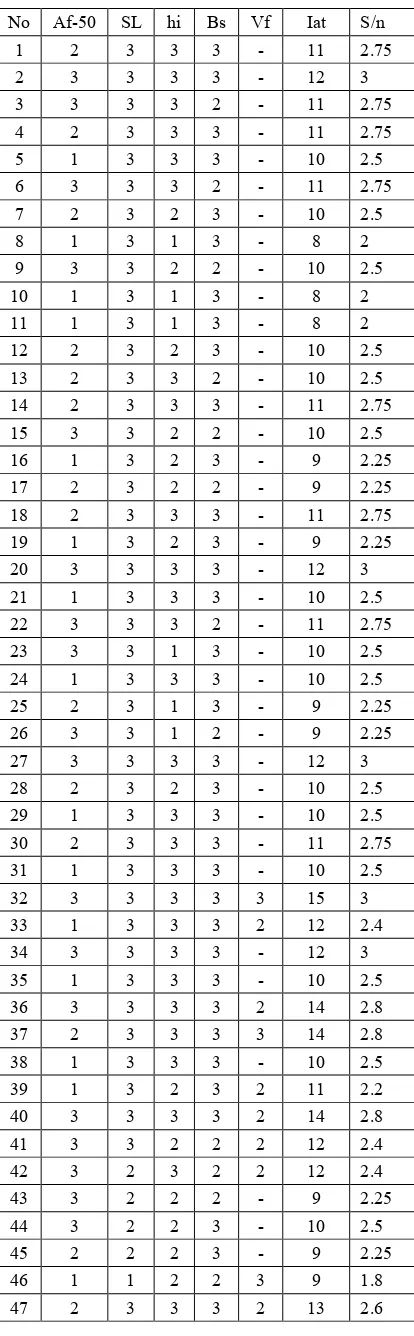
The hypsometric integral is an index that describes the distribution of elevation of a given area of a landscape. The integral is generally derived for a particular drainage basin and is an index that is independent of basin area. It corresponds to the area below the hypsometric curve and therefore is correlated with the shape of the curve (Keller and Pinter, 2002). We have used an extension called CallHypso (Perez-Pena et al., 2010) of the software ArcGIS 9.2 and a DEM with 90 m resolution for drawing hypsometric curves and calculation of hypsometric integral. Computed Hi values of the sub-basins range from 0.14 to 0.86 (Figure 4). Most of the sub-basins especially those
situated in the middle and lower parts of the basin show low Hi values. But sub-basins with structural control show convex hypsometric curves and high integral values. The values were classified into three categories: Hi ≥0.5; Hi<0.5 Hi > 0.4; and <0.4.
Figure 3. Spatial distribution of Af values.
Figure 4. Spatial distribution of Hi values.
4.4 Index of drainage basin shape (Bs)
Drainage basin shape is an elongation ratio and describes the planimetric shape of a basin. It is expressed as:
Bs= Bl/Bw (3)
where, Bl is length of the basin measured from its mouth to the most distal point in the drainage divide, and Bw is width of the basin measured across the short axis between left and right valleys divides (Ramirez-Herrera, 1998). The index reflects differences between elongated basins with high values of Bs associated with relatively higher tectonic activity, and more circular basins with low values generally associated with low tectonic activity. Relatively young drainage basins in active tectonic areas tend to be elongated in shape normal to the topographic slope of a mountain. In the study area, majority of the sub-basins show moderate to high Bs values which indicate elongated nature of the sub-basins (Figure 5). The values were classified into three categories: Bs >3; Bs <3 Bs>2; and <0.2.
Figure 5. Spatial distribution of Bs values.
4.5 Ratio of valley floor width to valley height (Vf)
The Vf ratio is a good measure that indicates whether the river is actively down cutting and incising (Bull and McFadden, 1977). Vf was calculated by using equation (4).
Vf=Vfw/[(Eld−Esc)+(Erd−Esc))/2] (4)
where, Vf is the ratio of valley floor width to valley height; Vfw is the width of the valley floor; Eld is the elevation of the divide on the left side of the valley; Erd is the elevation on the right side; and Esc is the average elevation of the valley floor. This index has been applied to evaluate the relative degree of tectonic activity of several mountain fronts located in the eastern and central Betic Cordillera (Silva et al., 2003). The index is a measure of incision and not uplift; but in an equilibrium state, incision and uplift are nearly matched. For each of the selected basin, the requisite valley width and height data were obtained along valley cross-sections perpendicular to the drainage basin axis and calculated the Vf (Figure 6). The values were classified into three categories: Vf≤0.39; Vf >0.55 Vf<1.05; and Vf >1.2.
Figure 6. Spatial distribution of Vf values.
4.6 Relative tectonic activity classes
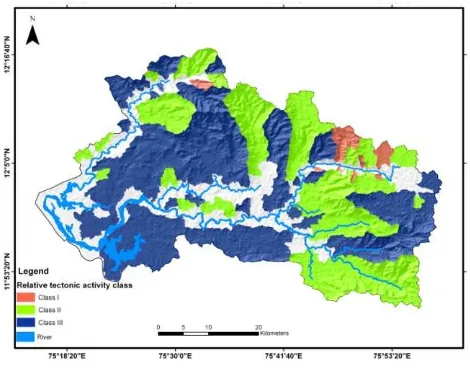
All the five geomorphic indices show anomalous high values in the river capture areas and low values above the Ghat region. The relative tectonic activity classes (Iat) were obtained by compiling all the five geomorphic indices. Based on the value of each
Table 1. Classification of the Iat (relative tectonic activity
geomorphic index, the indices are arbitrarily divided into three classes - class one with higher geomorphic index, class two with moderate index and class three with lower index (Table 1). Relative tectonic activity classes (Iat) obtained by the average (S/n) of different classes of geomorphic indices and classified into three groups - group I shows high tectonic activity with values of S/n < 2; group II shows moderate tectonic activity with S/n > 2 to < 2.5; and group III shows low tectonic activity with values of S/n ≥ 2.5 (Figure 7). Extensive fieldwork has been carried out to find out the evidences in order to confirm the tectonic activity. Field evidences such as deep valleys, sudden changes in the river course and waterfalls at fault planes clearly agree with the values and classes of tectonic geomorphic indices. Geomorphic indices computed from DEM using GIS are found to be suitable for identification of neotectonic activity in the Precambrian terrain of western Ghat regions of India. The low tectonic activity class 3 of Iat mainly occurs in the middle and lower parts of the basin, whereas high tectonic activity classes 1 and 2 occur in the upper part of the basin.
Figure 7. Relative tectonic activity classes.
5. CONCLUSION
An attempt has been made to utilize SRTM data and interpretation techniques of GIS to determine the geomorphic indices and its influence on tectonic activity in the Valapattanam river basin of northern Kerala, India. The analysis carried out by GIS and remote sensing methods helps us to determine the geomorphic indices of the drainage basin digitally and confidently. Five geomorphic indices - stream length-gradient index (SL), asymmetry factor (Af), hypsometric integral (Hi), drainage basin shape (Bs) and valley floor width-to-height ratio (Vf) – were analyzed. Geomorphic indices computed from DEM using GIS are found to be suitable for identification of neotectonic activity in the Precambrian terrain of Western Ghat regions of India. The low tectonic activity class 3 of Iat mainly occurs in the middle and lower parts of the basin, whereas high tectonic activity classes 1 and 2 occur in the upper part of the basin.
ACKNOWLEDGEMENT
The authors wish to thank Mangalore University for providing financial assistance for attending the ISPRS 2012.
REFERANCES
Azor, A., Keller, E.A. and Yeats, R.S., 2002, Geomorphic indicators of active fold growth: South Mountain-Oak Ridge anticline, Ventura basin, southern California. Geological Society of America Bulletin, 114(6), pp.745-753.
Chen, Y., Sung, Q. and Cheng, K., 2003, Along-strike variations of morphometric features in the western foothills of Taiwan: tectonic implications based on stream gradient and hypsometric analysis. Geomorphology, 56, pp. 109-137.
Dehbozorgi M, Pourkermani M, Arian M, Matkan AA, Motamedi H, Hosseiniasl A (2010) Quantitative analysis of relative tectonic activity in the Sarvestan area, central Zagros, Iran. Geomorphology, 121, pp. 329-341.
Della Seta, M., Del Monte, M., Fredi, P., Miccadei, E., Nesci, O., Pambianchi, G., Piacentini, T. and Troiani, F., 2008, Morphotectonic evolution of the Adriatic piedmont of the Apennines: advancement in the knowledge of the Marche-Abruzzo border area. Geomorphology, 102, pp. 119-129.
Fairfield, J. and Leymarie, P., 1991, Drainage networks from grid digital elevation models. Water Resource Research, 30(6), pp. 1681-1692.
Font M, Amorese D, Lagarde JL (2010) DEM and GIS analysis of the stream gradient index to evaluate effects of tectonics: The Normandy intra plate area (NW France). Geomorphology, 119, pp. 172-180.
Keller EA and Pinter N (2002) Active Tectonics: Earthquakes, Uplift and Landscape. Prentice Hall, New Jersey, pp.362.
Kirby, E. and Whipple, K., 2001, Quantifying differential rock-uplift rates via stream profile analysis. Geology, 29(5), pp. 415-418.
Perez-Pena, J.V., Azanon, J.M. and Azor, A., 2009, CalHypso: an ArcGIS extension to calculate hypsometric curves and their statistical moments. Applications to drainage basin analysis in SE Spain. Computers & Geosciences. 35, pp. 1214-1223.
Perez-Pena, J.V., Azor, A., Azanon, J.M. and Keller, E.A., 2010, Active tectonics in the Sierra Nevada (Betic Cordillera, SE Spain): Insights from geomorphic indexes and drainage pattern analysis. Geomorphology, 119, pp.74-87.
Ramirez-Herrera, M.T., 1998, Geomorphic assessment of active tectonics in the Acambay graben, Mexican volcanic belt. Earth Surface Processes and Landforms, 23, pp. 317-332.
Silva PG, Goy JL, Zazo C, Bardaji T (2003) Fault generated mountain fronts in Southeast Spain: geomorphologic assessment of tectonic and earthquake activity. Geomorphology, 50, pp. 203-226.
Zovoili, E., Konstantinidi, E. and Koukouvelas, I.K., 2004, Tectonic geomorphology of escarpments: the cases of Kompotades and Nea Anchialos faults. Bulletin of the Geological Society of Greece, 36, pp. 1716-1725.