SENSITIVITY ANALYSIS OF BIOME-BGC MODEL FOR DRY TROPICAL FORESTS OF
VINDHYAN HIGHLANDS, INDIA
Manoj Kumara* and A. S. Raghubanshib
aEcosystem Analysis Laboratory, Department of Botany, Banaras Hindu University, Varanasi- 221005, India. b
Institute of Environment & Sustainable Development, Banaras Hindu University, Varanasi- 221005, India. * E-mail: [email protected]
KEYWORDS: Biome-BGC model, Dry deciduous forest, Net primary productivity, Sensitivity index, Vindhyan highlands.
ABSRACT:
A process-based model BIOME-BGC was run for sensitivity analysis to see the effect of ecophysiological parameters on net primary production (NPP) of dry tropical forest of India. The sensitivity test reveals that the forest NPP was highly sensitive to the following eco-physiological parameters: Canopy light extinction coefficient (k), Canopy average specific leaf area (SLA), New stem C : New leaf C (SC:LC), Maximum stomatal conductance (gs,max), C:N of fine roots (C:Nfr), All-sided to projected leaf area ratio and Canopy water interception coefficient (Wint). Therefore, these parameters need more precision and attention during estimation and observation in the field studies.
1. INTRODUCTION
There are various types of models that may be used in ecosystem analysis. Ruimy et al. (1994), categorized the NPP model into three groups: (1) statistical models (Lieth, 1975), (2) parametric models (Potter et al., 1993) and (3) process models (Foley, 1994). Traditional types of models are regression models, which are based on empirically derived statistical relationships. Such models may be used for predicting stand development under stable conditions and in regions where the built-in relationships were derived. Naturally, such models are not so useful for incorporating changing growth conditions and for spatial extrapolation. Moreover, such models remain descriptive and do not offer much explanatory power for ecosystem analysis. For this, so-called process-based models must be deployed. These models simulate ecosystem development as a result of ecophysiological processes described mechanistically and usually incorporate the effect of environmental change on ecosystem functioning and are able to quantify effects of, e.g., change in climate, elevated CO2, nitrogen deposition and land use scenarios (Cienciala and Tatarinov, 2006).
Sensitivity analysis is the study of how the variation (uncertainty) in the output of a model can be apportioned, qualitatively or quantitatively, to different sources of variation in the input of the model (Xu et al., 2004). It can be used to examine which variables/parameters have the largest effect on the model output. Sensitivity analysis determines what level of accuracy is necessary for a parameter to make the model sufficiently useful and valid. If the sensitivity tests reveal that the model is insensitive to a particular factor, then it may be possible to use an estimate rather than a value with greater.
For ecological analysis Biogeochemical (BGC) model is most preferred. BIOME-BGC (Running and Coughlan, 1988; Thornton, 1998) is such model which employs a simplified biochemical model of photosynthesis, environmentally regulated stomatal conductance, and explicit calculations of respiration for various plant pools to calculate NPP. It is a process-based model requiring a considerable number of ecophysiological and site parameters. Therefore, application of this model requires
parameterization, including sensitivity analysis of model output to the input data.
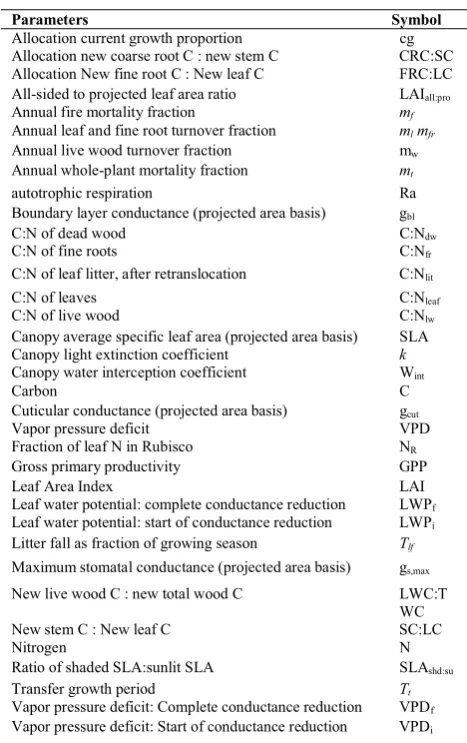
Parameters Symbol
Allocation current growth proportion cg Allocation new coarse root C : new stem C CRC:SC Allocation New fine root C : New leaf C FRC:LC All-sided to projected leaf area ratio LAIall:pro
Annual fire mortality fraction mf
Annual leaf and fine root turnover fraction ml mfr
Annual live wood turnover fraction mw
Annual whole-plant mortality fraction mt
autotrophic respiration Ra Boundary layer conductance (projected area basis) gbl
C:N of dead wood C:Ndw
C:N of fine roots C:Nfr
C:N of leaf litter, after retranslocation C:Nlit
C:N of leaves C:Nleaf
C:N of live wood C:Nlw
Canopy average specific leaf area (projected area basis) Canopy light extinction coefficient
SLA
k
Canopy water interception coefficient Wint
Carbon C
Cuticular conductance (projected area basis) gcut
Vapor pressure deficit VPD Fraction of leaf N in Rubisco NR
Gross primary productivity GPP Leaf Area Index
Leaf water potential: complete conductance reduction
LAI LWPf
Leaf water potential: start of conductance reduction LWPi
Litter fall as fraction of growing season Tlf
Maximum stomatal conductance (projected area basis) gs,max
New live wood C : new total wood C LWC:T WC New stem C : New leaf C SC:LC
Nitrogen N
Ratio of shaded SLA:sunlit SLA SLAshd:su
Transfer growth period Tt
Vapor pressure deficit: Complete conductance reduction VPDf
Vapor pressure deficit: Start of conductance reduction VPDi
Table 1: List of abbreviations
Previously, sensitivity analysis for BIOME-BGC (BioGeochemical Cycles) model has been conducted by White et al. (2000) and Tatarinov and Cienciala (2006) for temperate biomes. Reassessment of model sensitivity for dry tropical forest of India is needed because effect of parameters for different combinations of site and eco-physiological parameters may differ. Therefore, the aim of the present study is (i) to collect ecophysiological and site parameters for dry tropical forest of India from available literature and observations and (ii) to reveal the effect of ecophysiological parameters on NPP and also identify critically sensitive input parameters.
2. MATERIAL AND METHODS 2.1 BIOME-BGC model description
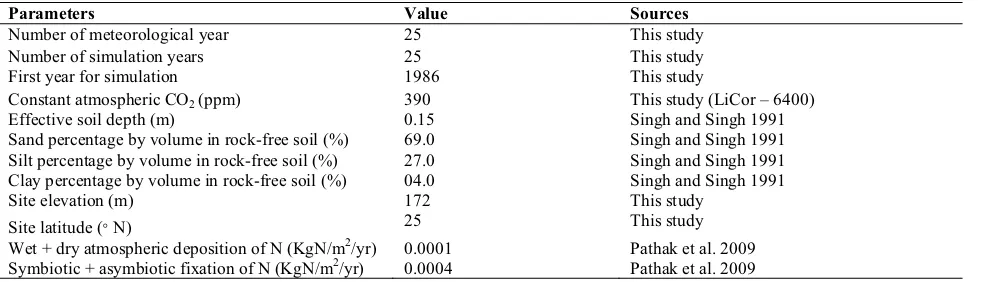
The BIOME-BGC version 4.1.2 was provided by Peter Thornton at the National Center for Atmospheric Research (NCAR), and the Numerical Terradynamic Simulation Group (NTSG) at the University of Montana (available online at http://www.ntsg.umt.edu.). The model is used for this study along with MT-CLIM (Mountain Microclimate Simulator). BIOME-BGC (Thornton 1998, 2000) is a biogeochemical model that simulates the storage and fluxes of water, C and N in terrestrial ecosystems using a daily time step and at different ecological scales (Churkina et al., 2003). The model requires daily weather data including radiation, maximum and minimum temperatures, precipitation and daytime VPD. It also requires information describing the soil properties (Table 2) and eco-physiological traits of vegetation (Table 3). Allometric relationships are used to initialize plant and soil C and N pools based on the leaf pools of these elements. BIOME-BGC estimates NPP on the basis of GPP and Ra (i.e. NPP).
Parameters Value Sources
Number of meteorological year 25 This study
Number of simulation years 25 This study
First year for simulation 1986 This study
Constant atmospheric CO2 (ppm) 390 This study (LiCor – 6400)
Effective soil depth (m) 0.15 Singh and Singh 1991
Sand percentage by volume in rock-free soil (%) 69.0 Singh and Singh 1991 Silt percentage by volume in rock-free soil (%) 27.0 Singh and Singh 1991 Clay percentage by volume in rock-free soil (%) 04.0 Singh and Singh 1991
Site elevation (m) 172 This study
Site latitude (ӓ N) 25 This study
Wet + dry atmospheric deposition of N (KgN/m2/yr) 0.0001 Pathak et al. 2009 Symbiotic + asymbiotic fixation of N (KgN/m2/yr) 0.0004 Pathak et al. 2009
Table 2: Model input parameters for site characteristics
2.2 Sensitivity analysis
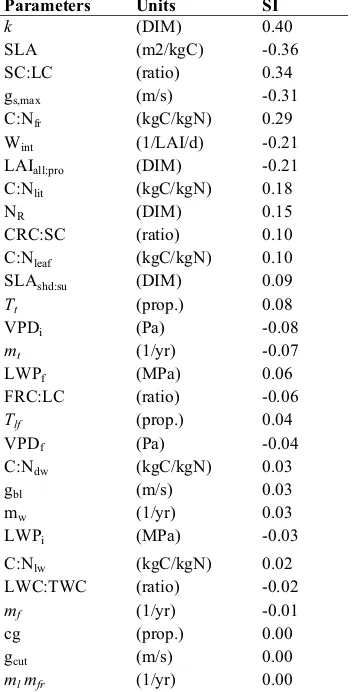
Sensitivity analysis was performed as documented in Cienciala and Tatarinov (2006), “output variables (y) to input parameters (x) (or the effect of parameter x on the variable y), y/x was calculated as a ratio of output variable change to parameter change (both in %)”. A negative ratio would mean a decrease in variable with an increased parameter value and vice versa (Cienciala and Tatarinov 2006). As for the absolute quantity (|y/x|), the parameters were ranked in terms of their effect on the modeled variable as (i) parameters with a strong effect (|y/x| larger than 0.2), (ii) parameters with a medium effect
total forest area in this block is 10360 ha. The climate is tropical and characterized by monsoon conditions. There are three seasons: rainy (mid June - Sept.), winter (November - February) and summer (March - mid June). The mean monthly temperatue varies from 17.5 C (January) to 37.5 C (May) and total annual rainfall averages 821 mm, of which 86 % occurs in the rainy season. The potential natural vegetation is northern tropical dry
deciduous forest (Champion and Seth, 1968). The details about dominated species of study area were described by Singh and Singh (1991).
3. RESULT
Sensitivity analysis for eco-physiological parameters revealed that SLA, gs,max, Wint and LAIall:pro exert a strong negative effect on NPP, while k, SC:LC and C:Nfr showed positive effect (Table 3). C:Nlit, NR, CRC:SC and C:Nleaf showed positive medium effect on NPP (Table 3). Input parameters like SLAshd:su, Tt, VPDi, mt,
LWPf, FRC:LC, Tlf, VPDf etc. had low sensitivity to model output value of NPP (Table 4). ml mfr, LWC:TWC, gcut has produced almost negligible effect on the sensitivity of the model.
4. DISCUSSION
ISPRS Archives XXXVIII- 8/W20; Workshop Proceedings: Earth Observation for Terrestrial Ecosystems
is due to the redistribution of biomass into the woody compartment with a low turnover rate (Tatarinov and Cienciala 2006). Maximum stomatal conductance (gs,max) showed a negatively high sensitivity to NPP; this was in contrast to the report of European temperate managed forestry (Tatarinov and Cienciala 2006). Increases in gs,max reduced NPP by increasing water stress. Increased C:Nfr, reduces root nitrogen requirements and diverts nitrogen to increased photosynthetic capacity which promotes higher NPP for most biomes (White et al. 2000). Fraction of leaf N in Rubisco of dry tropical forest showed positive sensitivity to NPP similar to major natural temperate biomes (White et al. 2000) and for beech and small or medium spruce species (Tatarinov and Cienciala 2006). This effect follows from the fact that maximum rate of carboxylation in the model is
proportional to NR(Tatarinov and Cienciala 2006). The effect of the C:Nlleaf was similar to the report of Tatarinov and Cienciala (2006) for beach species which was in contrast to White et al. (2000), who found, that the increase of C:Nleaf decreased NPP in all woody biomes. Such an ambiguous effect of C:Nleaf might be due to the trade-off between the increase of photosynthesis and foliage respiration with an increasing foliage nitrogen content (Tatarinov and Cienciala 2006). VPDi and VPDf showed low negative effect on NPP. This negative relation with NPP was due to increased VPD which causes closure of stomata resulting in inhibition of photosynthesis (Jarvis 1976; Stewart 1988). Fire mortality also had a low negative effect on NPP, which primarily occurs in summer season in dry deciduous forest, i.e., it is affected by fire mortality for a shorter time (Tatarinov and Cienciala 2006).
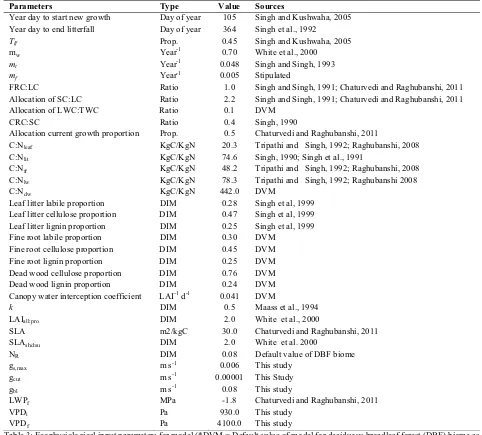
Parameters Type Value Sources
Year day to start new growth Day of year 105 Singh and Kushwaha, 2005 Year day to end litterfall Day of year 364 Singh et al., 1992
Tlf Prop. 0.45 Singh and Kushwaha, 2005
mw Year-1 0.70 White et al., 2000
mt Year-1 0.048 Singh and Singh, 1993
mf Year
-1 0.005 Stipulated
FRC:LC Ratio 1.0 Singh and Singh, 1991; Chaturvedi and Raghubanshi, 2011 Allocation of SC:LC Ratio 2.2 Singh and Singh, 1991; Chaturvedi and Raghubanshi, 2011
Allocation of LWC:TWC Ratio 0.1 DVM
CRC:SC Ratio 0.4 Singh, 1990
Allocation current growth proportion Prop. 0.5 Chaturvedi and Raghubanshi, 2011
C:Nleaf KgC/KgN 20.3 Tripathi and Singh, 1992; Raghubanshi, 2008
C:Nlit KgC/KgN 74.6 Singh, 1990; Singh et al., 1991
C:Nfr KgC/KgN 48.2 Tripathi and Singh, 1992; Raghubanshi, 2008 C:Nlw KgC/KgN 78.3 Tripathi and Singh, 1992; Raghubanshi 2008
C:Ndw KgC/KgN 442.0 DVM
Leaf litter labile proportion DIM 0.28 Singh et al, 1999 Leaf litter cellulose proportion DIM 0.47 Singh et al, 1999 Leaf litter lignin proportion DIM 0.25 Singh et al, 1999 Fine root labile proportion DIM 0.30 DVM
Fine root cellulose proportion DIM 0.45 DVM Fine root lignin proportion DIM 0.25 DVM Dead wood cellulose proportion DIM 0.76 DVM Dead wood lignin proportion DIM 0.24 DVM Canopy water interception coefficient LAI-1 d-1 0.041 DVM
k DIM 0.5 Maass et al., 1994
LAIall:pro DIM 2.0 White et al., 2000
SLA m2/kgC 30.0 Chaturvedi and Raghubanshi, 2011
SLAshd:su DIM 2.0 White et al. 2000
NR DIM 0.08 Default value of DBF biome
gs,max m s-1 0.006 This study
gcut m s-1 0.00001 This Study
gbl m s-1 0.08 This study
LWPf MPa -1.8 Chaturvedi and Raghubanshi, 2011
VPDi Pa 930.0 This study
VPDf Pa 4100.0 This study
Table 3: Ecophysiological input parameters for model (*DVM = Default value of model for deciduous broadleaf forest (DBF) biome as White et al. (2000))
Parameters Units SI
Table 4: Sensitivity Index (SI) for Ecophysiological parameters
5. CONCLUSION
The study identified key eco-physiological parameters of a process model BIOME-BGC based on a detailed sensitivity analysis. Among the eco-physiological parameters k, SLA, SC:LC, gs,max, C:Nfr, LAIall:pro and Wint showed the strongest effect on simulated NPP. Four ecophysiological parameter viz., C:Nlit, NR, C:Nleaf and CRC:SC had medium influence on simulated NPP
value. Therefore these parameters need more precision and attention during estimation and observation in the field study.
REFERENCES
Champion, H.G. and Seth, S.K., 1968. A revised survey of the forest types of India. Government of India Publications, New Delhi.
Chaturvedi, R.K., Raghubanshi, A.S. 2011. Plant Functional Traits in a Tropical Deciduous Forest; An Analysis. Lambert Academic Publishing Gmbh & Co. KG, Germany.
Churkina G, Tenhunen J., Thornton, P, Falge, E.M., Elbers J.A., Erhard M., Grünwald, T., Kowalski, A.S., Rannik, Ü., Sprinz, D.,
2003. Analyzing the ecosystem carbon dynamics of four European coniferous forests using a biogeochemistry model. Ecosystems, 6, pp.168–84.
Cienciala E. and Tatarinov F.A., 2006. Application of BIOME-BGC model to managed forests 2. Comparison with long-term observations of stand production for major tree species. Forest Ecol Manag, 237, pp. 252–266.
Foley, J.A., 1994. Net primary productivity in the terrestrial biosphere: the application of a global model. J. Geophys. Res. 99, 20773–20783.
Lagergren, F., Eklundh, L., Grelle A., Lundblad, M., Mölder, M., Lankreijer, H. and Lindroth A., 2005. Net primary production and light use efficiency in a mixed coniferous forest in Sweden. Plant Cell Environ, 28, pp. 412–423.
Lieth, H., 1975. Modeling the primary productivity of the world. In: Lieth, H., Whittaker, R.H. (Eds.), Primary Productivity of the Biosphere. Springer-Verlag, New York, pp. 237–263.
Luo, Z., Sun, O.J, Wang, E., Ren, H. and Xu H., 2010. Modeling Productivity in Mangrove Forests as Impacted by Effective Soil Water Availability and Its Sensitivityto Climate Change Using Biome-BGC. Ecosystems, 13, pp. 949–965.
Maass, J.M., Vose, J.M., Swank, W.T., Martinez-Yrizar A., 1995. Seasonal changes of leaf area index (LAI) in a tropical deciduous forest in west Mexico. Forest Ecol Manag, 74, pp.171–180. Pathak, H., mohanty, S., Prasad, R., 2009. Fate of nitrogen in Indian agriculture: environmental impacts, quantification and uncertainties – A review. Proc. Nat. Acad. Sci. India, 79, 331 – 345.
Potter, C.S., Randerson, J.T., Field, C.B., Matson P.A., Vitousek, P.M., Mooney, H.A. et al. 1993. Terrestrial ecosystem production—a process model-based on global satellite and surface data. Global Biogeochem Cy, 7, PP. 811 – 841.
Raghubanshi, A.S., 2008. Nitrogen cycling in Indian terrestrial natural ecosystems. Current Sci, 94,11, pp. 1404-1412.
Ruimy, A., Saugier, B., Dedieu, G., 1994. Methodology for the estimation of terrestrial net primary production from remotely sensed data. J Geophys Res, 99, 5263–5383.
Running, S.W. and Coughlan J.C., 1988. A general model of forest ecosystem processes for regional applications. I. Hydrological balance, canopy gas exchange and primary production processes. Ecol Model, 42, pp. 125–154.
Singh, J.S., and Singh, V.K., 1992. Phenology of seasonally dry tropical forest. Curr Sci, 63(11), pp. 684-689.
Singh, K.P. and Kushwaha C.P., 2005. Paradox of leaf phenology: Shorea robusta is a semi-evergreen species in tropical dry deciduous forests in India. Curr Sci, 88, 1820 – 1824. Singh, L. and Singh, J. S., 1991. Storage and flux of nutrient in a dry tropical forest in India. Ann. Bot. 68: pp 275-284.
ISPRS Archives XXXVIII- 8/W20; Workshop Proceedings: Earth Observation for Terrestrial Ecosystems
Singh, L., 1990. Biomass Production and Nutrient Dyanamics in a Dry Tropical Forest. Ph.D. thesis, Banaras Hindu University, pp80-120.
Tatarinov F. A. and Cienciala E. 2006. Application of BIOME-BGC model to managed forests 1. Sensitivity analysis. Forest Ecol Manag, 237, pp. 267–279.
Thornton, P.E., 1998. Description of a Numerical Simulation Model for Predicting the Dynamics of Energy, Water, Carbon, and Nitrogen in a Terrestrial Ecosystem, Ph.D. Thesis, Univ. Montana, Missoula, MT, pp 280.
Tripathi, S.K., and Singh, K.P., 1992; Nutrient immobilization and release patterns during plant decomposition in a dry tropical bamboo savanna, India. Biol Fertil Soils, 14, pp. 191-199.
White, M.A., Thornton, P.E., Running, S.W., and Nemani, R., 2000. Parameterization and Sensitivity Analysis of the BIOME–
BGC Terrestrial Ecosystem Model: Net Primary Production Controls. Earth Interact, 4:003, pp.1-85.
Xu, C., Hu, Y., Chang, Y., Jiang, Y., Li, X., Bu, R., He., H., 2004. Sensitivity analysis in ecological modelling. J App Ecol 15:1056-62.
ACKNOWLEDGEMENTS
Biome-BGC version 4.1.1 was provided by the Numerical Terradynamic Simulation Group (NTSG) at the University of Montana. NTSG assumes no responsibility for the proper use of Biome-BGC by others. The authors are thankful to the ISRO-SAC (Space Application Centre) for funding support through “Energy Mass Exchange in Vegetation System” project. MK thankfully acknowledges Council of Scientific and Industrial Research, India for funding support.