RIPARIAN VEGETATION STATUS AND RATES OF WATER USE FROM SATELLITE
DATA
K. Sheffield a, *, M. Abuzar a, D. Whitfield b, A. McAllister b, M. O’Connellb
a
Future Farming Research Division, Department of Primary Industries, Parkville, Victoria - (kathryn.sheffield, mohammad.abuzar)@dpi.vic.gov.au
b
Future Farming Research Division, Department of Primary Industries, Tatura, Victoria - (des.whitfield, andy.mcallister, mark.oconnell)@dpi.vic.gov.au
KEY WORDS: Ecosystem, Vegetation, Multitemporal, Landsat, Management
ABSTRACT:
Hydrology and water availability are key determinants of the health of riparian vegetation systems, and an understanding of the interactions between vegetation and hydrology is a prerequisite for the maintenance and improvement of these systems under managed water regimes. Changes to natural flooding cycles, caused by the regulation of river flows and irrigation activities, have changed the composition and amount of vegetation, and the distribution of species within riparian areas (Chong and Ladson, 2003; Lawrence and Colloff, 2008). The extent and frequency of flooding cycles are key issues for the health of riparian ecosystems under controlled water management regimes. This paper demonstrates the potential contribution of satellite-based measurements to an improved understanding of the changes in vegetation status of riparian systems, and, also, of their water requirement. Evapotranspiration (ET) and Normalised Difference Vegetation Index (NDVI) of the Barmah Forest were derived from satellite imagery over a number of years. NDVI provided a general measure of vegetation status and cover. ET measures provided an indication of the availability of water to the existing vegetation, and an assessment of areas under water-stress (Anderson et al., 2012). Previous work has demonstrated that these indicators provide a comprehensive measure of riparian vegetation status (Sheffield et al., 2011), and estimates of vegetation water requirement (Whitfield et al., 2010a; Sheffield et al., 2011). This paper addresses changes in NDVI and ET rate of major vegetation classes in the Barmah Forest over the period, 1993 – 2008. Measures of ET and NDVI, analysed in conjunction with rainfall and river flow data, provided insights into the response of vegetation to changes in water availability, which may be used to evaluate impacts of management practices and water regime within riparian zones.
* Corresponding author.
1. INTRODUCTION 1.1 Overview
The physiological health and activity of riparian vegetation systems are heavily influenced by water availability and the hydrological processes that govern the distribution of water in time and space within those systems. The distribution and regeneration of plant species in riparian zones is also linked with water availability and factors such as frequency, timing, depth and duration of inundation during flood events. Inundation characteristics affect the distribution and abundance of riparian plant species in addition to a range of ecosystem functions and primary production within the riparian system (Chong and Ladson, 2003; MDBC, 2006; Stromberg et al., 2006; Lawrence and Colloff, 2008; Sims and Colloff, 2012).
Water availability in riparian areas is also affected by natural events such as drought, and human activities including the regulation of river flows and irrigation. Environmental flows are increasingly employed to maintain riparian areas in regulated river systems, where the volume and extent of flooding is controlled by regulators, pipes and culverts. Issues such as frequency, duration and extent of riparian flooding are most pronounced under limited water supply, when regional water managers are required to address the balance between commercial and environmental uses of water.
The water management of riparian systems will be better informed by an improved understanding of rates of water use relative to water requirements. An improved understanding of where the water is required is needed to improve the availability of water to targeted species or geographic zones. Objective, affordable repeatable measurements of vegetation status and water use are the minimum required to support improved water management of riparian systems in Australia and elsewhere. The use of satellite-based assessments of water use to support resource management and monitoring is advocated by Anderson et al (2012). This paper aims to demonstrate the potential contribution of satellite-based remotely sensed data to improved understanding of water requirements and vegetation status within the Barmah Forest, Australia. This paper aims to evaluate the information extracted from remotely sensed data as we hypothesize that it will provide important monitoring opportunities in riparian ecosystems.
Remotely sensed data additionally allow a retrospective assessment of the impact of past and current water management on vegetation status. The data can be used to appraise the effectiveness of ‘environmental flows’ and identify areas of riparian vegetation in decline. This type of information will contribute to a greater understanding of water requirements within riparian systems. The extensive spatial coverage of remotely sensed data allow riparian vegetation to be assessed across the landscape, a key consideration in the connectivity of riparian systems which is important to both species diversity
and ecosystem function (Lindenmayer et al., 2008; Peake et al., 2011).
This study used measures of evapotranspiration (ET) and vegetation (measured as Normalised Difference Vegetation Index: NDVI), derived from satellite imagery acquired over a number of years, to assess changes in vegetation status and physiological activity of the Barmah Forest, located on the Murray River in northern Victoria. NDVI is a commonly used remotely sensed vegetation descriptor and responds to levels of green biomass and vegetation cover. Sims and Colloff (2012) suggested NDVI could be used as a measure of vegetation response, in terms of primary production, to environmental flows, providing a means of gauging the impact of environmental flows on riparian vegetation.
Measures of ET have been used in the water use of both agricultural and natural vegetation systems at a range of spatial and temporal scales (Bastiaanssen et al., 2005; Allen et al., 2007a; Scott et al., 2008; Glenn et al., 2011). ET measures provided an indication of the availability of water to the existing vegetation, and an assessment of areas under water-stress (Anderson et al., 2012). The SEBAL (Bastiaanssen et al., 1998; Bastiaanssen et al., 2005) and METRIC (Allen et al (2007b) methods use remotely sensed data (visible and thermal information) and ground based weather observations to estimate ET as a component of the surface energy balance on a per-pixel basis. Vegetation water requirements may be gauged using satellite-based measures of ET and NDVI (Whitfield et al., 2011).
The METRIC method was used in this study. METRIC defines vegetation ET relative to an on-ground measure of reference crop ET at the time of image acquisition. METRIC thereby aligns ET measures with estimates of crop water requirement calculated by standardised methods appropriate to ‘short’ grass reference crop ET (ET0) or ‘tall’ grass reference crop ET (ETr) (Allen et al., 2006).
1.2 Study area
This study focussed on the vegetation of the Barmah Forest, which is located on the Murray River in northern Victoria. The Forest covers approximately 28,500ha. The nearby Millewa Forest covers approximately 38,100ha and was not considered in this study. The Barmah forest is part of the largest River Red Gum (Eucalpytus camaldulensis) forest in Australia and is listed as an environmental ‘icon’ site in the Murray-Darling Basin, based on its environmental, cultural and international significance (MDBC, 2006). The Barmah Forest wetlands are listed under the international Ramsar wetland protection convention and are included in several international migratory bird conservation agreements.
Northern Victoria experiences a semi-arid climate, and the forest relies on river flows and topology features that support over-bank flooding throughout the forest, which maintain vegetation growth and activity (Bacon et al., 1993; Chong and Ladson, 2003). Groundwater provides additional localised water sources for vegetation in the Forest, although they are not considered as important as surface water sources (MDBC, 2006).
Changes in the delivery of water through the forest are having a significant impact on the vegetation condition and ecosystem
function within the forest (Chong and Ladson, 2003; Lawrence and Colloff, 2008; Berrisford et al., 2009)
2. METHODS 2.1 Vegetation classes in the Barmah Forest
The Barmah Forest comprises several vegetation communities. The Forest includes areas categorised as River Red Gum forest, Moira Grass and Giant Rush communities, Black Box and Grey Box woodlands, and waterways and wetlands (MDBC, 2006; Lawrence and Colloff, 2008).
Ecological Vegetation Classes, published by the Department of Sustainability and Environment (www.dse.vic.gov.au) were used to provide vegetation mapping in the Barmah Forest. The vegetation classes reported in this paper are:
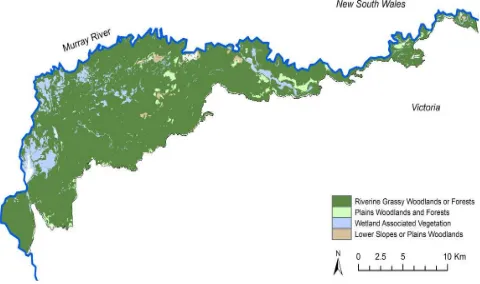
− Riverine Grassy Woodlands and Forests (RGW), − Wetland Associated Vegetation (WAV), − Plains Woodlands or Forests (PWF), and − Lower Slopes or Plains Woodlands (LSW).
Figure 1 shows the spatial distribution of vegetation types within the study area. RGW is the dominant vegetation type in the forest, covering approximately 88% of the forest area. The second most common vegetation type is WAV, which accounts for approximately 8% of the forest area.
Figure 1. Distribution of Ecological Vegetation Class Groups within the Barmah Forest
2.2 Satellite-based estimates of ET and NDVI
Measures of NDVI and ET were derived from Landsat 5 TM data acquired from the USGS (Path/Row 93/85 for 27/11/1993, 07/11/2003 and 04/11/2008). The image data were converted to top of atmosphere reflectance and re-sampled to a 30m spatial
where NIR= near infrared reflectance Red = red reflectance
Satellite-based assessments of ET were calculated according to Allen et al (2007b). Surface roughness of vegetation was estimated using the relationship of Teixeira et al (2009).
ET data were standardised against ETr values appropriate to individual images, and are presented in terms of ETrF, where ETrF equals ET/ETr. ETrF values of near zero represent little or no ET, whereas values of approximately one indicate near maximum ET rates of ‘dry’ vegetation. ETrF values greater than one indicate ET rates that exceed vegetation maxima, and are generally associated with wet surface soil conditions or the presence of surface water on vegetation.
Ground-based weather data used in the ET calculations were sourced from weather records archived at the Department of Primary Industries Tatura and www.weatherzone.com.au. Monthly rainfall data for Echuca were sourced from the Bureau of Meteorology (www.bom.gov.au). River flow information was sourced from the Murray Darling Basin Authority (http://www.mdba.gov.au/water/live-river-data).
3. RESULTS
The dominant vegetation type in the Barmah Forest is RGW, with smaller areas of WAV, LSW and PWF present (Figure 1). Individual vegetation types showed a decrease in ET rates of between 35% and 55% between 1993 and 2008. There was a decline in NDVI of between 11% and 18% for individual vegetation types between 1993 and 2008 except for WAV, which increased 58% over the same period.
Table 1. Mean (and standard deviation) NDVI and ETrF pixel values for vegetation types located within the Barmah Forest.
Vegetation Date NDVI ETrF
RGW 26/11/1993 0.36 (0.13) 1.10 (0.23) RGW 6/11/2003 0.42 (0.07) 0.71 (0.16) RGW 3/11/2008 0.32 (0.06) 0.61 (0.13) WAV 26/11/1993 0.19 (0.28) 1.28 (0.16) WAV 6/11/2003 0.45 (0.11) 0.89 (0.13) WAV 3/11/2008 0.30 (0.08) 0.57 (0.23) LSW 26/11/1993 0.40 (0.08) 0.95 (0.21) LSW 6/11/2003 0.39 (0.06) 0.59 (0.10) LSW 3/11/2008 0.33 (0.42) 0.55 (0.08) PWF 26/11/1993 0.38 (0.10) 0.84 (0.27) PWF 6/11/2003 0.37 (0.06) 0.57 (0.11) PWF 3/11/2008 0.32 (0.05) 0.55 (0.10)
n: RGW = 306,492 pixels, WAV = 26,435 pixels, LSW = 2,905 pixels, PWF = 8,330 pixels
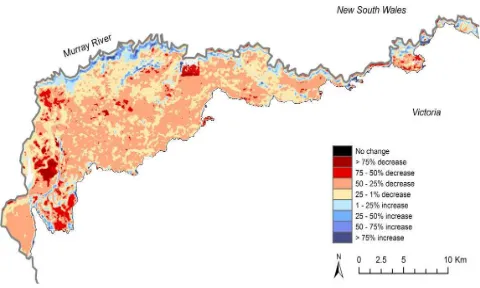
The spatial distribution of change in ET rates between 1993 and 2007 is shown in Figure 2. Approximately 88% of the forest showed a decrease in ET rates. Approximately 48% of the forest experienced a decrease between 25% and 50%, while 33% of the forest showed a decrease of between 1% and 25%. Most areas that experienced an increase in ET rates are associated with river channels running through the forest.
Figure 3 shows the spatial distribution of change in vegetation cover (NDVI) between 1993 and 2008. Areas of increasing
NDVI are associated with WAV in the north-west section of the forest, and RGW in the southern sections of the forest.
Figure 2. Change in ETrF between 27/11/1993 and 3/11/2008
Figure 3. Change in NDVI between 27/11/1993 and 3/11/2008
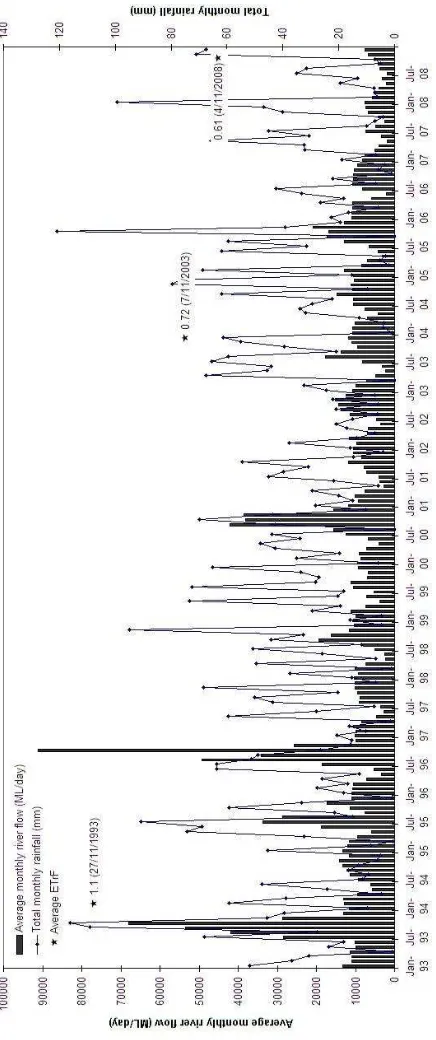
Figure 4 (see next page) presents mean ET rates for the Barmah Forest within a time-series of average monthly river flow volume and monthly rainfall totals. Figure 4 shows high river flow levels during 1993, 1996 and 2000. An average monthly river flow exceeding 24,500 ML/day results in 75% to 80% of the forest area flooding (Dexter and Poynter, 2005; MDBC, 2006). An average monthly river flow exceeding 18,300 ML/day results in 35% to 50% of the forest area flooding (Dexter and Poynter, 2005; MDBC, 2006). Figure 4 also highlights the reduced river flow rates between 2001 and 2008, which are coincident with years of drought in the area.
The mean annual total rainfall in the area is approximately 428 mm. While some years received above average rainfall (1993 (567 mm), 1995 (451 mm), 2003 (516 mm)), most years received below average rainfall. The lowest total recorded over this time frame were 2002 (189 mm) and 2996 (204 mm). Figure 4 also highlights monthly variability in rainfall and shows several key rainfall events in October 1993 (116 mm), November 1998 (94 mm), October 2005 (120 mm) and January 2008 (99 mm).
Figure 4. Monthly mean river flow, monthly total rainfall and average ETrF values for the Barmah Forest between 1993 and 2008
4. DISCUSSION
This study explored the potential of remotely sensed data to contribute to understanding the response of riparian vegetation associated with changes in water availability. Measures of ET and NDVI were derived from satellite data over a 16-year period. ET indicates water availability to existing vegetation, and can be used to assess areas under water-stress. NDVI provides a measure of vegetation cover and can be used as a measure of vegetation primary production or vegetation health,
which are important indicators of general forest condition (Dexter and Poynter, 2005; Sims and Colloff, 2012).
The ET data showed a decline in ET rates of up to 50% for most of the forest (Table 1, Figure 2), in line with declining surface water availability and river flow volumes (Figure 4). These data suggest the entire forest had shifted into a water stressed state. In November 1993 average forest-wide ET rates exceeded a value of one due to the presence of considerable surface water following the large river flow volumes and rainfall events in the preceding months. The spatial pattern of flooding depends on topology and water volume, and the spatial representation of ET values reflects areas where flood and surface waters have a greater influence and highlights areas that remain drier. A high mean ETrF value of 1.28 for WAV in 1993 is indicative of surface water present within areas mapped as this vegetation type. This is expected due to the strong association of this vegetation type with surface water bodies, and has been noted for other vegetation associated with surface water (e.g. flood irrigated rice prior to full crop cover (Whitfield et al., 2010b).
The response in NDVI was less compared with ET rates, which may reflect the slower rates of change associated with tree canopy cover compared with vegetation water use. There was a decrease of approximately 15 % vegetation cover between 1993 and 2008, compared with a 40-60 % decrease in ET rates (Table 1, Figure 3). This difference highlights the power and uniqueness of using multiple assessment indicators. A decline in tree crown condition and regeneration of tree species has been observed within the forest in other studies (Kingsford, 2000; Peake et al., 2011).
There was an increase in NDVI between 1993 and 2003, which may be associated with the above average annual rainfall (516 mm) experienced in 2003. There was also an increase WAV cover (Table 1, Figure 3) between 1993 and 2008, which may be associated with either a decrease in surface water associated with this vegetation type, increased vegetation growth within the extent of this vegetation type, or a combination of both. In particular, there is a noted incursion of rush species and River Red Gum saplings onto the Moira Grass Plains wetland vegetation, which is associated with changes to water availability (Kingsford, 2000; Chong and Ladson, 2003; Lawrence and Colloff, 2008).
The information extracted from the remotely sensed data used in this study provided objective quantitative assessments of the status and water use of riparian vegetation at key points in time. This information can be used in addition to other contextual data to provide assessments of status and water use when the vegetation is considered to be in ‘poor’ condition, for example, in 2008 after multiple years of drought or in ‘good’ condition, for example, in 1993 when water supply was not considered to impact vegetation condition. While the information extracted for vegetation in ‘poor’ condition can be considered to be reliable, information for vegetation in ‘good’ condition may be biased due to the contribution of surface water to NDVI and ET estimates, particularly for WAV (Table 1).
A limitation of the analysis presented is the use of only three images within the 16-year time frame. An improvement to this work would incorporate additional images to provide a more detailed picture of changes in ET rates and NDVI within the forest. The use of additional images would improve the evaluation of vegetation in ‘poor’ and ‘good’ condition as the
nature of riparian environments increases the complexity of these assessments.
Despite these limitations, the results presented demonstrate the potential contribution of satellite-based remotely sensed data to improved understanding of water requirements and vegetation status within the Barmah Forest. The results show that the information provides an important opportunity for monitoring vegetation within riparian ecosystems.
While this study focussed on the Barmah Forest, the nature of remotely sensed data enables the methods presented to be easily applied across broader landscapes. A significant advantage of using satellite-based measurements is that they are affordable, repeatable and offer a comprehensive assessment of a landscape rather than isolated point-based assessments. These characteristics lend themselves to a monitoring system that can be used to assess vegetation responses within riparian systems over time. This information can also be linked with other data sources or surveys (Lawrence and Colloff, 2008; Scott et al., 2008; Sims and Colloff, 2012), as these complex riparian systems require many types of information to make water management decisions and assess the impacts of drought, flood and environmental flows.
Remotely sensed data can be easily integrated with other spatial information such as vegetation mapping, flood extent mapping and digital elevation models. The monitoring potential of remotely sensed data (Anderson et al., 2012) can complement information provided by assessments of flooding requirements of plant species (Bacon et al., 1993; Dexter and Poynter, 2005; Fitzsimons et al., 2011; Peake et al., 2011). This suite of information can provide a more meaningful evaluation of the impacts of changing water availability within riparian systems and evaluate management practices.
5. CONCLUSION
Improved water management in riparian systems can be informed through a greater understanding of how much water is used and how much water is required. To achieve this, an objective, repeatable and affordable measurement system for vegetation status and water use is required. The use of satellite-based assessments of water use to support resource management and monitoring is advocated by Anderson et al (2012). This paper demonstrated the potential contribution of satellite-based measurements to improving understanding of water requirements and vegetation status within the Barmah Forest. Measures of ET and NDVI, analysed in conjunction with rainfall and river flow data, provided insights into the response of vegetation to changes in water availability, which could be can potentially provide important monitoring opportunities within riparian ecosystems.
6. ACKNOWLEDGEMENTS
This work was supported by the Victorian Department of Primary Industries, the Victorian Department of Sustainability
and Environment, the National Water Commission and the CRC Irrigation Futures.
7. REFERENCES
Allen, R. G., Pruitt, W. O., Wright, J. L., Howell, T. A., Ventura, F., Snyder, R., Itenfisu, D., Steduto, P., Berengena, J., Yrisarry, J. B., Smith, M., Pereira, L. S., Raes, D., Perrier, A., Alves, I., Walter, I. & Elliott, R. (2006) A recommendation on standardized surface resistance for hourly calculation of reference ET0 by the FAO56 Penman-Moneith method.
Agricultural Water Management, vol. 81, pp. 1-22.
Allen, R. G., Tasumi, M., Morse, A., Trezza, R., Wright, J. L., Bastiaanssen, W., Kramber, W., Lorite, I. & Robison, C. W. (2007a) Satellite-Based Energy Balance for Mapping Evapotranspiration with Internalized Calibration (METRIC) - Applications. Journal of Irrigation and Drainage Engineering,
vol. 133, pp. 395-406.
Allen, R. G., Tasumi, M. & Trezza, R. (2007b) Satellite-Based Energy Balance for Mapping Evapotranspiration with Internalized Calibration (METRIC) - Model. Journal of
Irrigation and Drainage Engineering, vol. 133, pp. 380-394.
Anderson, M. C., Allen, R. G., Morse, A. & Kustas, W. P. (2012) Use of Landsat thermal imagery in monitoring evapotranspiration and managing water resources. Remote
Sensing of Environment, corrected proof, in press.
Bacon, P. E., Stone, C., Binns, D. L., Leslie, D. J. & Edwards, D. W. (1993) Relationships between water availability and
Eucalyptus camaldulensis growth in a riparian forest. Journal
of Hydrology, vol. 150, pp. 541-561.
Bastiaanssen, W. G. M., Menenti, M., Feddes, R. A. & Holtslag, A. A. M. (1998) A remote sensing surface energy balance algorithm for land (SEBAL). 1. Formulation. Journal of
Hydrology, vol. 212-213, pp. 198-212.
Bastiaanssen, W. G. M., Noordman, E. J. M., Pelgrum, H., Davids, G., Thoreson, B. P. & Allen, R. G. (2005) SEBAL Model with Remotely Sensed Data to Improve Water-Resources Management under Actual Field Conditions. Journal of
Irrigation and Drainage Engineering, vol. 131, pp. 85-93.
Berrisford, M. J., Argent, R. M. & Malano, H. M. (2009) Causes and Consequences of Unutilised Irrigation Orders in the Central River Murray Area. Water Resources Management, vol. 23, pp. 193-217.
Chong, J. & Ladson, A. R. (2003) Analysis and Management of Unseasonal Flooding in the Barmah-Millewa Forest, Australia.
River Research and Applications, vol. 19, pp. 161-180.
Dexter, B. & Poynter, M. (2005) Water, Wood & Wildlife: Opportunities for the Riverain Red Gum Forests of the Central Murray. Victoria, Prepared for the National Asociation of Forest Industries, NSW Forest Productions Association Ltd, Timber Communities Australia Ltd, and Victorian Association of Forest Industries.
Fitzsimons, J., Peake, P., Frood, D., Mitchell, M., Withers, N., White, M. & Webster, R. (2011) Flooding requirements for biodiversity values along the Victorian floodplain of the Murray Valley. The Victorian Naturalist, vol. 128, pp. 48-85.
Glenn, E. P., Neale, C. M., Hunsaker, D. J. & Nagler, P. L. (2011) Vegetation index-based crop coefficients to estimate evapotranspiration by remote sensing in agricultural and natural ecosystems. Hydrological Processes, vol. 25, pp. 4050-4062.
Kingsford, R. T. (2000) Ecological impacts of dams, water diversions and river management on floodplain wetlands in Australia. Austral Ecology, vol. 25, pp. 109-127.
Lawrence, L. & Colloff, M. (2008) Rescuing the Barmah Forest. ECOS, vol. 141, pp. 22-24.
Lindenmayer, D., Hobbs, R., Montague-Drake, R., Alexandra, J., Bennett, A., Burgman, M., Cale, P., Calhoun, A., Cramer, V., Cullen, P., Driscoll, D., Fahrig, L., Fischer, J., Franklin, J., Haila, Y., Hunter, M., Gibbons, P., Lake, S., Luck, G., MacGregor, C., McIntyre, S., Mac Nally, R., Manning, A. D., Miller, J., Mooney, H., Noss, R., Possingham, H. P., Saunders, D. A., Schmiegelow, F., Scott, M., Sisk, T., Walker, B., Wiens, J. A., Woinarski, J. & Zavaleta, E. (2008) A checklist for ecological management of landscapes for conservation. Ecology Letters, vol. 11, pp. 78-91.
MDBC (2006) The Barmah-Millewa Forest. Interim Icon Site Environmental Management Plan 2007-2008. Canberra, ACT, The Murray-Darling Basin Commission.
Peake, P., Fitzsimons, J., Frood, D., Mitchell, M., Withers, N., White, M. & Webster, R. (2011) A new approach to determining environmental flow requirements: Sustaining the natural values of floodplains of the southern Murray-Darling Basin. Ecological Management & Restoration, vol. 12, pp. 1-10.
Scott, R. L., Cable, W. L., Huxman, T. E., Nagler, P. L., Hernandez, M. & Goodrich, D. C. (2008) Multiyear riparian evapotranspiration and groundwater use for a semiarid watershed. Journal of Arid Environments, vol. 72, pp. 1232-1246.
Sheffield, K., Abuzar, M., Whitfield, D., McAllister, A., O'Connell, M. & McClymont, L. (2011) Innovative applications of remotely sensed evapotranspiration and vegetation cover.
Spatial Sciences and Surveying Biennial Conference 2011.
Wellington, New Zealand.
Sims, N. C. & Colloff, M. J. (2012) Remote sensing of vegetation responses to flooding of a semi-arid floodplain: Implications for monitoring ecological effects of environmental flows. Ecological Indicators, vol. 18, pp. 387-391.
Stromberg, J. C., Lite, S. J., Rychener, T. J., Levick, L. R., Dixon, M. D. & Watts, J. M. (2006) Status of the riparian ecosystem in the upper San Pedro river, Arizona: application of an assessment model. Environmental Monitoring and
Assessment, vol. 115, pp. 145-173.
Teixeira, A. H. d. C., Bastiaanssen, W. G. M., Ahmad, M. D. & Bos, M. G. (2009) Reviewing SEBAL input parameters for
assessing evapotransipration and water productivity for the Low-Middle Sao Francisco River basin, Brazil. Part A: Calibration and validation. Agricultural and Forest
Meteorology, vol. 149, pp. 462-476.
Whitfield, D., McAllister, A., Abuzar, M., Sheffield, K., O'Connell, M. & McClymont, L. (2010a) Applications of DPI SEBAL-METRIC to horticultural crops in the Riverland region of South Australia, and riparian vegetation in the Murray River corridor in Victoria. Tatura, Victoria, Department of Primary Industries.
Whitfield, D., McAllister, A., Abuzar, M., Sheffield, K., O'Connell, M. & McClymont, L. (2010b) Measurement, Monitoring and Reporting Systems for improved management of Farm and Regional Water Resources in Australia. Tatura, Victoria, Department of Primary Industries.
Whitfield, D. M., O'Connell, M. G., McAllister, A., McClymont, L., Abuzar, M. & Sheffield, K. (2011) SEBAL-METRIC Estimates of Crop Water Requirement in Horticultural Crops Grown in SE Australia. Acta Hort., vol. 922, pp. 141-148.