PRECISION 3D SURFACE RECONSTRUCTION FROM LRO NAC IMAGES USING
SEMI-GLOBAL MATCHING WITH COUPLED EPIPOLAR RECTIFICATION
Han Hu, Bo Wu*
Department of Land Surveying and Geo-Information, The Hong Kong Polytechnic University, Hum Hom, Kowloon, Hong Kong, (han.hu, bo.wu)@polyu.edu.hk
Commission III, WG II
KEY WORDS: LRO NAC, Epipolar Rectification, Semi-Global Matching, Surface Reconstruction
ABSTRACT:
The Narrow-Angle Camera (NAC) on board the Lunar Reconnaissance Orbiter (LRO) comprises of a pair of closely attached high-resolution push-broom sensors, in order to improve the swath coverage. However, the two image sensors do not share the same lenses and cannot be modelled geometrically using a single physical model. Thus, previous works on dense matching of stereo pairs of NAC images would generally create two to four stereo models, each with an irregular and overlapping region of varying size. Semi-Global Matching (SGM) is a well-known dense matching method and has been widely used for image-based 3D surface reconstruction. SGM is a global matching algorithm relying on global inference in a larger context rather than individual pixels to establish stable correspondences. The stereo configuration of LRO NAC images causes severe problem for image matching methods such as SGM, which emphasizes global matching strategy. Aiming at using SGM for image matching of LRO NAC stereo pairs for precision 3D surface reconstruction, this paper presents a coupled epipolar rectification methods for LRO NAC stereo images, which merges the image pair in the disparity space and in this way, only one stereo model will be estimated. For a stereo pair (four) of NAC images, the method starts with the boresight calibration by finding correspondence in the small overlapping stripe between each pair of NAC images and bundle adjustment of the stereo pair, in order to clean the vertical disparities. Then, the dominate direction of the images are estimated by project the center of the coverage area to the reference image and back-projected to the bounding box plane determined by the image orientation parameters iteratively. The dominate direction will determine an affine model, by which the pair of NAC images are warped onto the object space with a given ground resolution and in the meantime, a mask is produced indicating the owner of each pixel. SGM is then used to generate a disparity map for the stereo pair and each correspondence is transformed back to the owner and 3D points are derived through photogrammetric space intersection. Experimental results reveal that the proposed method is able to reduce gaps and inconsistencies caused by the inaccurate boresight offsets between the two NAC cameras and the irregular overlapping regions, and finally generate precise and consistent 3D surface models from the NAC stereo images automatically.
1. INTRODUCTION
Topographic modelling of planetary surface is essential to planetary exploration missions and scientific research. Although large scale or even global scale topographic models can be obtained from laser altimetric data, e.g. LOLA (Smith et al., 2010) or MOLA (Garvin et al., 1999), the spatial resolutions of these datasets are generally larger (e.g., dozens or hundreds of meters). However, operations or researches such as precision landing, maneuvering for rovers, navigation for astronauts (Wu et al., 2014) and crater morphometry (Watters et al., 2015), require topographic models with meter-level resolution, which can be obtained from the high resolution cameras such as the Narrow Angle Camera (NAC) on board the LRO (Robinson et al., 2010).
Despite the unprecedented spatial resolution of NAC for the lunar surface (up to 0.5 m/pixel), the advantage of higher resolution is at the cost of swath coverage with a limited sensor size (about 2.85). And in order to increase the swath angle, two lenses are bundled together, denoted as NAC-L and NAC-R, with NAC-L off-pointed 2.85 from NAC-R, so that the footprints on the lunar surface only share the same region in the border of both NACs (Robinson et al., 2010). Furthermore, except the tilt angle parallel to the sensor direction, the NAC-R
is also installed slightly forward to NAC-L in the flight direction. Stereographic of NACs are made possible by pointing the satellite to the same region in another orbiter track to form enough convergent angle.
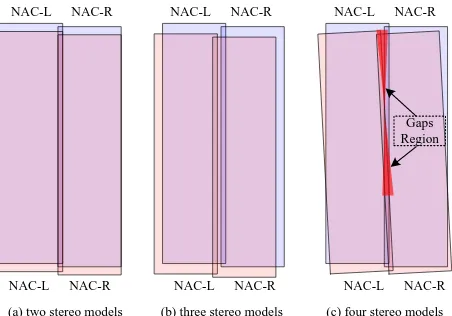
Although the tilt angle between NAC-L and NAC-R is small, they do not share the same lens and thus can not be modelled by a single rigorous camera model. Furthermore, there is possibly non-rigid boresight misalignment during the mission operation (Wu and Liu, 2017), even after precise offline ground calibration in laboratory environment, which further conflicts with a unified camera model. For a stereo pair of NACs, four individual images are involved and in order to create Digital Elevation Model (DEM) covering the whole region, at least two stereo models are required as illustrated in Figure 1(a), when the images overlapped perfectly. However, in most cases three or four models should be formulated as shown in Figure 1(b) and (c). It can be noticed that, except for two major stereo models between NAC-L or NAC-R, there are one or two stereo models between NAC-L and NAC-R form different orbiters. The overlapping area is narrow and irregular, which have impeded the generation of DEM, because most sophisticated dense image matching (DIM) methods would require certain initialization steps from a relative larger context to remove ambiguities of the image matching by geometrical constraint (Furukawa and Ponce, 2010; Wu et al., 2012) and improve the
robustness by global inference (Hu et al., 2016). Thus, gaps in this overlapping areas may exist due to failure of dense image matching in these areas as depicted in Figure 1(c).
(a) two stereo models
Figure 1. Different theoretical model configurations for a stereo pair of NACs. In fact, the last case of four stereo models are the most common one. Please note the irregular overlapping region, which may probably cause gaps because of insufficient matches obtained.
Aiming at solving this issue, this paper proposes a coupled epipolar rectification method, which reduces the number of stereo models between two stereo pairs of NACs to only one. The major observation is that, although we can’t create a single camera model for the two NACs, we could remove the vertical disparities between these two images after bundle adjustment and because the two sensors are almost parallel, the horizontal disparities are also small if not negligible. So we are able to create a seamless mosaic of the two NACs in the epipolar space. After epipolar rectification of the pair of stereographic, we can create only one stereo model between the coupled rectification, which have more regular coverage and more favoured by general dense image matching algorithm, such as the Semi-Global Matching (SGM) (Hirschmuller, 2008; Hu et al., 2016). The disparity image can then be transformed to the original image space and use different camera models of the NACs for space intersection.
2. RELATED WORKS
The data sources for planetary terrain modelling are mainly from two types of sensors: the laser altimeter and stereo satellite images. The first type of sensor, such as Lunar Orbiter Laser Altimeter (LOLA) (Robinson et al., 2010) and Mars Orbiter Laser Altimeter (MOLA) (Smith et al., 2001), measures the range from the spacecraft to the planet surface and with the help of ephemeris and attitude information of the spacecraft, the point position is directly available. Although the point spacing along the orbiter is quite dense, only one stipe of points is available and the final DEM generated from the laser altimeter suffers from the anisotropic density distribution. On the other hand, the points generated from stereo measurement of satellite images distribute more evenly and have better spatial resolution, more recent investigations start to exploit DEM generated from stereo images (Li et al., 2011; Di et al., 2014; Watters et al., 2015). DIM is the fundamental step to generate image correspondences and create topographic model from stereo image pairs and two prevailing DIM strategies exist, the local and global methods, which are categorized by the use of
smoothness constraints and the inference of disparities (Scharstein and Szeliski, 2002; Hu et al., 2016).
The dense image matching can be interpreted as the procedure to find a nearest neighbour field (NNF) of the 2D base image (Barnes et al., 2009) in the similarity space. To reduce the search complexity, epipolar geometry is generally used to constrain the search to one dimensional. Unlike the epipolar rectification for the frame camera (Loop and Zhengyou, 1999; Fusiello et al., 2000), the epipolar geometry of the pushbroom sensors for most satellite images is not a straight line on stereo pairs, but a hyperbola (Kim, 2000; Hirschmuller, 2008). Fortunately, because the attitude changes during the collection of a single scene are small, the complicated epipolar geometry can be approximated through some simple functions, including the affine transformation (Wang et al., 2011), the second order polynomial (Oh et al., 2010) or the homographic transformation (de Franchis et al., 2014). After the approximate epipolar rectification, the vertical disparity will be removed.
In addition to the epipolar constraint, spatial constraints or global smooth prior on a large context are commonly exploited in most DIM algorithms. These constraints or priors are used to remove the ambiguities of image matching in a small local window, which may be caused by repeated texture or textureless area (Scharstein and Szeliski, 2002; Hu et al., 2016). For local methods, the Delaunay triangulation is exploited to assist the propagation and searching of nearby matches (Furukawa and Ponce, 2010; Wu et al., 2012). Expanding the best match that is randomly sampled to nearby also requires larger overlapped region (Barnes et al., 2009). Furthermore, global methods will generally formulated the image matching as an discrete optimization problem, which may be formulated as Markov Random Field (MRF) (Kolmogorov and Zabih, 2001) or dynamic programming (Scharstein and Szeliski, 2002) and explicitly impose smooth constraint in the optimization in a larger context.
Because the irregular overlapping of NACs as described above, the performance of DIM methods will generally degrade or even fail when three or four stereo models are generated for one NAC stereo pair (Tran et al., 2010). This is especially severe for SGM (Hirschmuller, 2008; Hu et al., 2016), which aggregates matching cues through the whole scan lines and adopts contour information. However, this problem is gracefully handled through the coupled epipolar rectification method, which not only reduce the matching problem to only one stereo model, but also remove the problem of irregular overlap region and reduce possible gaps in the final matches.
3. METHODS
3.1 Workflow
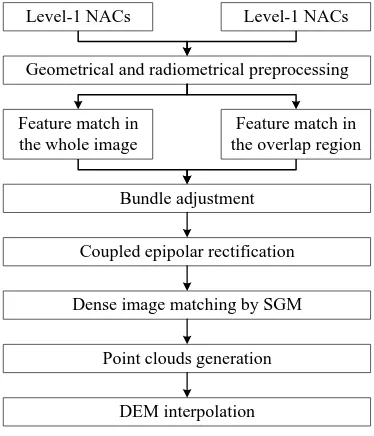
Before the description of the coupled epipolar rectification and DEM generation, we demonstrate the whole workflow, including some important preprocessing and bundle adjustment to fix the systematic errors of the exterior orientation parameters between the intra-orbiter and inter-obiter NACs. The whole workflow is shown in Figure 2.
The input for the method is just a stereo pair of NACs, which should be processed to level-1 CDR (Calibrated Data Records) products from the original EDR (Experiment Data Record) (ASU, 2010) using the ISIS3 software (USGS, 2017). This will remove the noises in NAC images and enrich the image with the
EO information extracted from the SPICE kernel. Because the camera frame coordinate system for NAC-L and NAC-R are different (Robinson et al., 2010), the rotation matrix are converted to the same system by multiplying a rotation matrix O, as denoted in the following equation,
x= f(OR(X-C))+x0 (1)
where, x is the image measurements, f is the focal length, :
32 is the projection function from 3D to 2D, R is the rotation matrix obtained in Level-1 NAC, X is the object point position in the geocentric frame, C is the translate part of EO parameter, x0is the principal point. And for NAC-L and NAC-R
the definitions of O are different as below,
OL=Rz(/2), OR=Rx()Rz(/2) (2)
in which Rx and Rz denotes the rotation matrix around the x and
z axis for a specific angle. After correction of the rotation matrix, the third order polynomial functions and 78 RPC parameters (Grodechi and Dial, 2003) are fitted for fast projection and bundle adjustment. The contrast of the images is adjusted through a simple percent clip and normalized to 8 bit for further processing.
Figure 2. Workflow of the methods.
For the feature match, SIFT features are detected across the whole images and matched using approximated nearest neighbour search (Muja and Lowe, 2014), followed by ratio check and RANSAC (Random Sample Consensus) (Moisan et al., 2012) to remove outliers. Furthermore, because the overlapped region only covers a small area of the whole image, in order to reduce the search space, geometry guided matches are detected in these regions. After feature match, a combined bundle adjustment is conducted for all the four images. Because no ground control points are available on the moon surface, the free network bundle adjustment is used, with user provided weights for the pseudo observations (Fraser and Ravanbakhsh, 2009). After the bundle adjustment, the images are rectified into the horizontal epipolar space and SGM is used for the generation of point clouds and DEM, which will be described below.
3.2 Coupled Epipolar Rectification of LROC NAC Pair
As described above, the epipolar geometry for the pushbroom satellite images is not a straight line. Because the sensor size for
the NAC image is relatively small and the attitude variation during the collection in one orbiter is negligible, we have found that the affine model (Wang et al., 2011) is enough to describe the epipolar space.
The basic idea is to determine a series of epipolar curve and align each vertical scanline of the epipolar image parallel to the epipolar curve as shown in the center of Figure 3(b). The generation of a single epipolar curve is an analogue of the intersection of epipolar plane and image frame for the frame camera as denoted pseudo-epipolar plane as shown in Figure 3(a). We iteratively project and back-project inside the pseudo-epipolar plane to obtain a series of points as described in Table 1. Although this series of points should be mathematical described by a hyperbola (Kim, 2000), in practice, it is enough to be fitted by a straight line. The direction of this line will help to determine the dominant direction of the epipolar curve and unlike the work by Wang et al. (2011), in which only one curve is involved, we offset the initial point p1 orthogonal to the curve
by a certain distance (512 pixels is used in this paper), and trace a series of curves for both NAC-L and NAC-R. Then the average direction is used for the dominant direction.
(a) Determination of the epipolar curve by iteratively projection and back-projection in the pseudo-epipolar plane; and (b) affine resample of the epipolar image.
After tracing all the epipolar curves on the NACs, the image points are back-projected to the center plane h0 of this area in a
projected coordinate system and Mercator projection is used for its simplicity. The dominant direction is estimated using all the epipolar curves and this direction determines the rotation part of the affine transformation between the epipolar image and projected object space, by which the x axis of the epipolar image is aligned parallel to the dominant direction. Then given a ground sample distance of the epipolar image, the scale part of the affine transformation is also determined. In this way, an one-on-one map between the epipolar image and object space is established as shown in the center and right part of Figure 3(b).
In order to get the pixel value of the epipolar image, the object point is first project to the corresponding NAC-L, if the image point falls outside of NAC-L, then project to NAC-R. In
addition, a mask is also recorded, indicated the pixel on the epipolar space comes from which NAC image. In this way, we are able to use the correct camera model for space intersection.
Table 1. Algorithm for tracing an epipolar curve. TraceEpipolarCurve
Input: The EO information of a pair of NACs and the center of the forward image as p1.
2. Project Pi to the corresponding backward NAC as qi
3. Back-project qi to the maximum plane as Qi
4. Project Qi to the corresponding forward NAC as pi+ 1
Swap the minimum and maximum plane and repeat the above procedure, this will make the epipolar curve march to the opposite direction
3.3 SGM Matching and 3D Surface Reconstruction
After the coupled epipolar rectification, the texture aware SGM (Hu et al., 2016) is adopted to generate a disparity image. The SGM is an extension of dynamic programming, which uses 16 aggregated directions rather than only one direction along the horizontal scanline. In each direction r, SGM solves the
where p is the current pixel; C(p,d) measures the matching cost or dissimilarity at disparity of d; P1 and P2 controls the
smoothness of discontinuities of one pixel and larger than two pixels, respectively. These two parameters are tuned adaptively according to the image contours, which means that, at the object boundaries, the texture aware SGM allows larger fluctuation of disparities (Hu et al., 2016).
After the above SGM, we obtain a disparity map d(p) of the epipolar image. The disparity map indicates that for each pixel
p(x,y) in the coupled epipolar image of the first orbiter, the correspondence in the epipolar image of the second orbiter is
p'(x+d(p),y). Furthermore, we can acquire a Boolean value b(p) and b'(p') from the accompanying mask for each epipolar image, which describes whether to project to NAC-L or NAC-R using the transformation indicated in Figure 3(b). Then the corresponding EO parameters are used to triangulate an object point. After processing all the valid disparities in the epipolar space, the point clouds are interpolated using inverse distance weighting to the gridded DEM.
4. EXPERIMENTAL EVALUATIONS
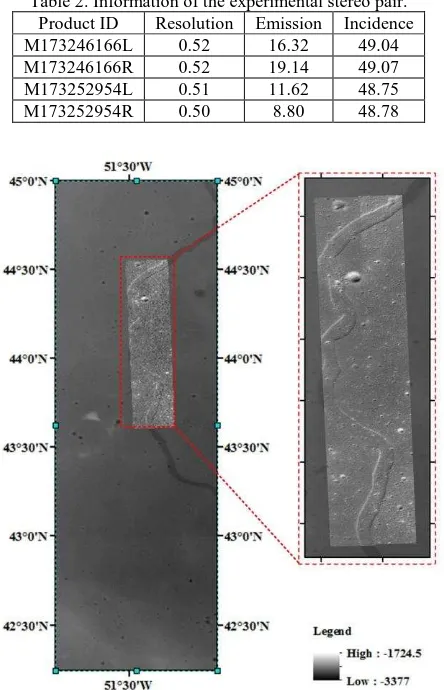
In order to evaluate the performance of the proposed method, we adopt a stereo pair of NACs for the reconstruction of DEM. The details of the stereo pair are listed in Table 2. It could be noted that the convergent angle of the two pairs of NACs are formulated by banking the satellite across the orbiter direction. Figure 4 overlays the NACs in the first track on top of the SLDEM. The center of the two NACs is around 44N and 51.5W. The images cover part of a long lunar Rille, which is
possibly formulated from a lava channel in the early age of the moon. An enlarged view of the georeferenced images is also shown in the right part of Figure 4.
Table 2. Information of the experimental stereo pair. Product ID Resolution Emission Incidence
M173246166L 0.52 16.32 49.04
M173246166R 0.52 19.14 49.07
M173252954L 0.51 11.62 48.75
M173252954R 0.50 8.80 48.78
Figure 4. The two NACs of product M173246166 overlaid on the SLDEM. The images mainly cover part of a long lunar Rille.
For the bundle adjustment, we extracted SIFT points in both the whole images and the overlap region between NAC-L and NAC-R separately. This is to reduce the searching space of feature matching. After feature matching and tracks connection, 23253 object points are formulated. In the bundle adjustment, we remove several outliers through the 68–95–99.7 rule of 3, and 23043 object points contribute to the final bundle adjustment, with a subpixel level of 0 at 0.7 pixel. This
indicates a successful bundle adjustment.
Because after the epipolar rectification, in theory the vertical disparities in the images are removed, it is possible for the human to have a perception of stereo effect formulated by the two epipolar images, as long as each eye only see a single epipolar image. This not only provide an effective method for direct 3D measurements, but also a quick approach for qualitative evaluation of the epipolar rectification. Because if the rectification is not satisfactory, large vertical disparities will be presented in the two epipolar images and the stereo effects are degraded, together with visually observable noises.
Figure 5. Anaglyphs of the whole epipolar images and selected regions. The enlarged views through a to d indicated the blue shaded box in the left thumbnails from top to bottom. The color bias in the middle of the anaglyphs is caused by the color inconsistency between the NAC-L and NAC-R. The color mode of the anaglyphs are red/left to cyan/right, please wear corresponding filter glasses for stereo effects.
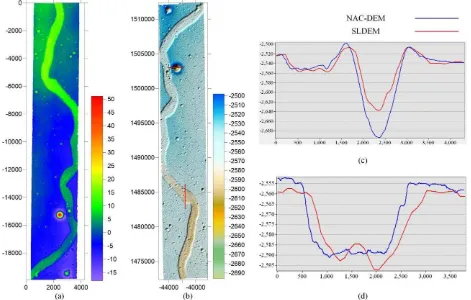
Figure 6. Disparity map and DEM of the stereo pair. (a) Disparity map of the coupled rectification images; (b) shaded relief map of the DEM, the elevation is exaggerated for 5 times to better reveal the terrain surface; (c) and (d) profiles comparisons of the horizontal and vertical red lines in (b), respectively, between the SLDEM and NAC-DEM.
In this paper, we create anaglyphs by overlaying the two grayscale images, with the red channel for the left epipolar image and green and blue channels for the right epipolar image. This is commonly known as the red-cyan stereo mode. The whole anaglyph is located in the left part of Figure 5, in which the shaded blue squares indicated enlarged views of four representative areas along the Rille. The squares from top to the bottom represents subfigures Figure 5 (a) through (d), respectively. With corresponding filters, it could be noticed that the anaglyphs show strong stereo effects, which indicates the quality of epipolar rectification is good, with no visually vertical disparities. In addition, there is some color bias in the middle of the anaglyphs as Figure 5 (c) and (d), this is caused by the color difference inherently between NAC-L and NAC-R as shown in the right part of Figure 4.
For the surface reconstruction, the sampling distance of the final DEM is set to 2 meters, which is a commonly used DEM sampling strategy at 3-5 times of the original image resolution. The matching results are shown in Figure 6, in which the disparity maps of the coupled epipolar image for NACs of the first orbiter is shown in Figure 6 (a), the shaded relief map of the DEM is shown in Figure 6 (b). In addition, two profiles comparisons between SLDEM and NAC-DEM are shown in Figure 6 (c) and (d), it could be noted that, the NAC-DEM have more detail information than that of the SLDEM, and the crater is obviously deeper than that of SLDEM, this is probably due to that the SLDEM have few points sampled in the crater and the DEM is excessively interpolated, thus the depth is shallower. Furthermore, we have noticed slightly shift between the profile comparisons, this is due to the systematically errors in the EO parameters of the NACs, which is also observed in previous work (Tran et al., 2010).
5. CONCLUSIONS
In this paper, we have introduced a coupled epipolar rectification methods for the surface reconstruction using LROC NAC images. This method resample the NAC-L and NAC-R that is bundled in the same platform but with two different lenses into the same epipolar image. In this way, the number of stereo models required to reconstruct the whole overlapped areas is reduced from three to four to only one. Furthermore, the problem of irregular shaped stereo model between NAC-L and NAC-R from two orbiters is solved. In this way, we could alleviate the gaps between the overlapping area.
Experimental evaluations show that from both the anaglyphs and DEM, there are no visually significant inconsistencies or noises in the overlapped area between NAC-L and NAC-R, which proves the coupled epipolar rectification model is tenable. Furthermore, despite the systematically shift between the obtained NAC-DEM and SLDEM, the vertical difference between the two DEMs is, in general, below 5 meters, which proves that the proposed method will not introduce any geometrical errors.
ACKNOWLEDGEMENTS
The work was supported by a grant from the Research Grants Council of Hong Kong (Project No: PolyU 152086/15E) and a grant from the National Natural Science Foundation of China (Project No: 41471345).
REFERENCE
ASU, 2010. LROC EDR/CDR Data Product Software Interface Specification, http://lroc.sese.asu.edu/data/LRO-L-LROC-2-EDR-V1.0/LROLRC_0001/DOCUMENT/LROCSIS.PDF. (Accessed 3rd June, 2017)
Barnes, C., Shechtman, E., Finkelstein, A., Goldman, D., 2009. PatchMatch: A randomized correspondence algorithm for structural image editing. ACM Transactions on Graphics-TOG 28 (3), pp. 24.
de Franchis, C., Meinhardt-Llopis, E., Michel, J., Morel, J., Facciolo, G., 2014. On stereo-rectification of pushbroom images. In: Proc. Image Processing (ICIP), 2014 IEEE International Conference on, IEEE, pp. 5447-5451.
Di, K., Liu, Y., Liu, B., Peng, M., Hu, W., 2014. A Self-Calibration Bundle Adjustment Method for Photogrammetric Processing of Chang'E-2 Stereo Lunar Imagery. IEEE Transactions on Geoscience and Remote Sensing 52 (9), pp. 5432-5442.
Fraser, C., Ravanbakhsh, M., 2009. Georeferencing performance of GEOEYE-1. Photogrammetric Engineering and Remote Sensing 75 (6), pp. 634-638.
Furukawa, Y., Ponce, J., 2010. Accurate, dense, and robust multiview stereopsis. IEEE Transactions on Pattern Analysis and Machine Intelligence 32 (8), pp. 1362-1376.
Fusiello, A., Trucco, E., Verri, A., 2000. A compact algorithm for rectification of stereo pairs. Machine Vision and Applications 12 (1), pp. 16-22.
Garvin, J.B., Sakimoto, S., Schnetzler, C., Frawley, J.J., 1999. Global geometric properties of Martian impact craters: A preliminary assessment using Mars Orbiter Laser Altimeter (MOLA).
Grodechi, J., Dial, G., 2003. Block adjustment of high-resolution satellite images described by rational polynomials. Photogrammetric Engineering and Remote Sensing 69 (1), pp. 59-68.
Hirschmuller, H., 2008. Stereo processing by semiglobal matching and mutual information. IEEE Transactions on Pattern Analysis and Machine Intelligence 30 (2), pp. 328-341.
Hu, H., Chen, C., Wu, B., Yang, X., Zhu, Q., Ding, Y., 2016. Texture-Aware Dense Image Matching using Ternary Census Transform. ISPRS Annals of the Photogrammetry, Remote Sensing and Spatial Information Sciences III-3, pp. 59-66.
Kim, T., 2000. A study on the epipolarity of linear pushbroom images. Photogrammetric Engineering and Remote Sensing 66 (8), pp. 961-966.
Kolmogorov, V., Zabih, R., 2001. Computing visual correspondence with occlusions using graph cuts. In: Proc. 9th IEEE International Conference on Computer Vision (ICCV2001), IEEE, Vancouver, British Columbia, Canada, July 7-14, pp. 508-515.
Li, R., Hwangbo, J., Chen, Y., Di, K., 2011. Rigorous Photogrammetric Processing of HiRISE Stereo Imagery for Mars Topographic Mapping. IEEE Transactions on Geoscience and Remote Sensing, 49 (7), pp. 2558-2572.
Loop, C., Zhengyou, Z., 1999. Computing rectifying homographies for stereo vision. In: Proc. Computer Vision and Pattern Recognition. IEEE Computer Society Conference on., pp. 131 Vol. 1.
Moisan, L., Moulon, P., Monasse, P., 2012. Automatic homographic registration of a pair of images, with a contrario elimination of outliers. Image Processing On Line 2, pp. 56-73.
Muja, M., Lowe, D.G., 2014. Scalable Nearest Neighbor Algorithms for High Dimensional Data. IEEE Transactions on Pattern Analysis and Machine Intelligence 36 (11), pp. 2227-2240.
Oh, J., Lee, W.H., Toth, C.K., Grejner-Brzezinska, D.A., Lee, C., 2010. A Piecewise Approach to Epipolar Resampling of Pushbroom Satellite Images Based on RPC. Photogrammetric Engineering and Remote Sensing 76 (12), pp. 1353-1363.
Robinson, M.S., Brylow, S.M., Tschimmel, M., Humm, D., Lawrence, S.J., Thomas, P.C., Denevi, B.W., Bowman-Cisneros, E., Zerr, J., Ravine, M.A., 2010. Lunar reconnaissance orbiter camera (LROC) instrument overview. Space science reviews 150 (1), pp. 81-124.
Scharstein, D., Szeliski, R., 2002. A taxonomy and evaluation of dense two-frame stereo correspondence algorithms. International Journal of Computer Vision 47 (1), pp. 7-42.
Smith, D.E., Zuber, M.T., Frey, H.V., Garvin, J.B., Head, J.W., Muhleman, D.O., Pettengill, G.H., Phillips, R.J., Solomon, S.C., Zwally, H.J., 2001. Mars Orbiter Laser Altimeter: Experiment summary after the first year of global mapping of Mars. Journal of Geophysical Research: Planets 106 (E10), pp. 23689-23722.
Smith, D.E., Zuber, M.T., Jackson, G.B., Cavanaugh, J.F., Neumann, G.A., Riris, H., Sun, X., Zellar, R.S., Coltharp, C., Connelly, J., 2010. The lunar orbiter laser altimeter investigation on the lunar reconnaissance orbiter mission. Space science reviews 150 (1), pp. 209-241.
Tran, T., Rosiek, M.R., Howington-Kraus, E., Archinal, B.A., Anderson, E., Team, L.S., 2010. Generating digital terrain models using LROC NAC images. In: Proc., pp. 15-19.
USGS, 2017. Integrated Software for Imagers and Spectrometers, https://isis.astrogeology.usgs.gov/. (Accessed 3rd June, 2017)
Wang, M., Hu, F., Li, J., 2011. Epipolar resampling of linear pushbroom satellite imagery by a new epipolarity model. ISPRS Journal of Photogrammetry and Remote Sensing 66 (3), pp. 347-355.
Watters, W.A., Geiger, L.M., Fendrock, M., Gibson, R., 2015. Morphometry of small recent impact craters on Mars: Size and terrain dependence, short‐term modification. Journal of Geophysical Research: Planets 120 (2), pp. 226-254.
Wu, B., Hu, H., Guo, J., 2014. Integration of Chang'E-2 imagery and LRO laser altimeter data with a combined block adjustment for precision lunar topographic modeling. Earth and Planetary Science Letters 391, pp. 1-15.
Wu, B., Liu, W.C., 2017. Calibration of boresight offset of LROC NAC imagery for precision lunar topographic mapping. ISPRS Journal of Photogrammetry and Remote Sensing 128, pp.
372-387.
Wu, B., Zhang, Y., Zhu, Q., 2012. Integrated point and edge matching on poor textural images constrained by self-adaptive triangulations. ISPRS Journal of Photogrammetry and Remote Sensing 68, pp. 40 - 55.